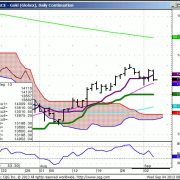
September 4, 2013 - MDT - Precious Metals & Oil
While the Diary of a Mad Hedge Fund Trader focuses on investment over a one week to six-month time frame, Mad Day Trader, provided by Jim Parker, will exploit money-making opportunities over a brief ten minute to three day window. It is ideally suited for day traders, but can also be used by long-term investors to improve market timing for entry and exit points.
OIL...resistance is clearly defined @ 108.75. A close below 106.80
precipitates more weakness.
Silver...23.40 is the bottom of support shown on the long term point & figure chart.
Gold...1437 is monthly resistance. 1377 must be penetrated for any sustained downside. The long term Point & figure chart shows this is winding up for a move, which typically happens on unemployment Friday.
With the Equity Indices Bid, investors will continue to sell the metals on rallies looking for higher returns in stocks.
For Glossary of terms and abbreviations click here.


