Investors are so out of position it hurts.
I have always believed that markets will always do whatever they have to do to screw the most people and it is doing that right now with a vengeance.
Some $750 billion has poured into cash and equivalents since January 1. Margin debt is now at the Dotcom bust low of 1.4% of the S&P 500 not seen since 2002. Equity Allocations are at a 15 Year Low, with massive amounts of cash in 90-day T-bills now yielding 5.25%.
The broader market is expensive looking at 19 times 2023 earnings. But take out the top five performing FANGS and we are down to a very reasonable 15 times for the remaining 495 stocks.
I told you this would happen, that the bear market ended on October 15 and that big tech would lead any recovery. I reiterated this view in depth with my 2023 All Asset Class Review on January 4 (click here for the link).
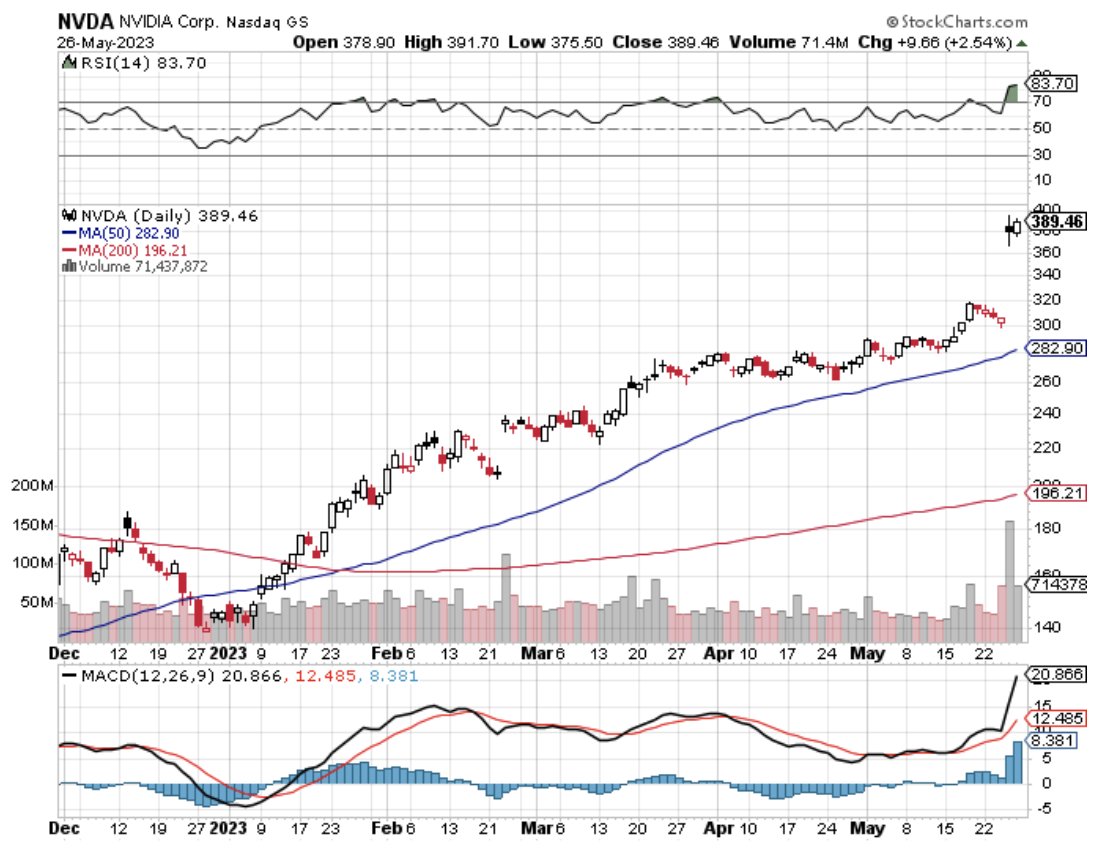
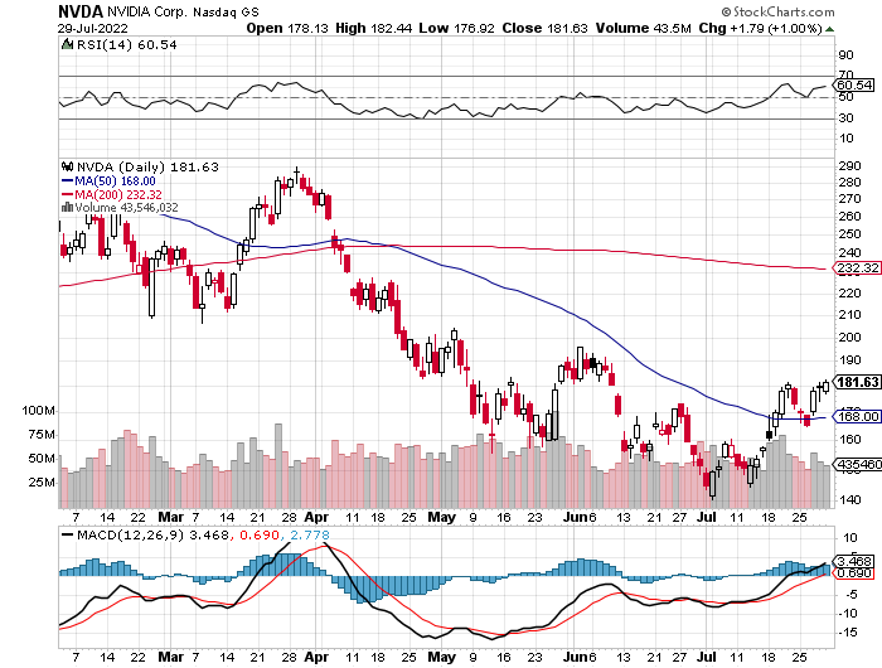
In the meantime, a lot of investors had angry conversations with investment advisors this week as to why they didn’t own NVIDIA (NVDA). They heard it was too expensive, that it had already moved too much (triple since October 15), the government was going default on its debt, and that we were headed into recession.
Suffice it to say that if they lived here with me in Silicon Valley, they wouldn’t take this view. The world is going NVIDIA crazy on a huge earnings beat, taking the shares up 30%. Q1 revenues came in at $7.2 billion versus an expected $6.5 billion. Demand from AI and data centers is surging.
(NVDA) has been a core Mad Hedge holding since it went public a decade ago. It is now up 175-fold and has at least another seven bagger ahead of it. (NVDA) has matched the 175-fold gain we caught with our 2010 recommendation for Tesla. The (NVDA) January 2025 LEAPS I recommended on September 29 at 50 cents is now worth $6.25 and expires worth $10, up 20-fold!
It all vindicates my own long-term vision, unique in the investing community, that in the coming decade, technology profits will more than replace the Fed liquidity we feasted on during the 2010s.
The Internet has created about $10 trillion in value since inception. AI will create a lot more than that. That’s what will take the Dow from 33,000 to 240,000.
In the meantime, new home building is incredibly going from strength to strength and is one of the few domestic sides of the economy that is prospering mightily. New Home Sales hit a 13-Month High, up 4.1% in April. If you had told me five years ago that while 30-year fixed mortgage rates were at a two-decade high of 7.0%, demand for new homes was so strong that builders were running out of inventory, I would have told you that you were out of your mind.
Yet, here we are.
This is because half of the builders that went bust in the 2008 subprime housing crash never came back, creating a structural shortage of homes that will take 20 years to return to balance.
Baby boomers now aged 61 to 78 rushed to buy homes in their late 20s during the prosperity of the 1960s and 1970s. Only 10% paid cash for their homes, many of whom worked on Wall Street, like me.
Some 75 million Millennials are now buying homes in their mid 30’s and are therefore much wealthier than previous generations. Working in tech like my kids, some 35% are paying all cash and are immune to the interest rate cycle. That means they can afford much nicer homes than we boomers could.
Those who do borrow plan to refi quickly in a year or two when mortgages are back below 5.0%. Then the residential real estate will absolutely catch on fire. Buy (TOL), (LEN), (KBH), and (PHM) on dips.
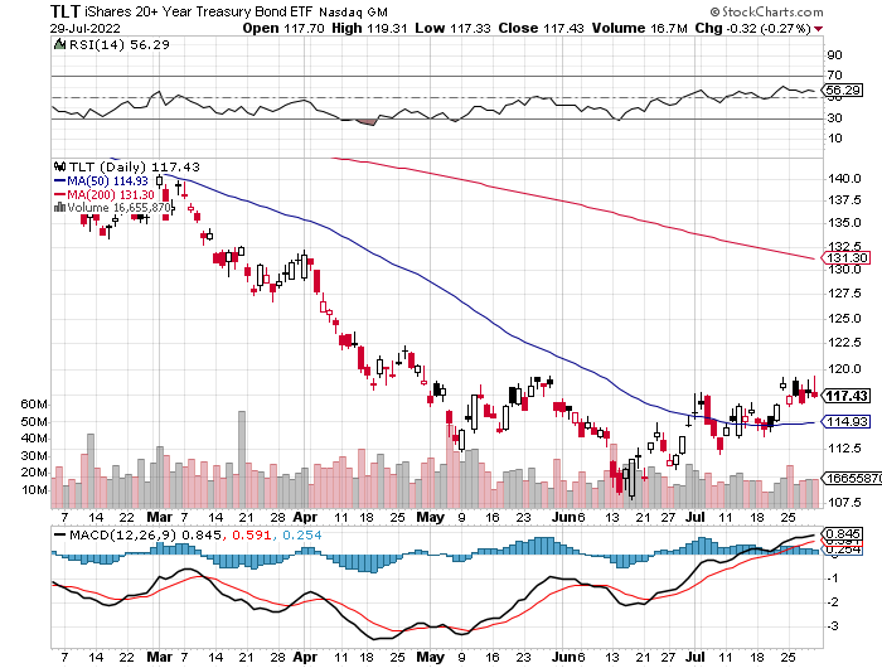
Oh, and buy boatloads of bonds (TLT) too.
There is another angle to the story that is fascinating. High housing prices are turning Yankees into Confederates and Hawaiians into cowboys.
An onslaught of my friends have recently retired from New York for the green hills of North Carolina. The problem is that if I moved there, they’d be burning crosses on my front lawn in the first week.
Natives Hawaiians have fled their green hills for the Nevada deserts because they can’t afford to live there anymore, moving from an $800,000 median homes price to $400,000. When I was in Las Vegas a few weeks ago, I noticed ads for a hula contest, Hawaiian language lessons at the county library, and SPAM at Safeway. Outrigger canoes have been spotted on a disappearing Lake Mead. The chief complaint? Leis wilt a lot faster in the dry desert air.
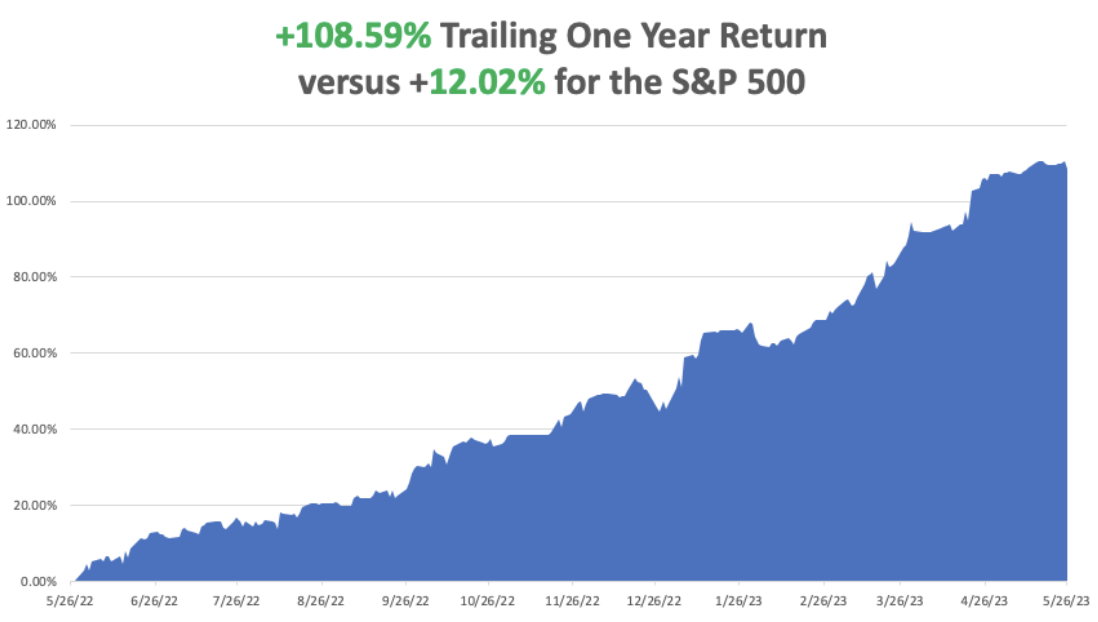
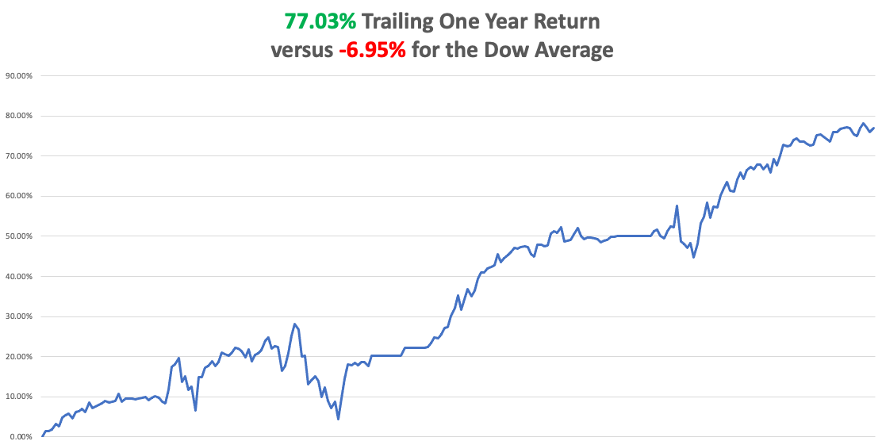
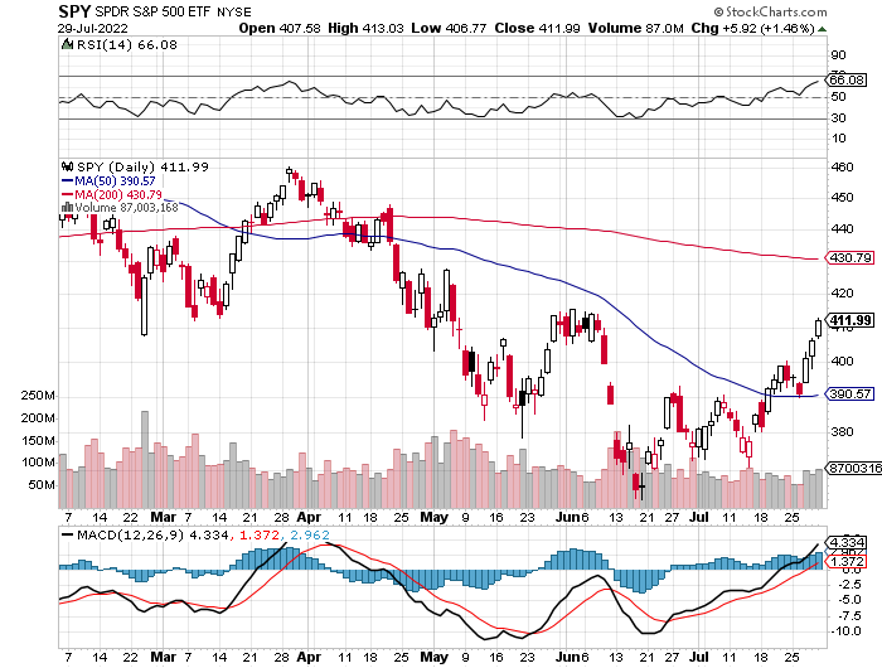
So far in May, I have managed a modest 1.38% profit. My 2023 year-to-date performance is now at an eye-popping +63.13%. The S&P 500 (SPY) is up only a miniscule +10.53% so far in 2023. My trailing one-year return reached a 15-year high at +108.59% versus +12.02% for the S&P 500.
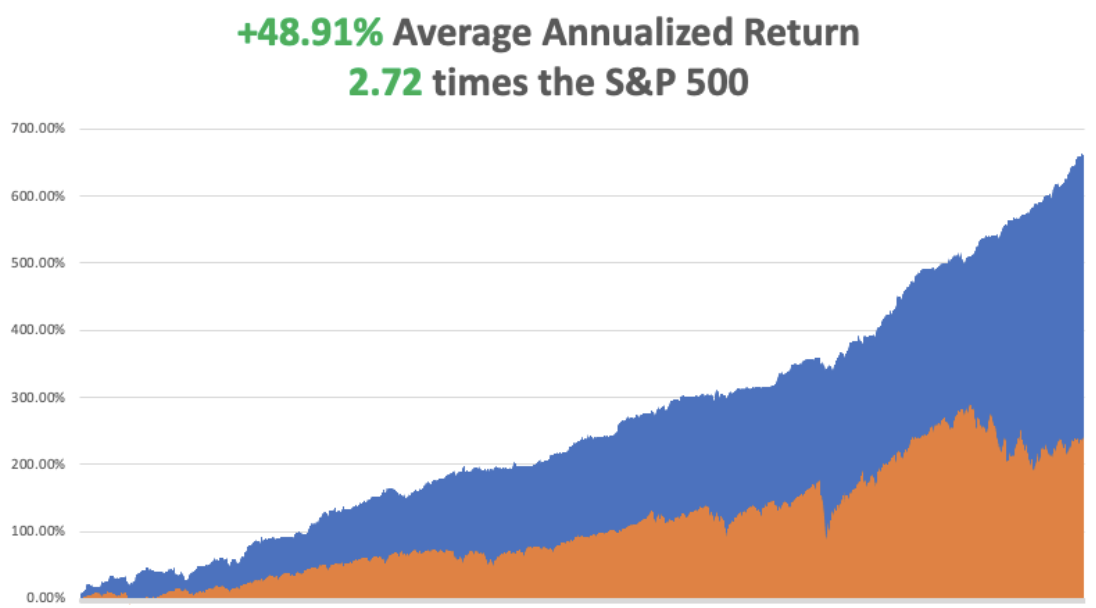
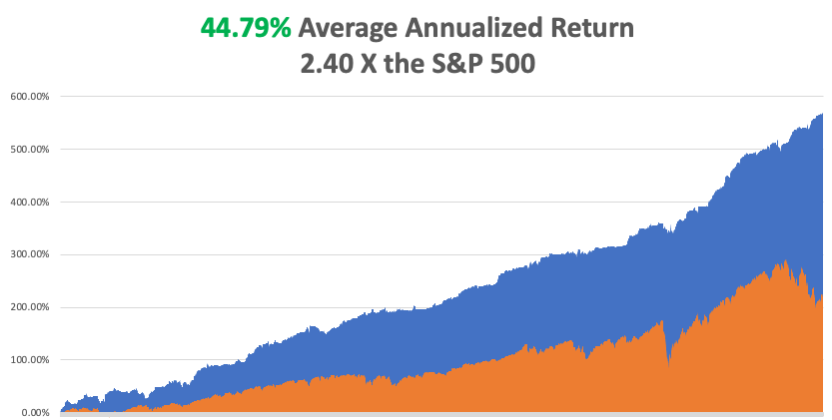
That brings my 15-year total return to +660.32%. My average annualized return has blasted up to +48.91%, another new high, some 2.72 times the S&P 500 over the same period.
Some 41 of my 44 trades this year have been profitable. My last 22 consecutive trade alerts have been profitable.
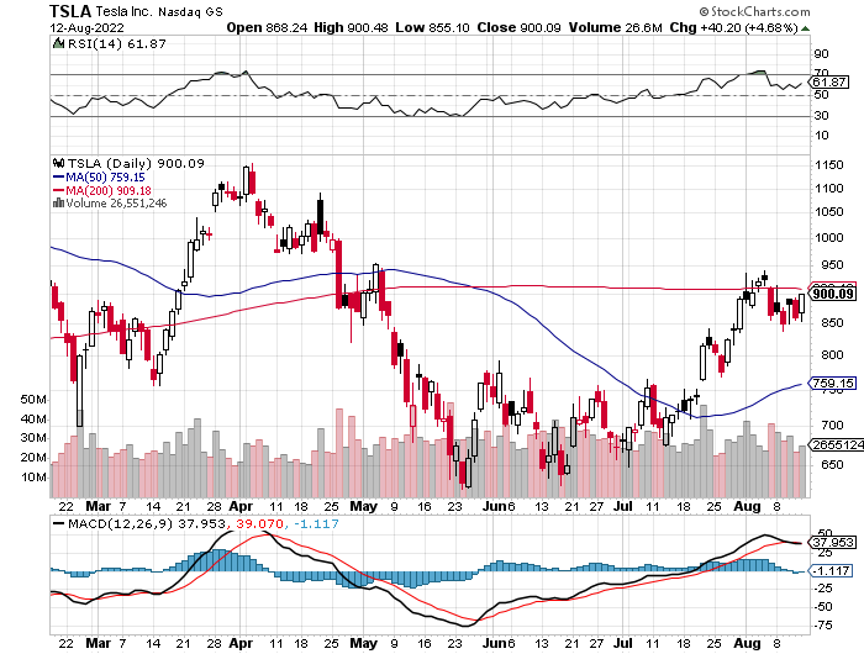
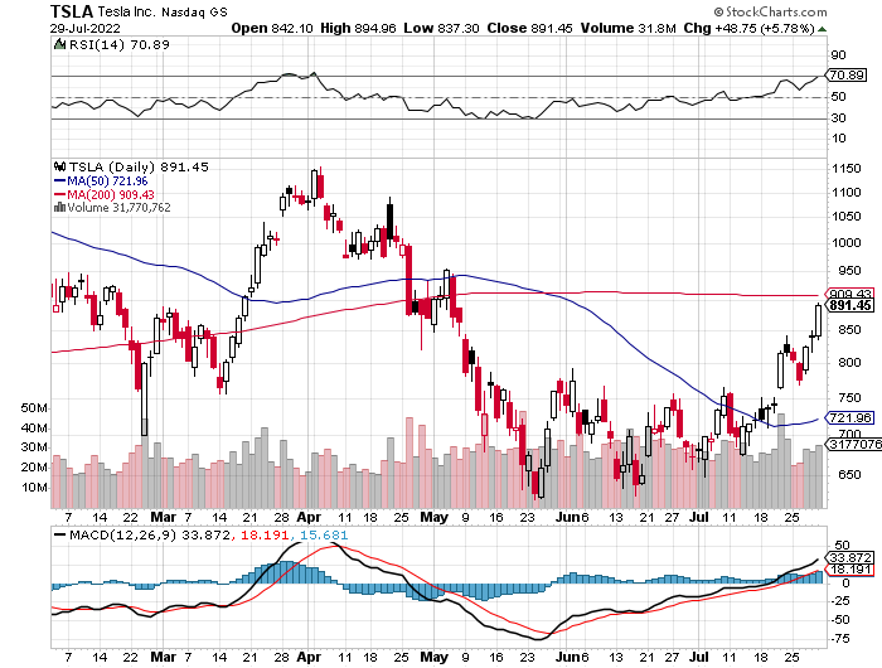
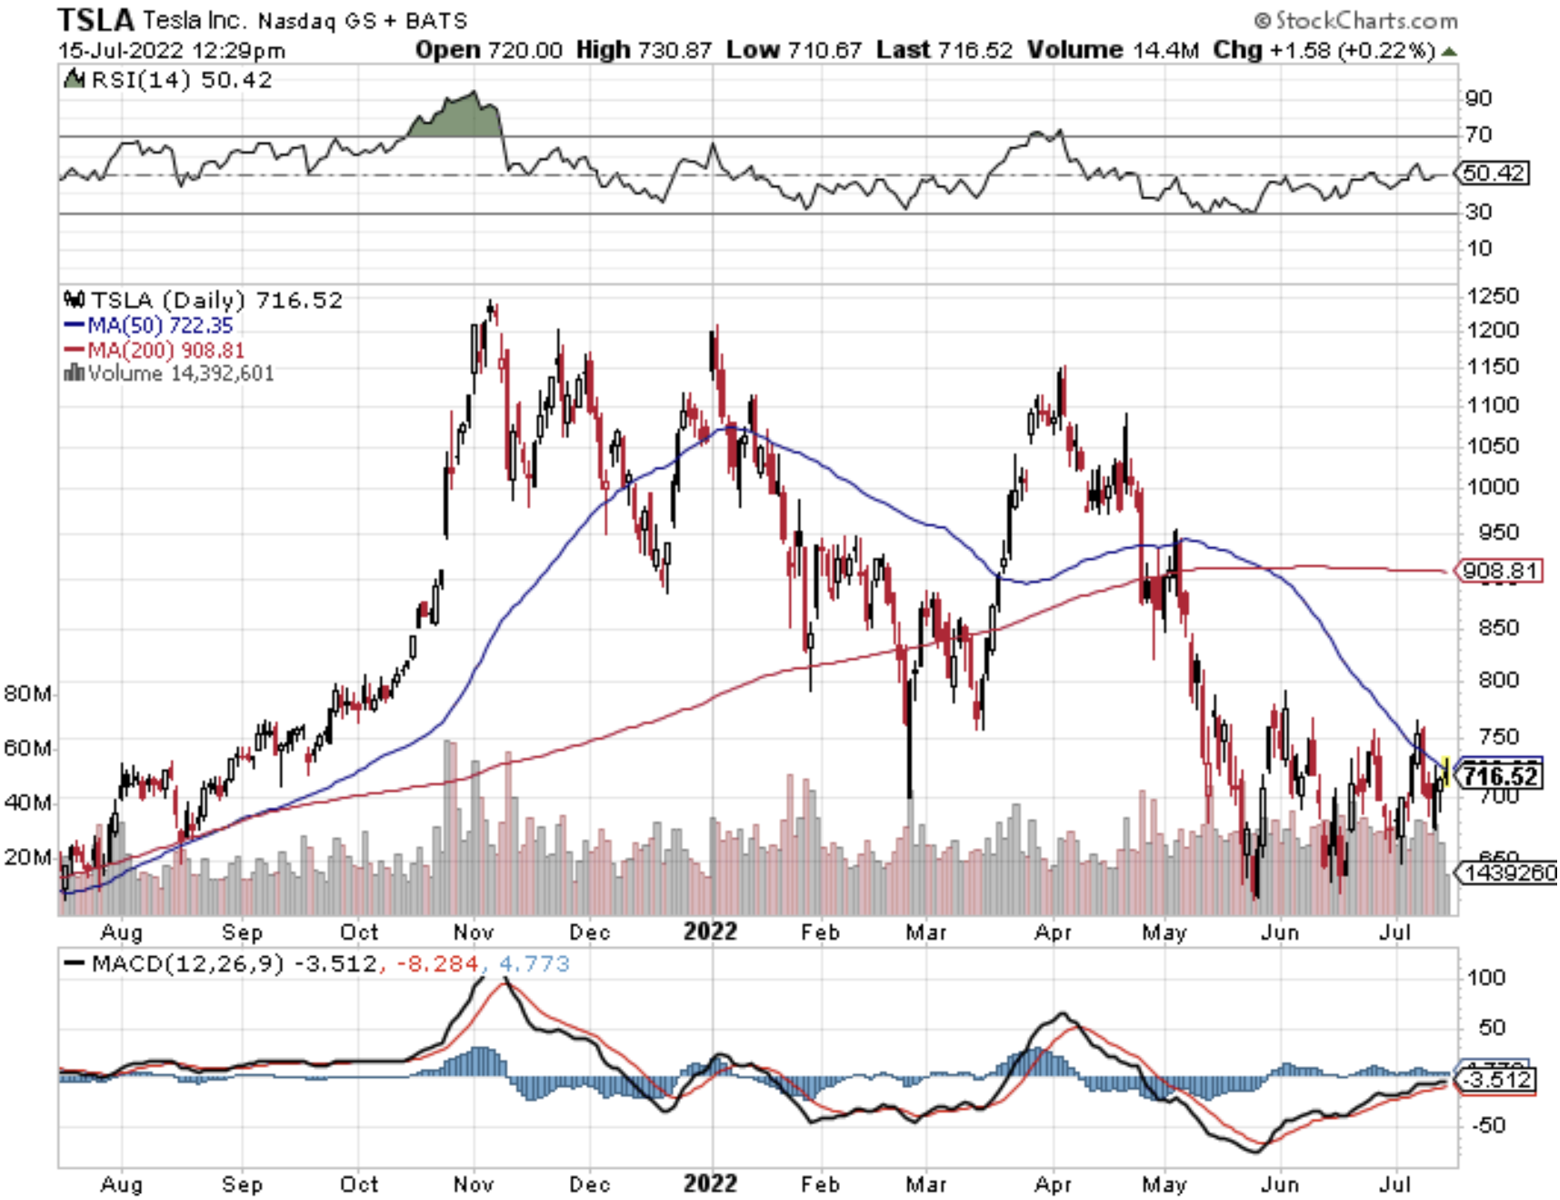
I executed no trades last week, content to run my long in Tesla and a short in Tesla, the “short strangle” strategy. I now have a very rare 80% cash position due to the lack of high-return, low-risk trades. I ran a rare loss last week because while my long in Tesla is now at max profit, my short is approaching its near strike. That goes with my philosophy of when you’re wrong, be small. When you’re right, go big.
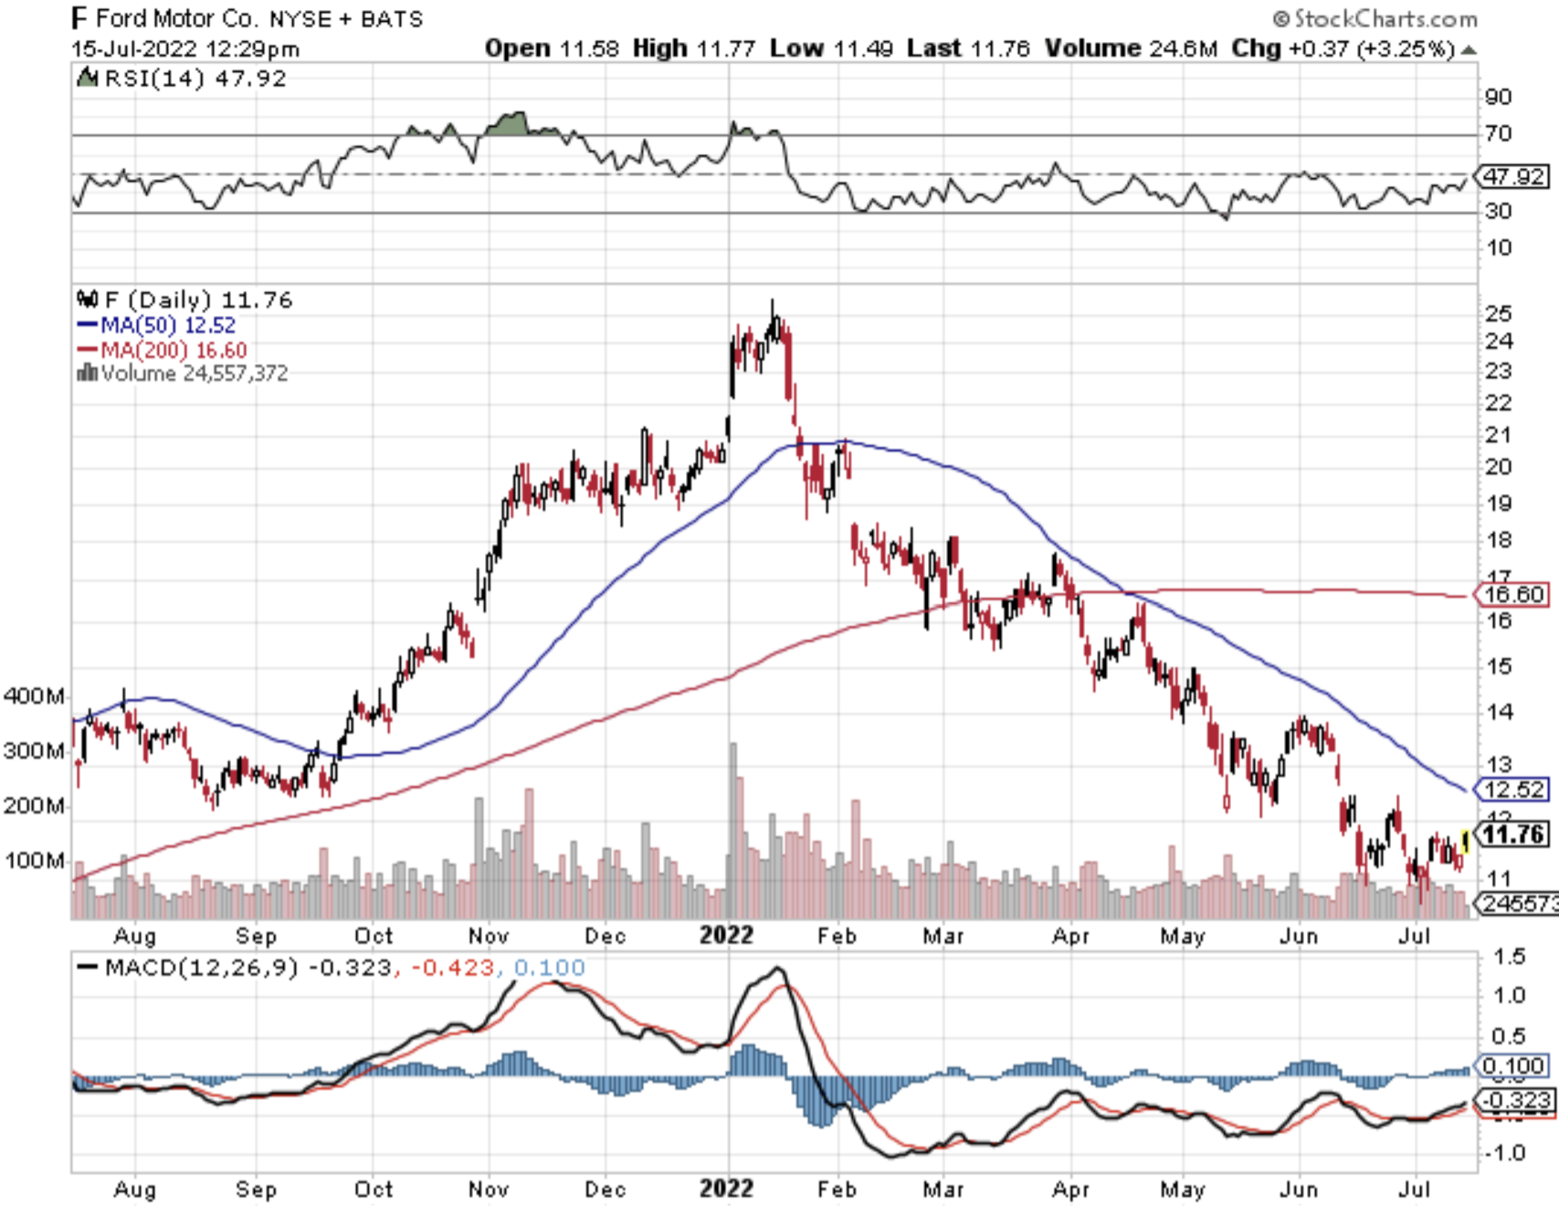
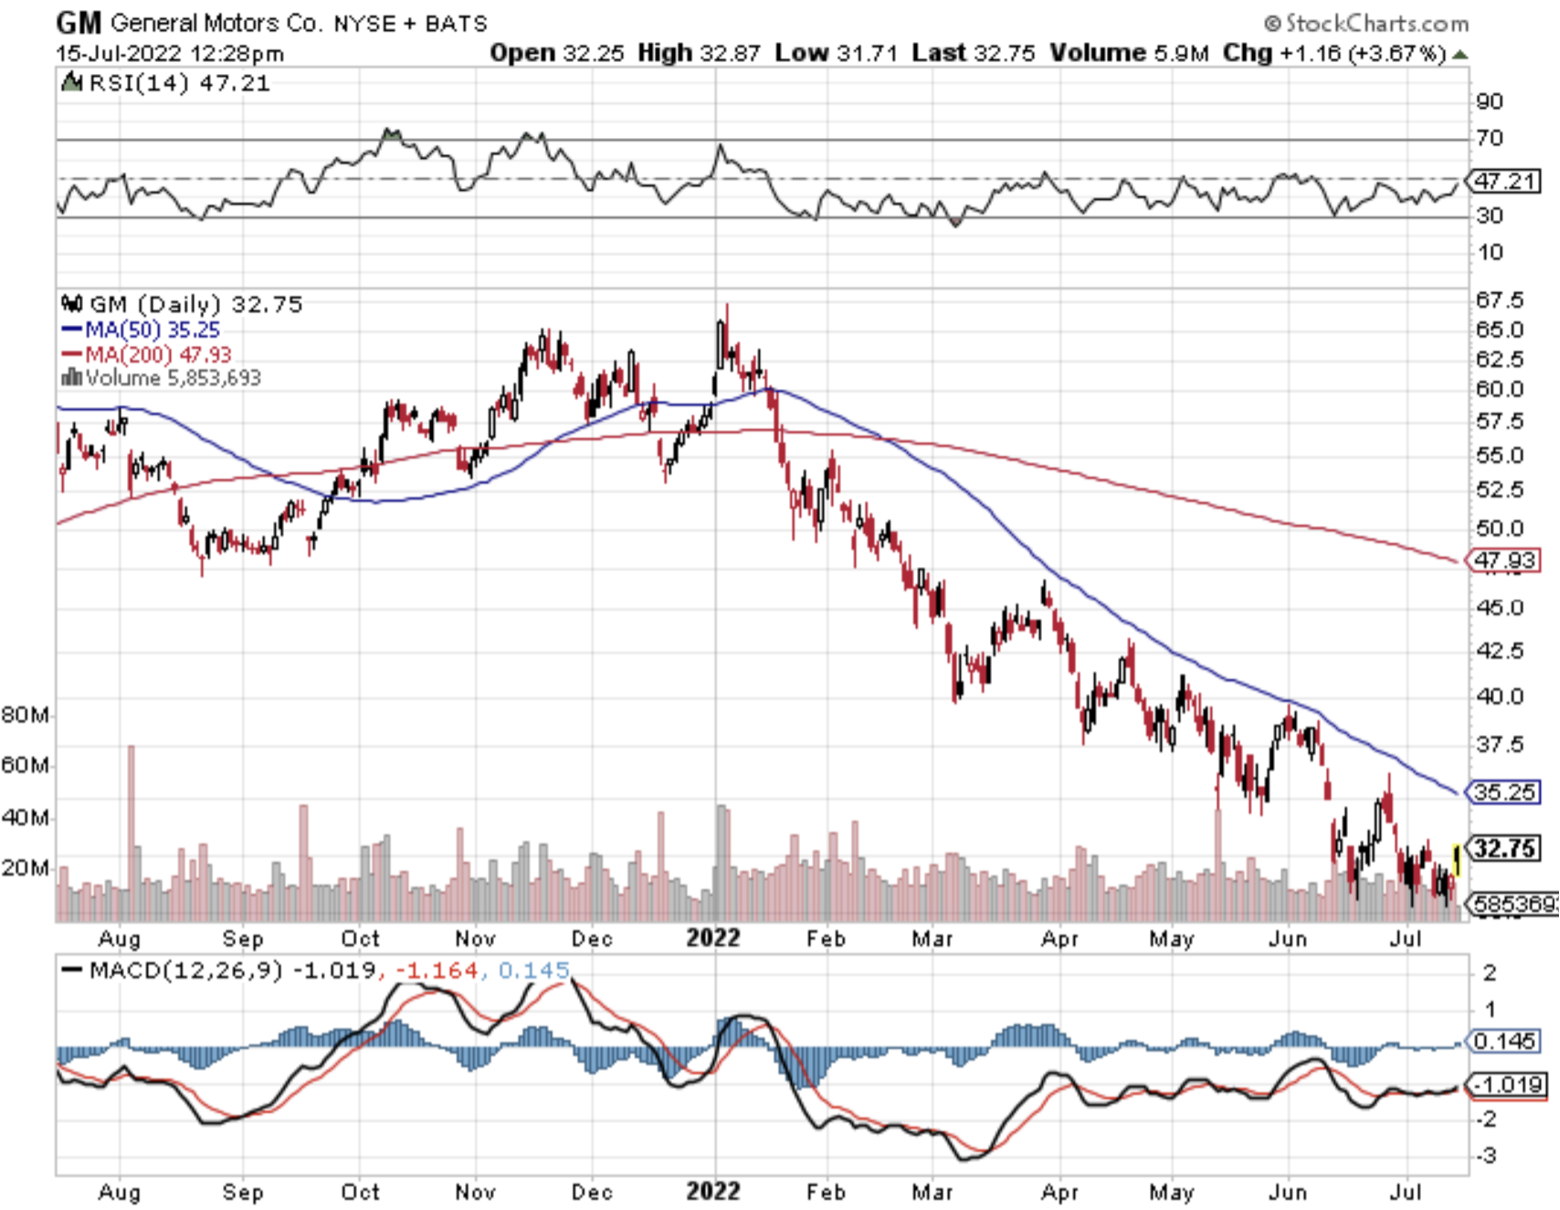
Ford (F) Cuts Deal with Tesla to Share National Charger Network, putting Elon Musk well on his way to becoming the largest electric utility in the world. It won’t affect the existing 4 million Tesla drivers yet. Ford only sold 62,000 EVs in 2022 and 25,000 the year before. Access will be provided through adapters, the (F) adopting the Tesla charging standard. It kind of screws (GM) left on its own. It was worth a $13 pop for (TSLA). Keep buying (TSLA) on dips.
Divergence Between the S&P 500 and the S&P Equal Weight is the greatest since December 1999. The Dotcom Bubble topped four months later. It’s a function of concentration in the top five tech stocks, my “Five Aces” strategy. Risk is rising. The flight to big tech balance sheets and AI has been huge. You heard it here first.
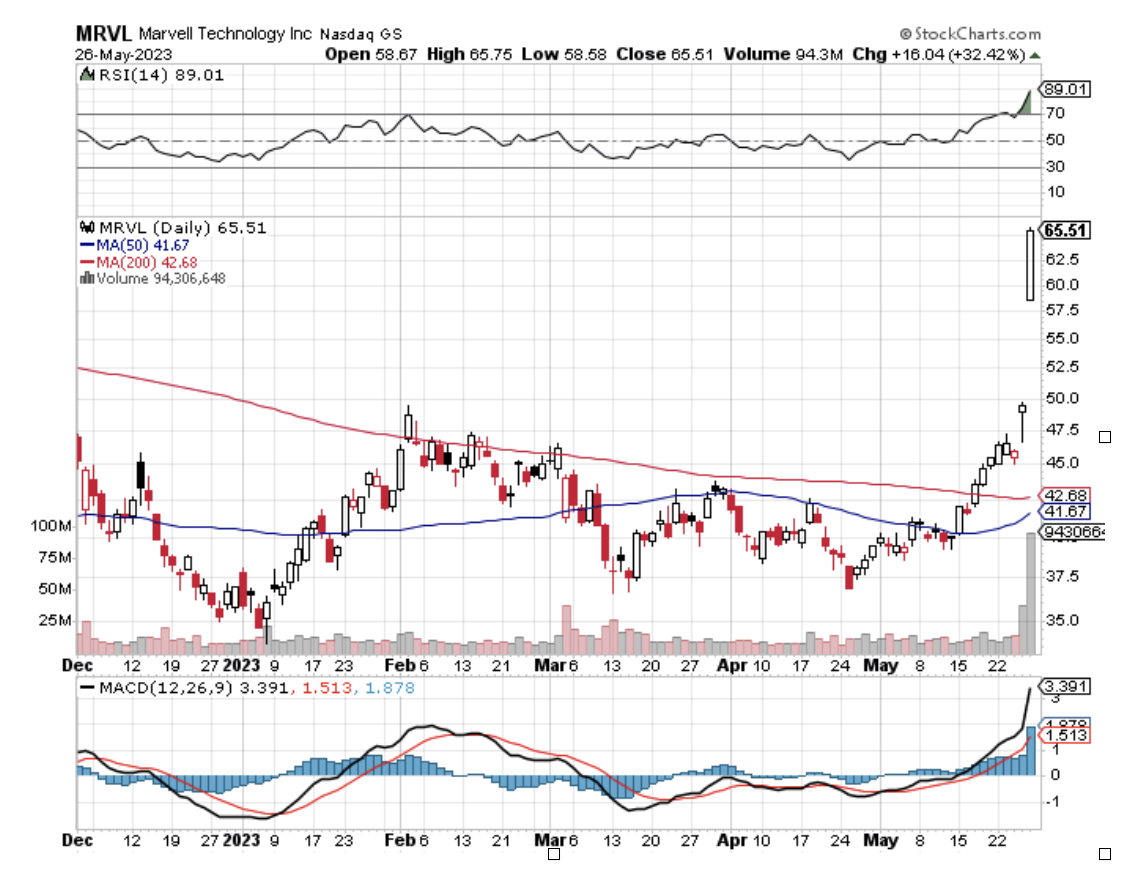
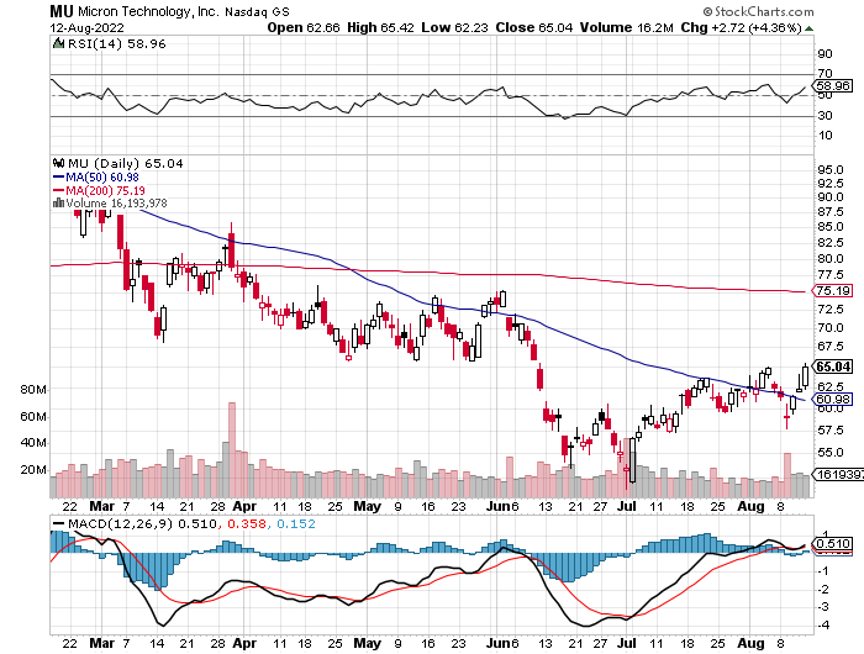
Marvel Technologies (MRVL) Rockets 25% on Spectacular Earnings Beat, as the AI fever spreads out into infrastructure plays like second-line chip makers. Demand for integrated circuits from data centers, carrier infrastructure, networking, and the auto industry is off the charts. The Internet has to grow 500% quickly to accommodate new AI demand right now. The gold rush is on. Buy (MRVL) on dips.
Inflation Continues to Fall, down 0.4% in April according to the Personal Consumption Expenditures Index Price Index. Food prices rose 6.9% from a year ago while energy fell 6.3%.
Fitch Puts US Debt on Credit Watch, meaning that it is due for a downgrade. It’s the first time since the 2011 Moody’s downgrade from AAA to AA+. Threats of default have real-world consequences.
Pending Home Sales Collapse, unchanged from March, but down 20% YOY on a signed contract basis. Soaring interest rates get the blame. The northeast took the big hit.
Ely Lily Price Target Raised to $500, by Bank of America on the strength of their Ozempic weight loss drug. The stock is up fivefold since Mad Hedge recommended it five years ago. Keep buying (LLY) on tips.
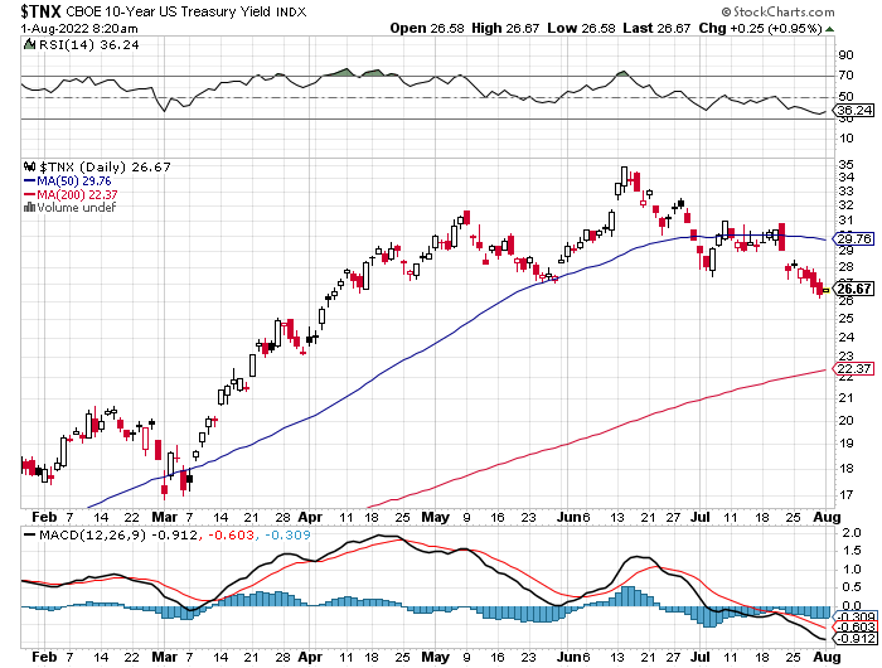
30-Year Fixed Rate Mortgages Jump Back to 7.0%, on the impasse in Washington and default fears. The residential real estate recovery goes back on hold.
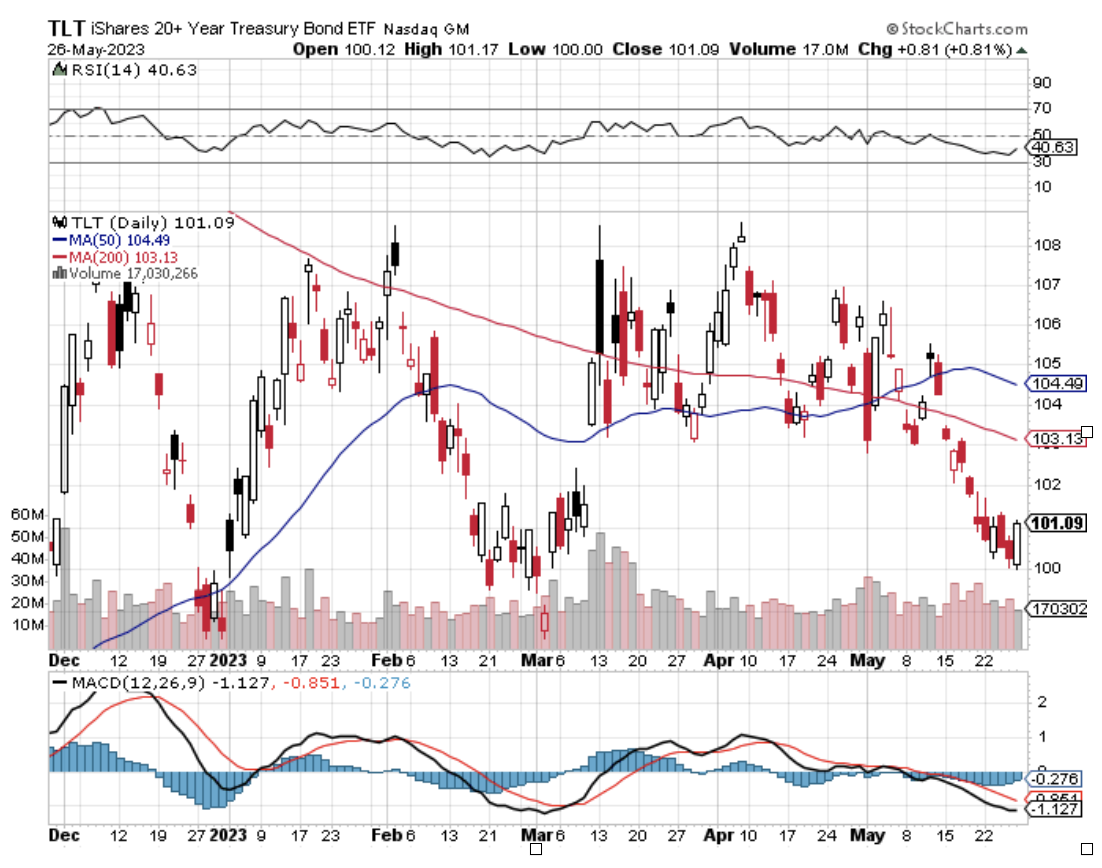
(TLT) Approaches 2023 Low. The closer we get to a debt ceiling deal, the lower we go. When a deal is done, it unleashes a new onslaught of bond selling by the Treasury, and lower lows on bonds. In the dream scenario, we fall all the way to $95 in the (TLT) where we will be issuing recommendations for call spreads and LEAPS by the boatload.
My Ten-Year View
When we come out the other side of the recession, we will be perfectly poised to launch into my new American Golden Age, or the next Roaring Twenties. The economy decarbonizing and technology hyper-accelerating, creating enormous investment opportunities. The Dow Average will rise by 800% to 240,000 or more in the coming decade. The new America will be far more efficient and profitable than the old.
Dow 240,000 here we come!
On Monday, May 29 is Memorial Day. All markets are closed.
On Tuesday, May 30 at 6:00 AM EST, the S&P Case Shiller National Home Price Index is printed.
On Wednesday, May 31 at 7:00 AM, the JOLTS Job Openings Report is out.
On Thursday, June 1 at 8:30 AM, the Weekly Jobless Claims are announced.
On Friday, June 2 at 2:00 PM, the May Nonfarm Payroll Report is released.
As for me, with the 36th anniversary of the 1987 crash coming up this year, when shares dove 20% in one day, I thought I’d part with a few memories.
I was in Paris visiting Morgan Stanley’s top banking clients, who then were making a major splash in Japanese equity warrants, my particular area of expertise.
When we walked into our last appointment, I casually asked how the market was doing (Paris is six hours ahead of New York). We were told the Dow Average was down a record 300 points. Stunned, I immediately asked for a private conference room so I could call the equity trading desk in New York to buy some stock.
A woman answered the phone, and when I said I wanted to buy, she burst into tears and threw the handset down on the floor. Redialing found all transatlantic lines jammed.
I never bought my stock, nor found out who picked up the phone. I grabbed a taxi to Charles de Gaulle airport and flew my twin Cessna as fast as the turbocharged engines take me back to London, breaking every known air traffic control rule.
By the time I got back, the Dow had closed down 512 points. Then I learned that George Soros asked us to bid on a $250 million blind portfolio of US stocks after the close. He said he had also solicited bids from Goldman Sachs, Merrill Lynch, JP Morgan, and Solomon Brothers, and would call us back if we won.
We bid 10% below the final closing prices for the lot. Ten minutes later he called us back and told us we won the auction. How much did the others bid? He told us that we were the only ones who bid at all!
Then you heard that great sucking sound.
Oops!
What has never been disclosed to the public is that after the close, Morgan Stanley received a margin call from the exchange for $100 million, as volatility had gone through the roof, as did every firm on Wall Street. We ordered JP Morgan to send the money from our account immediately. Then they lost the wire transfer!
After some harsh words at the top, it was found. That’s when I discovered the wonderful world of Fed wire numbers.
The next morning, the Dow continued its plunge, but after an hour managed a U-turn, and launched on a monster rally that lasted for the rest of the year. We made $75 million on that one trade from Soros.
It was the worst investment decision I have seen in the markets in 53 years, executed by its most brilliant player. Go figure. Maybe it was George’s risk control discipline kicking in?
At the end of the month, we then took a $75 million hit on our share of the British Petroleum privatization, because Prime Minister Margaret Thatcher refused to postpone the issue, believing that the banks had already made too much money.
That gave Morgan Stanley’s equity division a break-even P&L for the month of October 1987, the worst in market history. Even now, I refuse to gas up at a BP station on the very rare occasions I am driving a rental internal combustion engine from Enterprise.
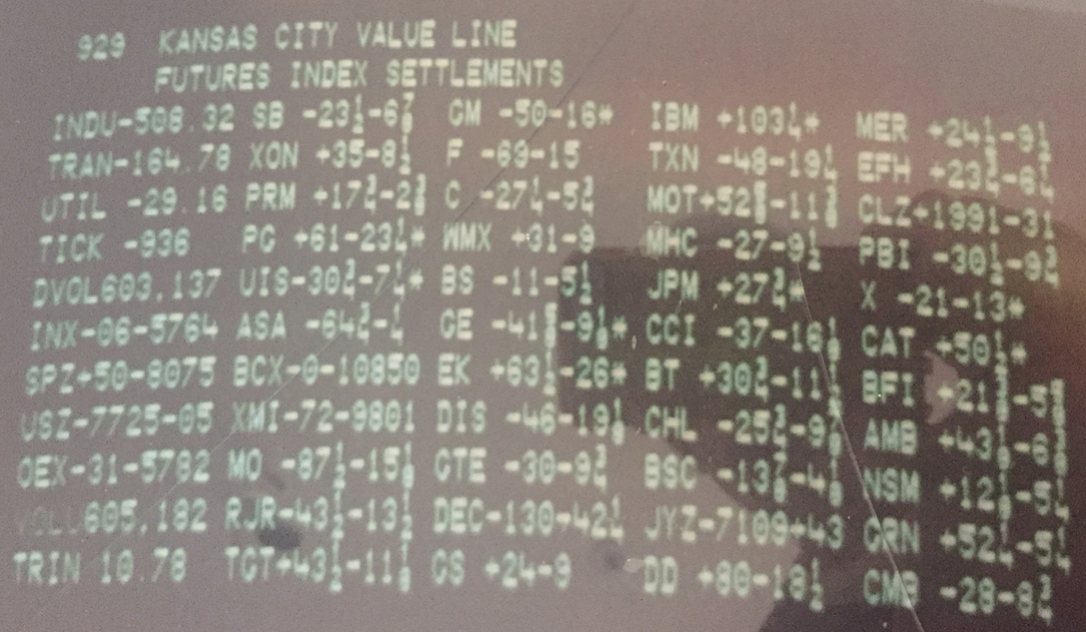
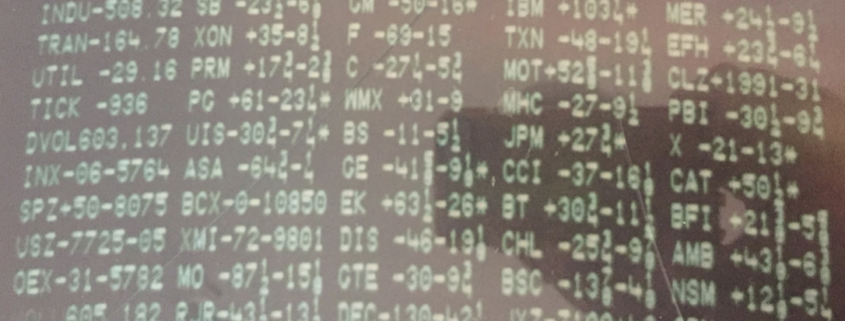
My Quotron Screen on 1987 Crash Day
Good luck and good trading!
John Thomas
CEO & Publisher
The Diary of a Mad Hedge Fund Trader