Global Market Comments
July 16, 2025
Fiat Lux
Featured Trade:
(WHY TECHNICAL ANALYSIS NEVER WORKS)
(FB), (AAPL), (AMZN), (GOOG), (MSFT), (VIX)

Global Market Comments
July 16, 2025
Fiat Lux
Featured Trade:
(WHY TECHNICAL ANALYSIS NEVER WORKS)
(FB), (AAPL), (AMZN), (GOOG), (MSFT), (VIX)
Global Market Comments
September 18, 2024
Fiat Lux
Featured Trade:
(TESTIMONIAL)
(HOW TO SPOT A MARKET TOP),
(SPY), (NFLX), (TSLA), (FB), (LEN), (TLT), (BAC)

Mad Hedge Technology Letter
December 18, 2023
Fiat Lux
Featured Trade:
(THE TRUTH ABOUT AUTOMATION AND WALL STREET JOBS)
(AAPL), (GOOGL), (FB), (AMZN), (NFLX)


Automation is taking place at warp speed displacing employees from all walks of life.
According to a recent report, the U.S. financial industry will depose 200,000 workers in the next decade because of automating efficiencies.
Yes, humans are going the way of the dodo bird and banking will effectively become algorithms working for a handful of executives and engineers.
The x-factor in this equation is the direct capital of $150 billion annually that banks spend on technological development in-house which is higher than any other industry.
Welcome to the world of lower costs, shedding wage bills, and boosting performance rates.
We forget to realize that employee compensation eats up 50% of bank expenses.
The 200,000 job trimmings would result in 10% of the U.S. bank jobs getting axed.
The hyped-up “golden age of banking” should deliver extraordinary savings and premium services to the customer at no extra cost.
Mobile and online banking has delivered functionality that no generation of customers has ever seen.
The most gutted part of banking jobs will naturally occur in the call centers because they are the low-hanging fruit for automated chatbots.
A few years ago, chatbots were suboptimal, even spewing out arbitrary profanity, but they have slowly crawled up in performance metrics to the point where some customers are unaware they are communicating with an artificially engineered algorithm.
The wholesale integration of automating the back-office staff isn’t the end of it, the front office will experience a 30% drop in numbers sullying the predated ideology that front-office staff are irreplaceable heavy hitters.
Front-office staff have already felt the brunt of downsizing with purges carried out in 2023 representing a fifth year of decline.
Front-office traders and brokers are being replaced by software engineers as banks follow the wider trend of every company transitioning into a tech company.
The infusion of artificial intelligence will lower mortgage processing costs by 20% and the accumulation of hordes of data will advance the marketing effort into a smart, hybrid cloud-based, and hyper-targeted strategy.
Historically, a strong labor market and low unemployment boosts wage growth, but national income allocated to workers has dipped from about 63% in 2000 to 56% in 2023.
Causes stem from the deceleration in union membership and outsourcing has snatched away negotiating power amongst workers and the implemented mass automation has poured fat on the fire.
I was recently in Budapest, Hungary on a business trip, and on a main thoroughfare, a J.P. Morgan and Blackrock office stood a stone’s throw away from each other employing an army of local English proficient Hungarians for 30% of the cost of American bankers.
Banks simply possess wider optionality to outsource to an emerging nation or to automate hard-to-fill positions now.
In this race to zero, companies can easily rebuff requests for higher salaries and if they threaten to walk off the job, a robot can just pick up the slack.
Automation is getting that good now!
The last two human bank hiring waves are a distant memory.
The most recent spike occurred 7 years after the dot com crash of 2001 until the sub-prime crisis of 2008 adding around half a million jobs on top of the 1.5 million that existed then.
The longest and most dramatic rise in human bankers was from 1935 to 1985, a 50-year boom that delivered over 1.2 million bankers to the U.S. workforce.
This type of human hiring will likely never be seen again in the U.S. financial industry.
Recomposing banks through automation is crucial to surviving as fintech companies are chomping at the bit and even tech companies like Amazon and Apple have started tinkering with new financial products.
The brutal truth out there is sadly; don’t tell your kid to get into banking, because they will most likely be feeding on scraps at that point.

WALL STREET IS LEANER THAN EVER
Global Market Comments
October 19, 2023
Fiat Lux
Featured Trade:
(WHO WAS THE GREATEST WEALTH CREATOR IN HISTORY?)
(FB), (AAPL), (GOOG), (AMZON),
(XOM), (BRKY), (T), (GM), (VZ), (CCA),
(WHY DOCTORS MAKE TERRIBLE TRADERS?)


Who’s been buttering your bread more than any other?
Which publicly listed company has created the most wealth in history?
I’ll give you some hints.
The founder never took a bath, was a devout vegetarian, and dropped out of college after the first semester. The only class he finished was for calligraphy. And he was a first-class asshole.
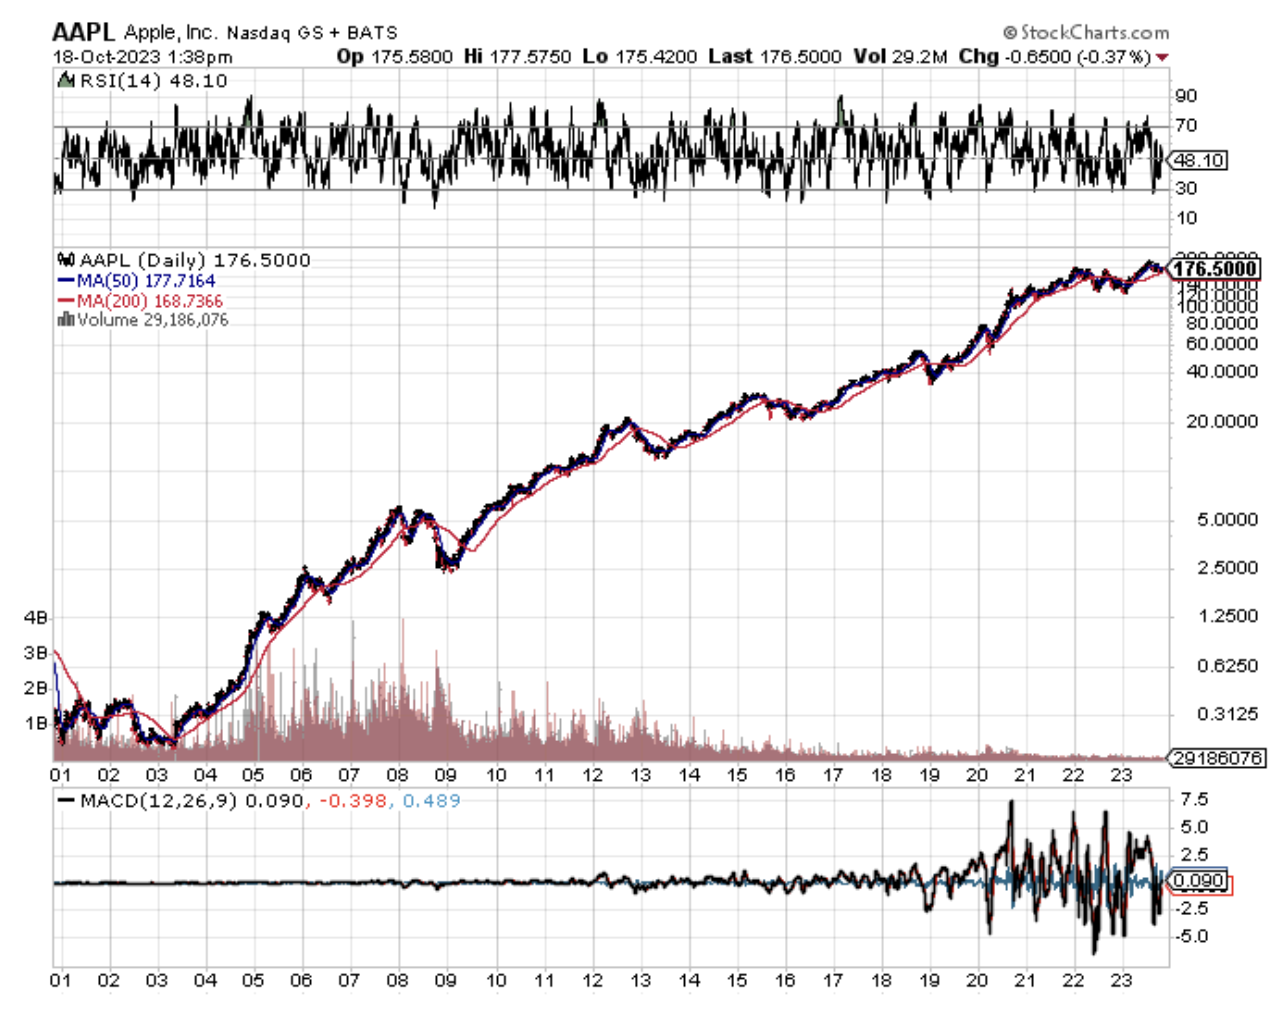
Silicon Valley residents will immediately recognize this character as Steve Jobs, the co-founder of Apple (AAPL).
In 43 years, his firm created over $3 trillion of wealth for his shareholders, making it the largest in the world.
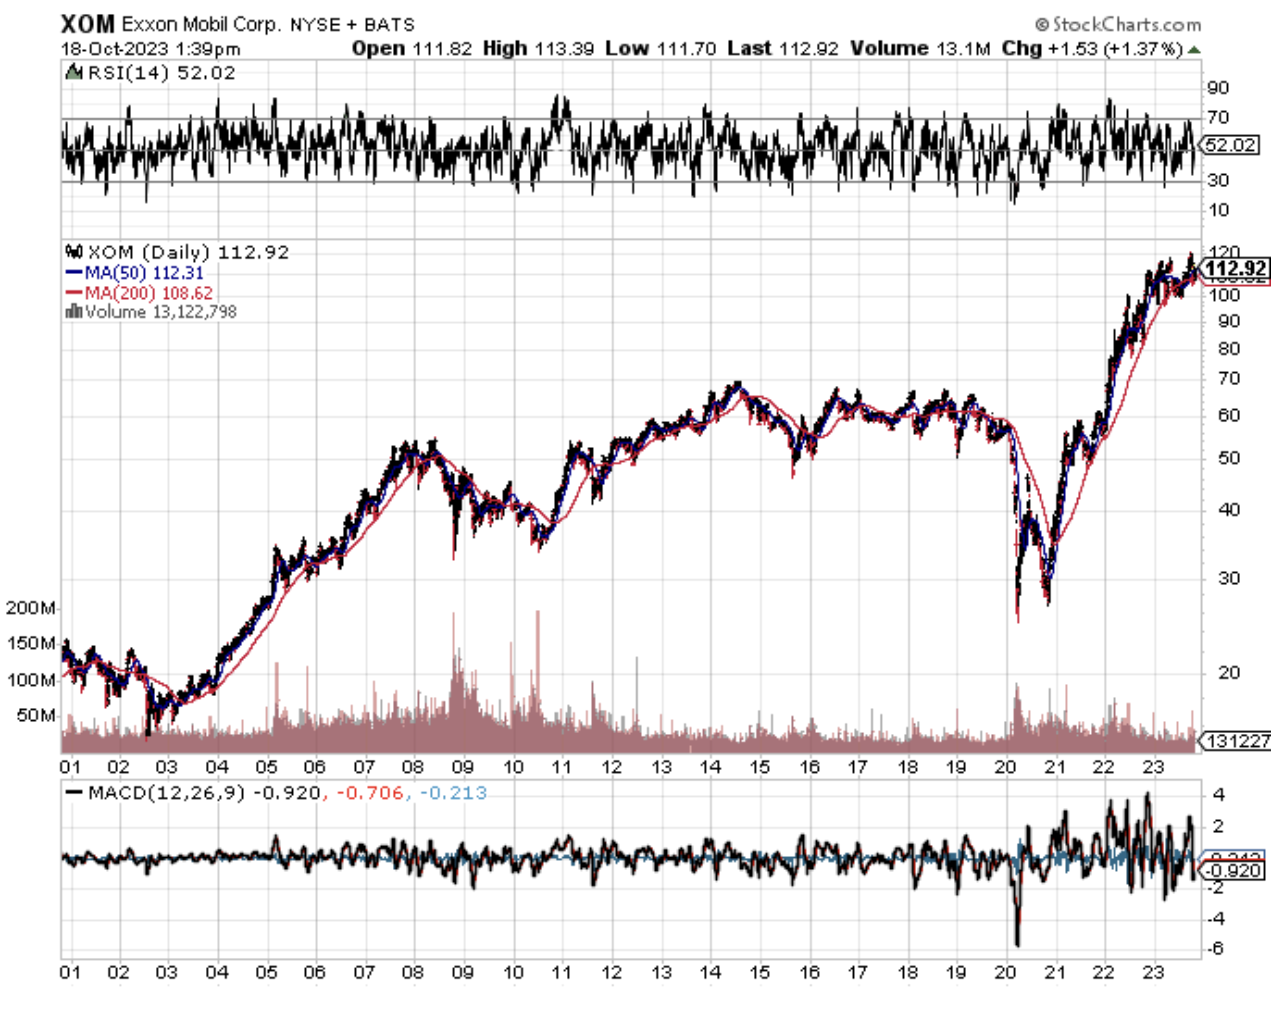
Until a decade ago, Exxon (XOM) held the top spot, creating $900 million in new wealth, although to be fair, it took 100 years to do it.
To be completely and historically accurate, most of the original seven sister oil companies are decedents of John D. Rockefeller’s Standard Oil Company.
Add the present value of these together, and Rockefeller is far and away the biggest money maker of all time. And he made most of this before income taxes were invented in 1913!
Reviewing the performance of other top-performing companies, it is truly amazing how much wealth was created from a technology boom that started in the 1980s.
Investors’ laser-like focus on the Magnificent Seven is well justified.
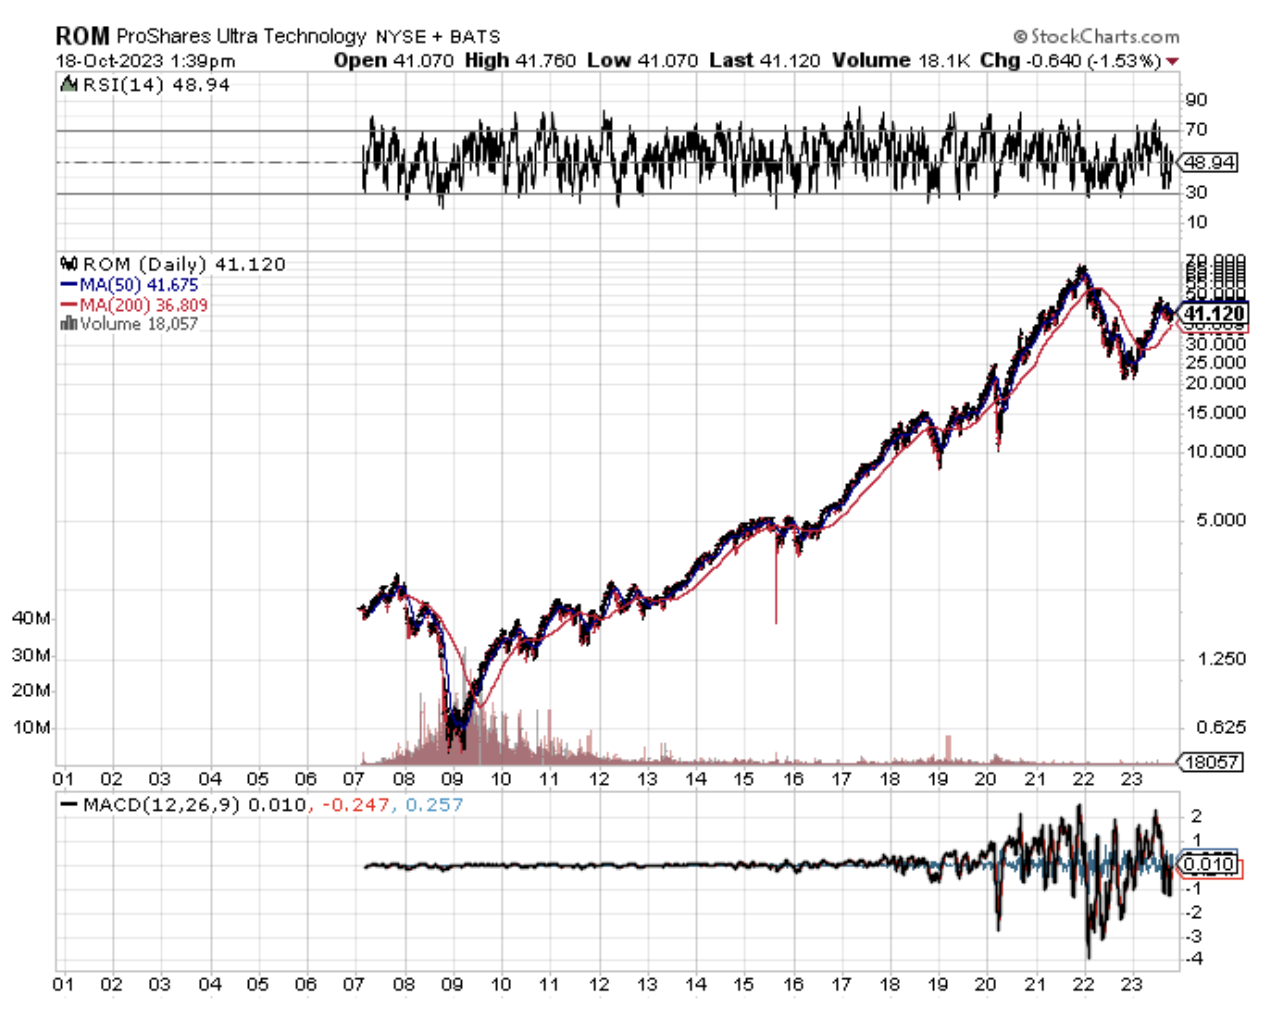
That’s why I often tell guests during my lectures around the world that if they really want to be lazy, just buy the ProShares Ultra Technology ETF (ROM) and forget everything else.
Another college dropout’s efforts, those of Bill Gates Microsoft (MSFT), produced an annualized return of 25% since 1986. That made him the third greatest wealth creator in history.
It also made him the world's richest man, until Jeff Bezos and Elon Musk came along. Gates is thought to have single-handedly created an additional 1,000 millionaires as so many employees were aided in stock options.
Facebook (FB) is the youngest on the list of top money makers, creating an annualized 34.5% return since it went public in 2012.
Alphabet (GOOG) is the second newest on the list, racking up a 24.9% annualized return since 2004.
Amazon (AMZN) is 14th on the list of all-time wealth creators and has just entered its 20th year as a public company.
Being an armchair business and financial historian, many runners-up were major companies in my day, but generate snores among Millennials now.
Believe it or not, General Motors (GM) still ranks as the 8th greatest wealth creator of all time, even though it went bankrupt in 2008.
Ma Bell or AT&T (T) ranks number 17th but was merged out of existence in 2005. A regrouping of Bell System spinoffs possesses the (T) ticker symbol today.
Among its distant relatives are Comcast (CCV) and Verizon Communications (VZ).
Warren Buffet’s Berkshire Hathaway (BRKY) ranks 12th as an income generator, with an annualized return of only 11.94%.
Its performance is diluted by the low returns afforded by the textile business before Buffet took it over in 1962. Buffet’s returns since then have been double that.
Analyzing the vast expanse of data over the last 100 years proves that single stock picking is a mug's game.
Since 1926, only 4% of publically traded stocks made ALL of the wealth generated by the stock market.
The other 96% either made no money to speak of, or went out of business.
This is why the Mad Hedge Fund Trader focuses on only 10%-20% of the market at any given time, the money-making part.
In other words, you have a one in 25 chance of picking a winner.
A modest 30 companies accounted for 30% of this wealth, while 50 stocks accounted for 40%.
You can only conclude that stocks make terrible investments, not even coming close to beating the minimal returns of one-month Treasury bills, a cash equivalent.
It also is a strong argument in favor of indexed investment in that through investing in all major companies, you are guaranteed to grab the outsized winners.
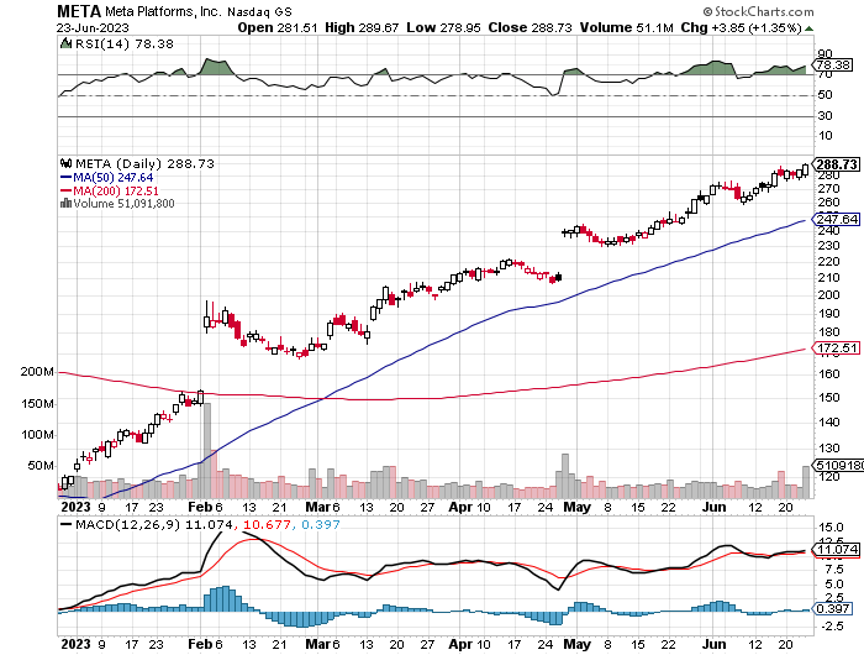
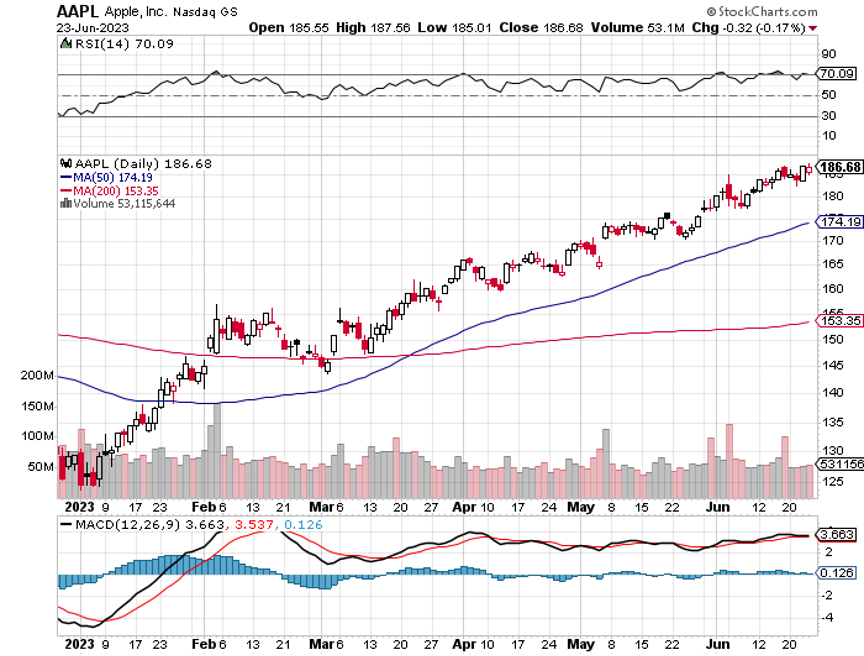
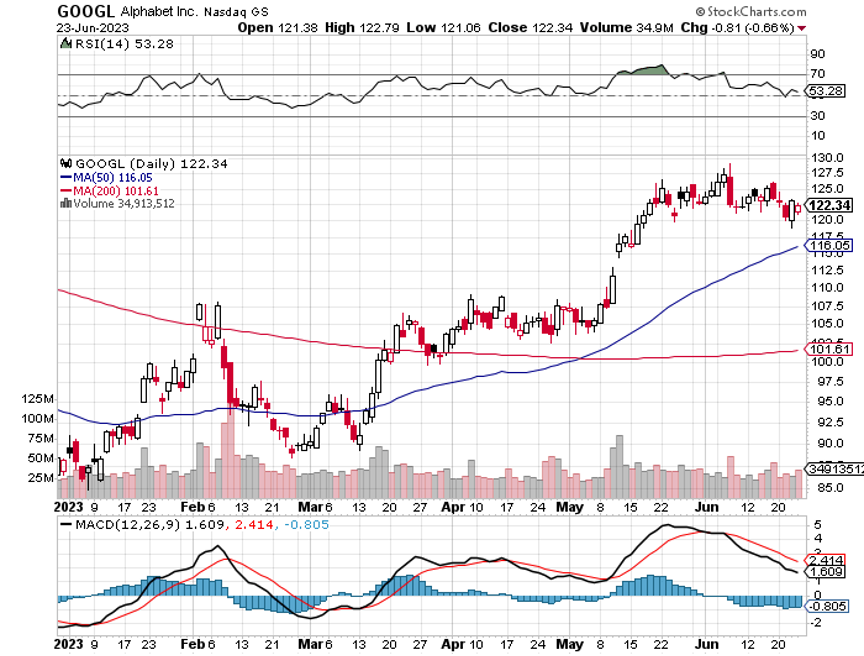
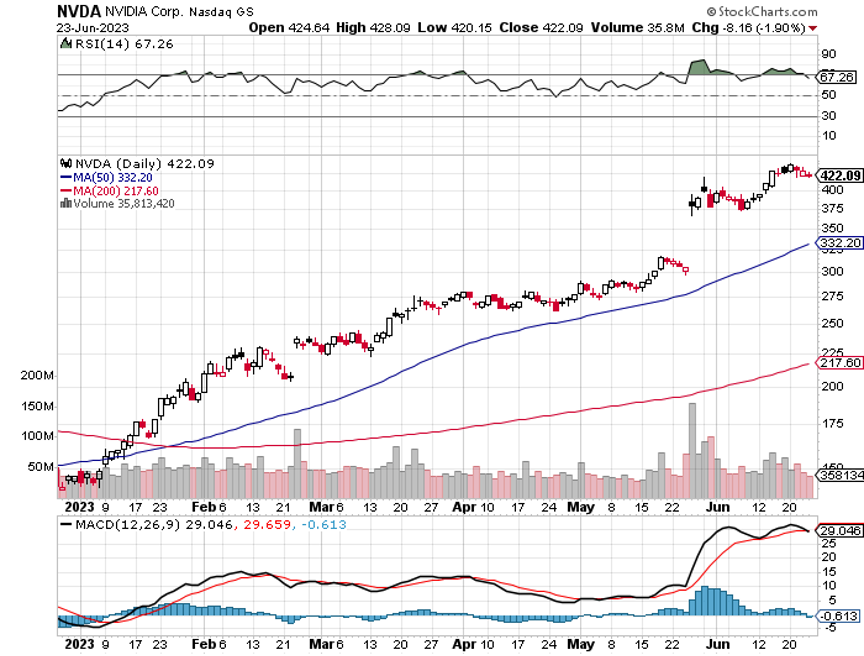
That is unless you follow the Diary of a Mad Hedge Fund Trader, which picked Amazon, Apple, Facebook, Google, NVIDIA, and Tesla right out of the gate.
If you want to learn more about the number crunching behind this piece, please visit the research of Hendrik Bessembinder at the W.P. Carey School of Business at Arizona State University.
Such a Money Maker!
Global Market Comments
September 20, 2023
Fiat Lux
Featured Trade:
(FRIDAY, OCTOBER 31 MIAMI, FLORIDA GLOBAL STRATEGY LUNCHEON)
(WHY I HAVE BECOME SO BORING),
(SPY), (QQQ), (IWM), (AAPL), (TSLA),
(TACKLING THE INFLATION MYTH),
(AAPL), (GOOG), (FB)


I have long told my listeners at conferences, webinars, and strategy luncheons my definition of the “new inflation”: the price for whatever you have to buy is rising, as with your home, health care, and a college education.
The price of the things you need to sell, such as your labor and services, is falling.
So while official government numbers show that the overall rate of inflation is muted at multigenerational highs, the reality is that the standard of living of most Americans is being squeezed at an alarming rate by both startling price increases and real wage cuts.
I finally found someone who agrees with me.
David Stockman was president Ronald Reagan’s director of the Office of Management and Budget from 1981-1985. I regularly jousted with David at White House press conferences, pointing out that the budgets he was proposing would not produce a balanced budget, as he claimed.
Instead, I argued that they would lead to an enormous expansion of the federal deficit. In the end, I was right, with the national debt growing 400% during the Reagan years.
To his credit, David later admitted to running two sets of books for the national accounts, one for external consumption for people like me, and a second internal one for the president with much more dire consequences.
When David finally made the second set of books public, there was hell to pay. It was a fiery departure. I knew Ronald Reagan really well, and when the cameras weren’t rolling, he could get really angry.
After a falling out with Reagan over exactly the issues I brought up, Stockman disappeared for three decades.
He is now back with a vengeance.
He is running a blog named David Stockman’s Contra Corner (click here for the link at http://davidstockmanscontracorner.com ), a site he says “where mainstream delusions and cant about the Welfare State, the Bailout State, Bubble Finance, and Beltway Banditry are ripped, refuted and rebuked.” (Good writing was never his thing).
Despite this rant, there is no place I won’t go to discover some valid arguments and useful statistics, and Stockman is no exception.
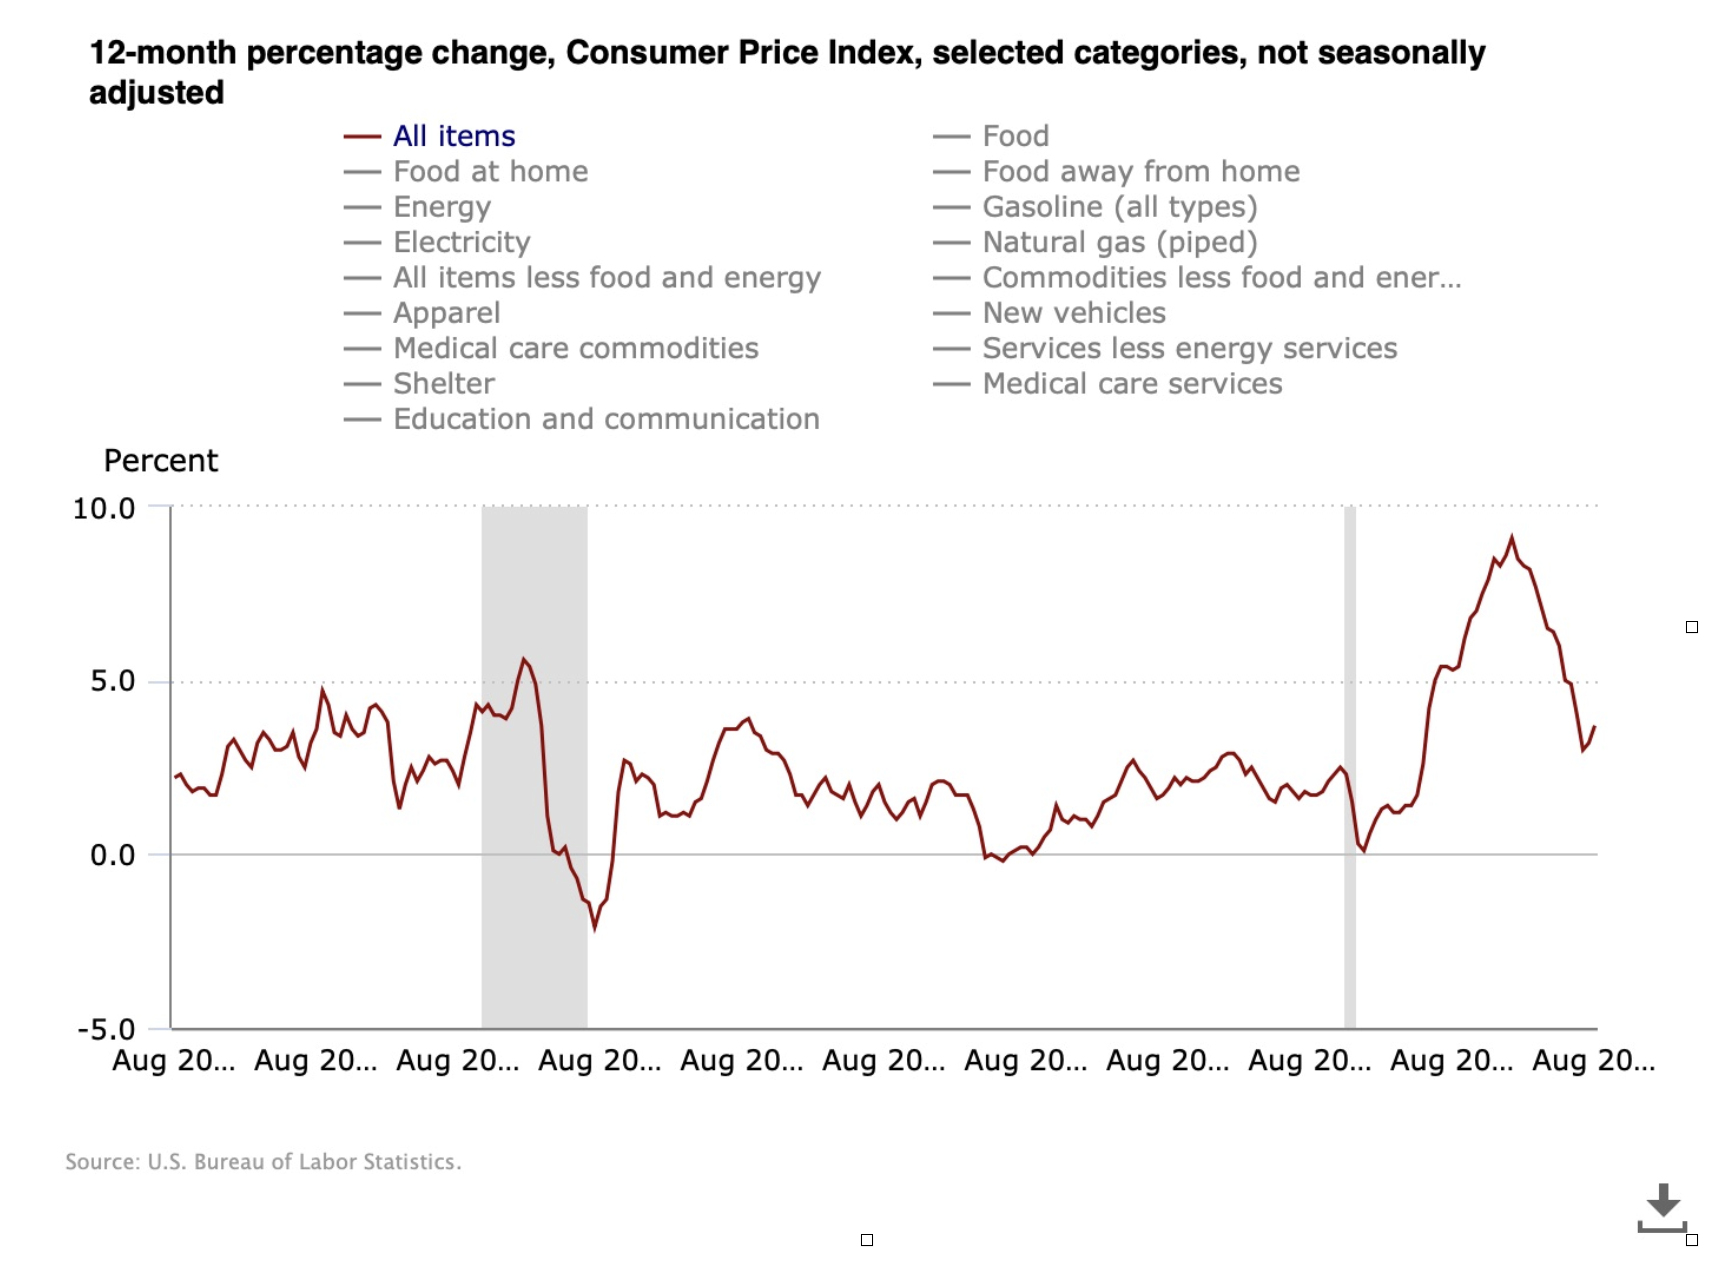
For a start, home utility prices have been skyrocketing for the past decade, nearly doubling. Over the last 12 months alone, it has jumped by 5.3%, while natural gas is up more than 10%, compared to an annual Consumer Price Index rise of only 3.3%.
But utilities have such a low 5% weighting in the Fed’s inflation calculation it barely moves the needle.
Wait, it gets better.
Gasoline costs have also been on a relentless uptrend since the nineties. Crude oil is up from a $10 low to today’s print of $95. Retail gasoline has popped from $1 a gallon to $5.50 in California, and that’s off from the year’s high at $3.50.
That works out to an annualized increase of 57%, or more than triple the official inflation rate.
The nation’s 40 million renting households have been similarly punished with price increases. They have averaged a 5.0% annual rate, nearly double the inflation rate.
The country’s 75 million homeowners are getting hit in the pocketbook as well. They have seen the cost of water, sewer, and trash collection balloon at a 4.8% annualized rate. And this has been an almost entirely straight-line move, with no pullbacks. And home insurance? It is absolutely through the roof.
David recites a dirty laundry list of Fed omissions and understatements on the inflation front, including gold, silver, and commodities prices.
All of these nickels and dimes add up to quite a lot for a family of four who is trying to scrape by on a median household income of $69,000 a year. And Heaven help you if you try to live on that in California.
The cost of a few items has declined, but not by much. They are largely composed of cheap import substitutes from Asia, including apparel, shoes, household furniture, consumer electronics, toys, and appliances.
One area the Fed data doesn’t remotely come close to measuring is the plunging cost of technology. How do you measure the savings from products that didn’t exist 20 years ago, like smart phones, iPods, iPads, and solid-state hard drives? How do you measure the cost of services that are handed out for free as Google, Facebook, and X do?
I can personally tell the cost of my own business is probably 90% cheaper to run than it would have three decades ago. I remember shelling out $5,000 for a COMPAQ PC that costs $300 today but has 1,000 times the performance.
David finishes with his usual tirade against the Fed, accusing them of obsessing over the noise of the daily data releases and missing the long-term trend.
Anyone like myself who watched in horror how long it took our central bank to recognize the seriousness of the 2008 financial crisis pr the pandemic would agree.
This all reminds me of what a college Economics professor once told me during the late 1960’s. “Statistics are like a bikini bathing suit. What they reveal is fascinating, but what they conceal is essential.”


Global Market Comments
July 21, 2023
Fiat Lux
Featured Trades:
(WHAT THE NEXT RECESSION WILL LOOK LIKE),
(FB), (AAPL), (NFLX), (GOOGL), (KSS), (VIX), (MS), (GS),
(TESTIMONIAL)

CLICK HERE to download today's position sheet.

The probability of a recession taking place over the next 12 months is now low ranging as high as 20%. If it reaccelerates, not an impossibility, you can take that up to 100%.
And here’s the scary part. Bear markets front-run recessions by 6-12 months, i.e. now.
We’ll get a better read on the inflation numbers over the coming months. If inflation turns hot again, the Fed will be forced to raise rates to once unimagined levels.
So, it’s time to start asking the question of what the next recession will look like. Are we in for another 2008-2009 meltdown, when friends and relatives lost homes, jobs, and their entire net worth? Or can we look forward to a mild pullback that only economists and data junkies like myself will notice?
I’ll paraphrase one of my favorite Russian authors, Fyodor Dostoevsky, who in Anna Karenina might have said, “All economic expansions are all alike, while recessions are all miserable in their own way.”
Let’s look at some major pillars of the economy. A hallmark of the 2008 recession was the near collapse of the financial system, where the ATMs were probably within a week of shutting down nationally. The government had to step in with the TARP, and mandatory 5% equity ownership in the country’s 20 largest banks.
Back then, banks were leveraged 40:1 in the case of Morgan Stanley (MS) and Goldman Sachs (GS), while Lehman Brothers and Bear Stearns were leveraged 100:1. In that case the most heavily borrowed companies only needed markets to move 1% against them to wipe out their entire capital. That is exactly what happened. (MS) and (GS) came within a hair’s breadth of going the same way.
Thanks to the Dodd Frank financial regulation bill, banks cannot leverage themselves more than 10:1. They have spent a decade rebuilding balance sheets and reserves. They are now among the healthiest in the world, having become low-margin, very low-risk utilities. It is now European and Chinese banks that are going down the tubes.
How about real estate, another major cause of angst in the last recession? The market couldn’t be any more different today. There is a structural shortage of housing, especially at entry level affordable prices. While liar loans and house flipping are starting to make a comeback, they are nowhere near as prevalent as a decade ago. And the mis-rating of mortgage-backed securities from single “C” to triple “A” is now a distant memory. (I still can’t believe no one ever went to jail for that!).
And interest rates? We went into the last recession with a 6% overnight rate and a 7% 30-year fixed rate mortgage. Here we are once again.
The auto industry has been in a mild recession for the past two years, with annual production stalling at 15 million units, versus a 2009 low of 9 million units. In any, case the challenges to the industry are now more structural than cyclical, with new buyers decamping en masse to electric vehicles made on the west coast.
Of far greater concern are industries that are already in recession now. Energy has been flagging since oil prices peaked 18 months ago, despite massive tax subsidies. It is suffering from a structural oversupply and falling demand.
Retailers have been in a Great Depression for five years, squeezed on one side by Amazon and the other by China. A decade into store closings and the US is STILL over-stored. However, many of these shares are already so close to zero that the marginal impact on the major indexes will be small.
Financials and legacy banks are also facing a double squeeze from Fintech innovation and collapsing interest rates. All of those expensive national networks with branches on every street corner will be gone later in the 2020s.
And no matter how bad the coming recession gets technology, now 30% of the S&P 500, will keep powering on. Combined revenues of the “Magnificent Seven” in Q1 are at records. That leaves a mighty big cushion for any slowdown. That’s a lot more than the “eyeballs” and market shares they possessed a decade ago.
So, netting all this out, how bad will the next recession be? Not bad at all. I’m looking at a couple of quarters' small negative numbers, like two back-to-back -0.1%’s. Then we’ll see a recovery and probably another decade of decent US growth.
The stock market, however, is another kettle of fish. While the economy may slow from a 2.2% annual rate to -0.1% or -0.2%, the major indexes could fall much more than that, say 30% to 40%.
Earnings multiples are still at a 19X high compared to a 9X low in 2009. Shares would have to drop 53% just to match the last low. Equity weightings in portfolios are low. Money is pouring out of stock funds into bond ones.
Corporations buying back their own shares have been the principal prop from the market for the past three years. Some large companies, like Kohls (KSS), have retired as much as 50% of their outstanding equity in ten years.