Global Market Comments
August 19, 2019
Fiat Lux
Featured Trade:
(MARKET OUTLOOK FOR THE WEEK AHEAD, or WHAT A ROLLER COASTER RIDE!),
(SPY), (TLT), (VIX), (VXX), (M),
(WMT), (FB), (AMZN), (GOOGL), (IWM)
Global Market Comments
August 19, 2019
Fiat Lux
Featured Trade:
(MARKET OUTLOOK FOR THE WEEK AHEAD, or WHAT A ROLLER COASTER RIDE!),
(SPY), (TLT), (VIX), (VXX), (M),
(WMT), (FB), (AMZN), (GOOGL), (IWM)

I like roller coasters. The Giant Dipper at the Santa Cruz Boardwalk is tough to beat, the last operating wooden coaster in the United States. And I’ll always have fond memories of the Cyclone at Coney Island in New York.
I especially liked this week in the financial markets, which provided more profitable trading opportunities, both on the long and the short side, that any other week of the past decade.
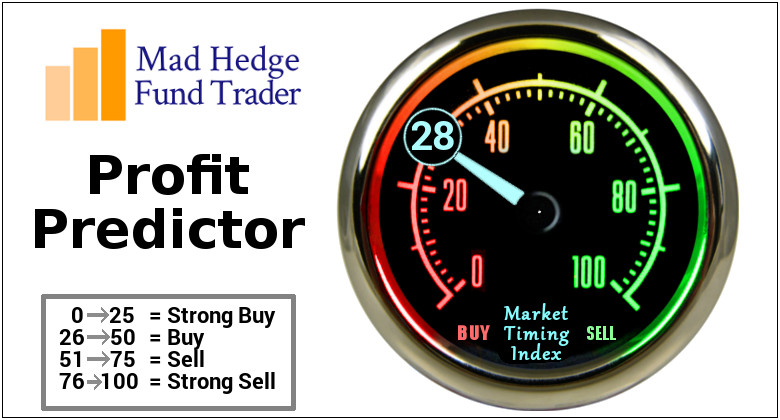
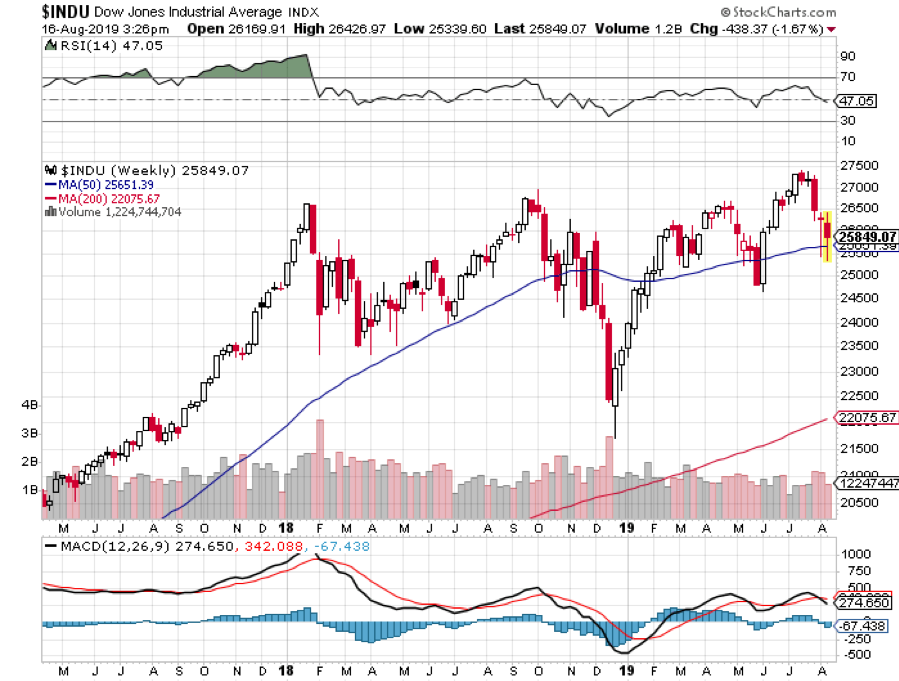
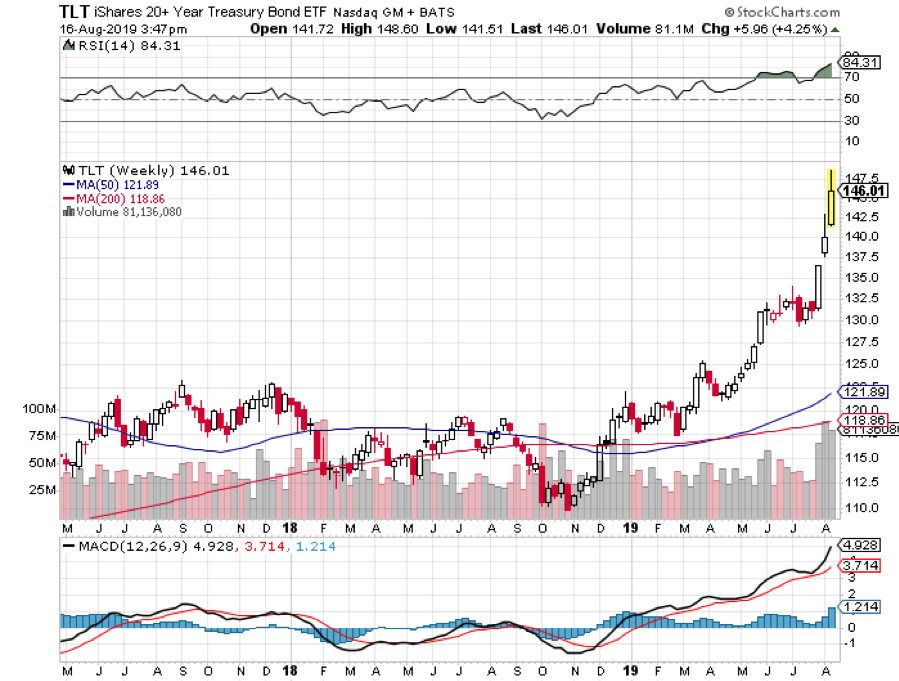
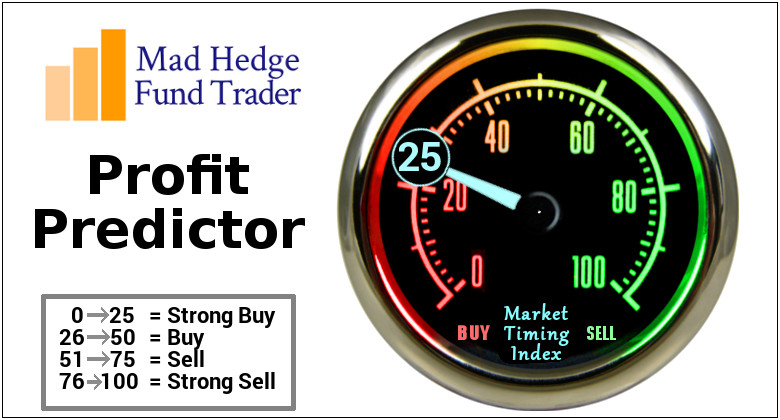
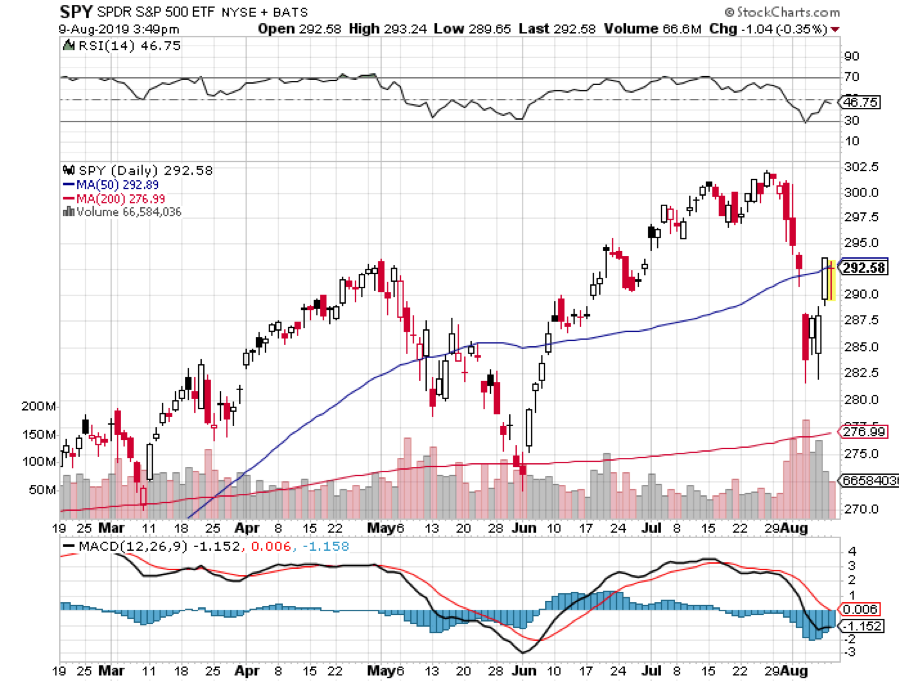
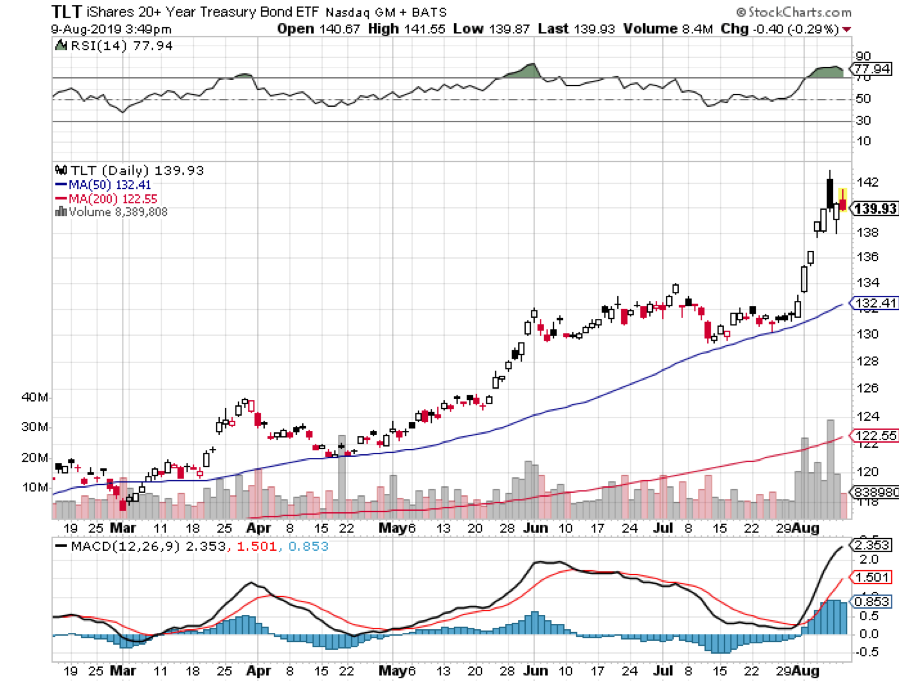
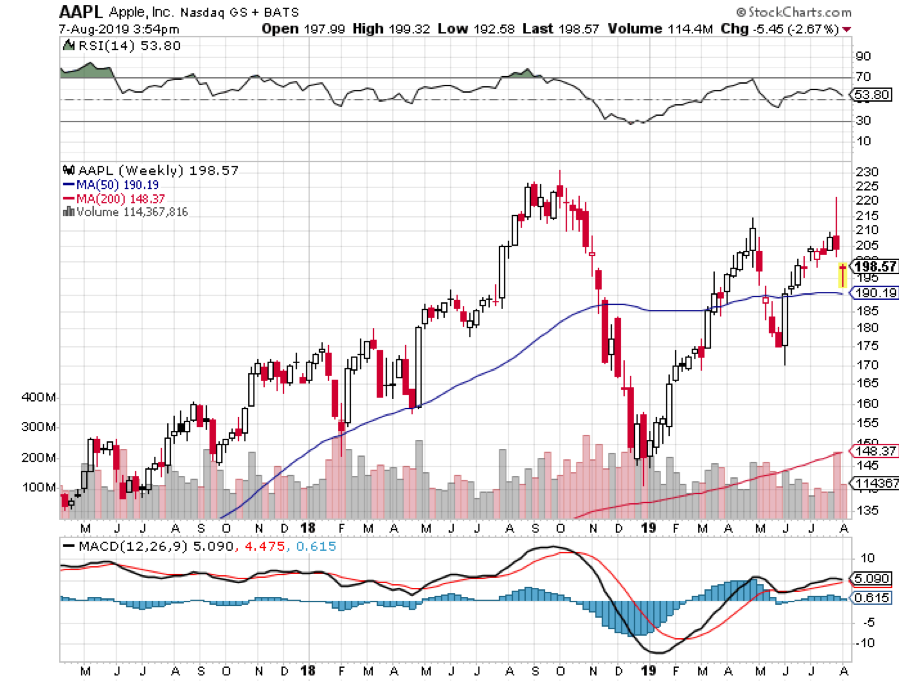
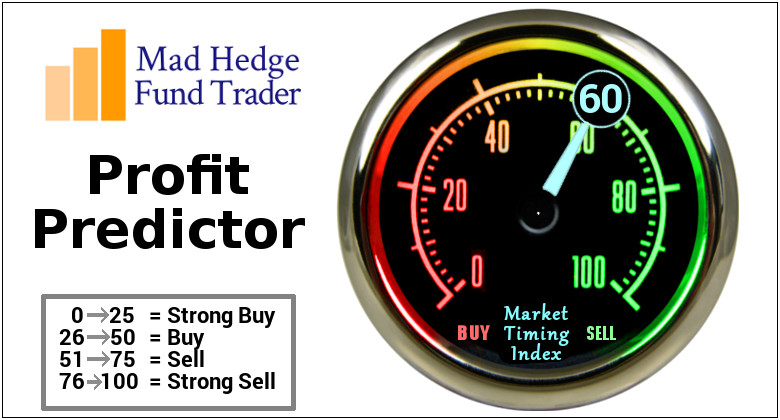
Perhaps the highpoint was on Thursday when I was staring at my screens watching ten year US Treasury bond yields (TLT) bottom at a near historic 1.46%, and my own Mad Hedge Market Timing Index plunging to a lowly 19.
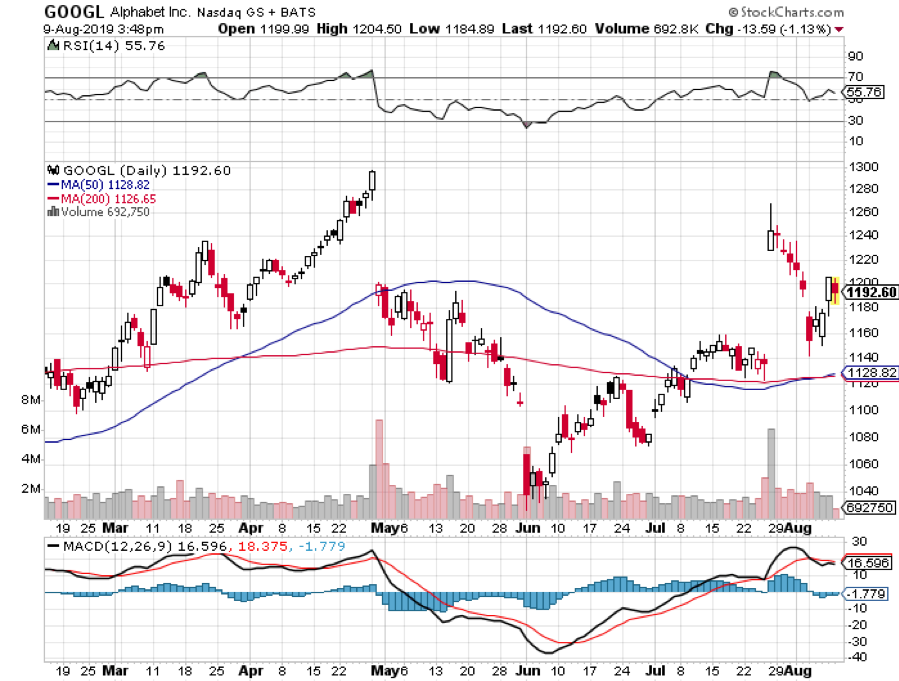
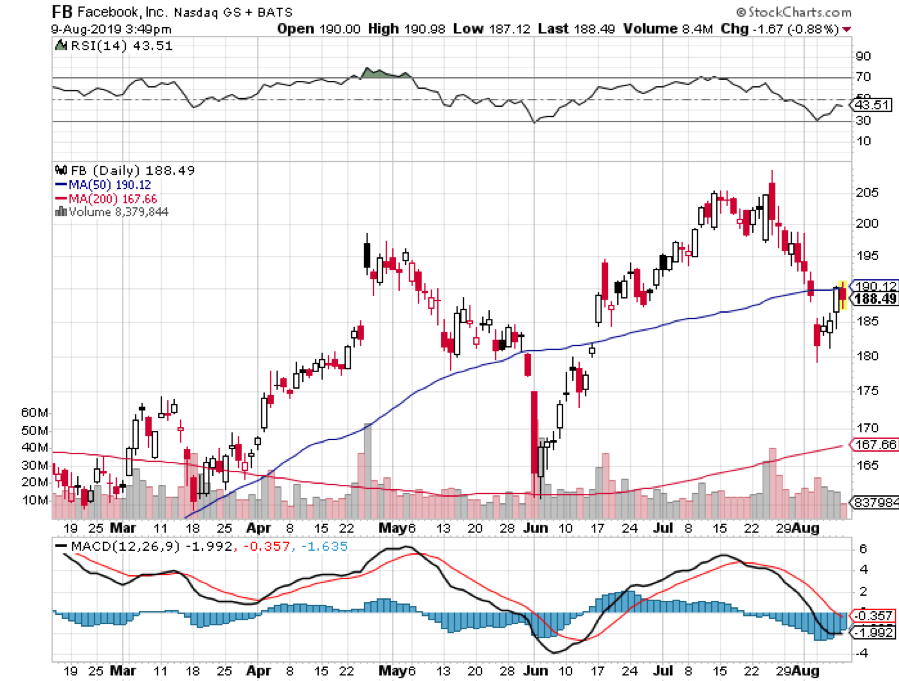
Impulsively, I covered the last of my short positions and started piling on longs in the FANGs. The next morning, the Dow Average opened up 300 points. But then, it’s easy to be bold and decisive when you’re up 30% on the year, compared to only 11% for the Dow Average.
And guess what? The best may be yet to come!
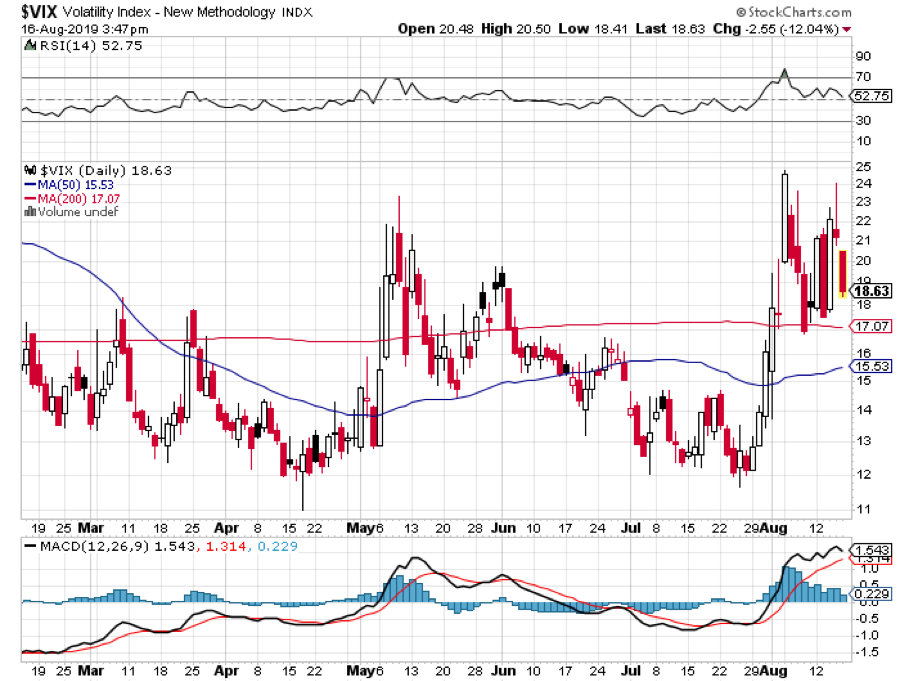
As long as the Volatility Index stays over $20, you will be able to print all the money you want with options spreads. I’m talking 10%-15% A MONTH!
All eyes are now on September 1 when the Chinese announce their own retaliation to our tariff increase. Will they target ag again? Or does the bond market (TLT) take the hit this time (the Chinese government owns $900 billion worth of our debt).
And now for the question that everyone is asking: How far will the stock market fall in this cycle. We have already plunged 10% from the highs on an intraday basis. Could we drop another 10% in this period of high anxiety? Certainly. However, I tend to think it will be less than that.
The initial market pop on Monday came when the new Chinese tariffs were delayed, from September 1 to December 15, on some items. Tell me who saw this one coming. The potential costs of the tariffs are hitting the US more than China. It was worth a 550-point rally in the Dow Average. In 50 years, I’ve never seen such blatant market manipulation.
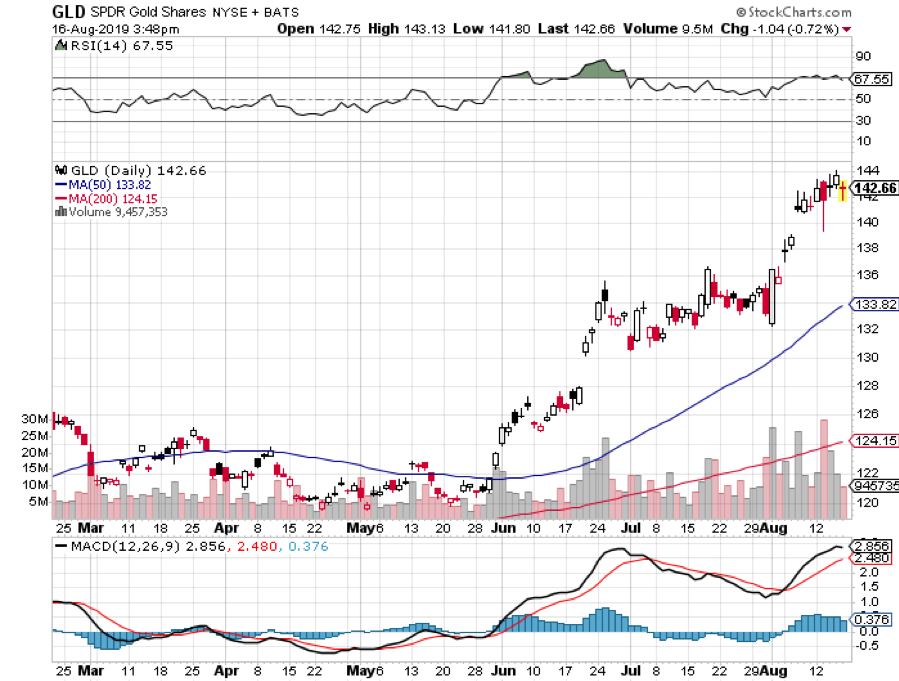
Gold hit a new six-year high, with the collapse of the Argentine Peso a new factor. A poor election result drove the beleaguered currency down 15% in one day, a massive move.
Now you have to worry about what’s happening in China AND Argentina. For the first time in history, gold now has a positive yield versus the Europe and the Japanese Yen, which both offer negative interest rates.
Hong Kong is becoming a factor driving US markets down. If there is a repeat if the 1989 Tiananmen Square massacre where thousands died, global markets could collapse. The hit to growth will be more than it currently can stand in its present weakened state.
Inflation is taking off, with Core Consumer Inflation for July coming in at a red hot 0.3%, delivering the strongest two-month price burst since 2006. If it keeps up, you can kiss those future interest rate cuts goodbye.
Germany is in recession. That is the only conclusion possible when you see Q2 at -0.1% growth and the economy still in free fall. The ZEW’s figures regarding Germany yesterday were nothing short of horrific as the Economic Sentiment Index fell to -44. When you damage China’s economy, it puts the rest of the world into recession. The global economy has become so interlinked, it can’t become undone without another great recession.
Bonds rates bottomed yesterday, at least for the short term, the intraday low for the ten-year US Treasury yield hitting 1.46%. Welcome to inversion land, where long term interest rates are below short-term ones. Confidence in the economy is melting like an Alaskan glacier. But with three more 25 basis point rate cuts to come, an eventual break below 1.0% is inevitable. Watch for stocks to remake half their recent losses.
Consumer Sentiment cratered in August from 97.0 estimated to 92.1. And that was before the stock market sold off. Consumer spending remains strong. The last time it was this strong was at the market top in 2008, the market top in 1999, and the market top in 1987.
July Housing Starts plunged 4.0%, to 1.191 million units as homebuilders move into recession mode. Not even record low-interest rates can get them to stick their necks out this time. Those that did last time got wiped out.
It’s been pedal to the metal all month with the Mad Hedge Trade Alert Service, with no less than 31 Trade Alerts going out so far. Some 18 or the last 19 round trips have been profitable, generating one of the biggest performance jumps in our 12-year history.
Since July 12, we have clocked a blistering 15.15% in profits or $15,150 for the model $100,000 trading portfolio.
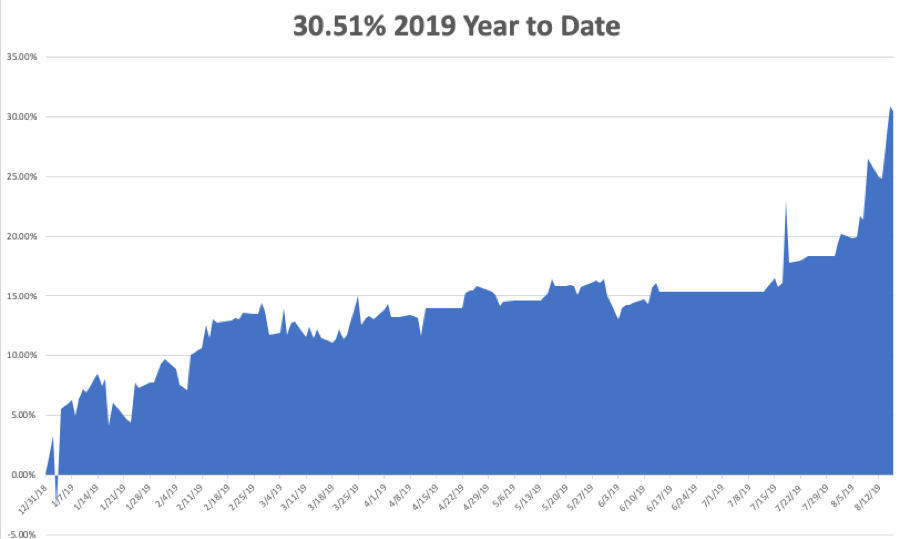
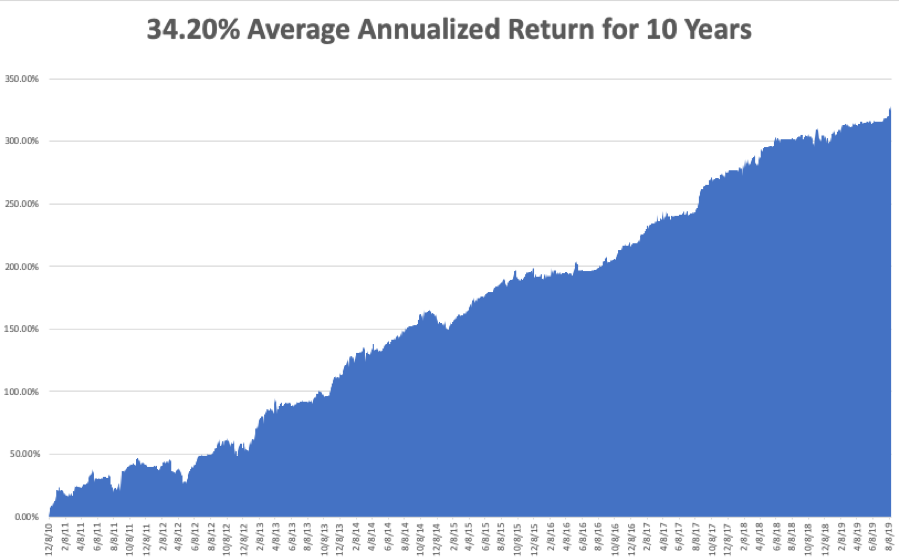
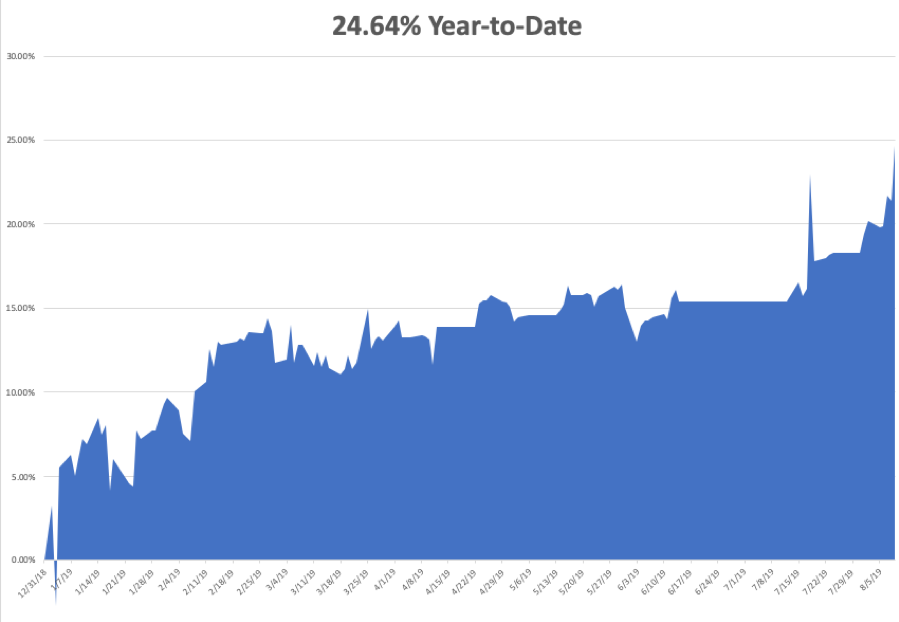
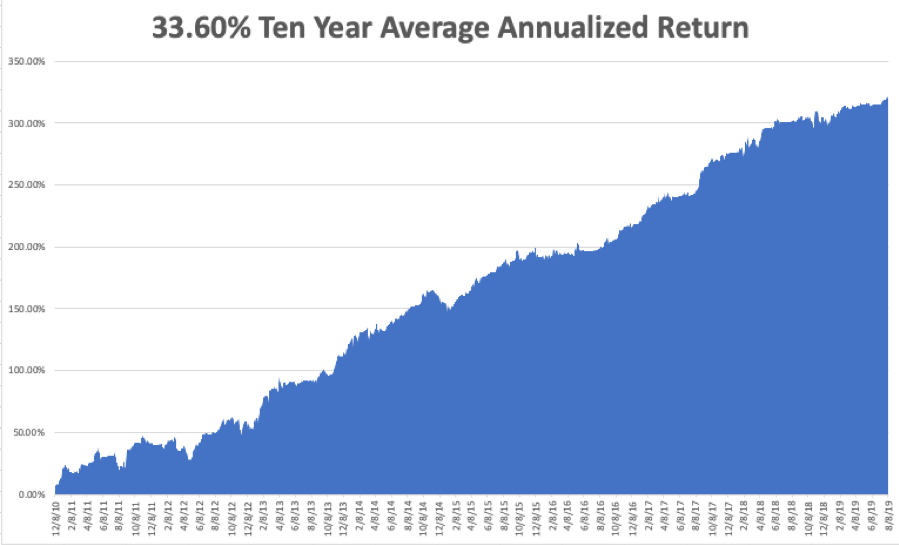
My Global Trading Dispatch has hit a new all-time high of 330.65% and my year-to-date shot up to +30.51%. My ten-year average annualized profit bobbed up to +34.20%.
I have coined a blockbuster 12.18% so far in August. All of you people who just subscribed in June and July are looking like geniuses. My staff and I have been working to the point of exhaustion, but it’s worth it if I can print these kinds of numbers.
The coming week will be a snore on the data front. Believe it or not, it could be quiet.
On Monday, August 19, nothing of note is released.
On Tuesday, August 20 at 10:30 AM, we get API Crude Oil Stocks.
On Wednesday, August 21, at 10:00 the Existing Home Sales are published for July.
On Thursday, August 22 at 8:30 AM, the Weekly Jobless Claims are printed. The Jackson Hole conference of global central bankers and economists begins.
On Friday, August 23 at 8:30 AM the July New Home Sales are announced.
The Baker Hughes Rig Count follows at 2:00 PM.
As for me, I will be attending the Pebble Beach Concourse d’Elegance vintage car show where I will be exhibiting my 1925 Rolls Royce Phantom I, the best car ever made.
I don’t mind the wooden brakes, but it’s too bad they didn’t make adjustable seats in those days to fit my 6’4” frame. However, its price appreciation has been better than Apple’s (AAPL) which I bought as a fixer upper in England during the 1980s for $20,000. My average cost on Apple is a split adjusted 25 cents.
My Rolls will be shown alongside James Bond’s 1964 Aston Martin which sold for $6.3 million, a 1939 Volkswagen Type 64 priced at more than $20 million, and a $13 million 1958 Ferrari 250 GT BBT.
And what am I doing next weekend? Taking the Boy Scouts to the Six Flags roller coaster farm in Vallejo.
Good luck and good trading.
John Thomas
CEO & Publisher
The Diary of a Mad Hedge Fund Trader

My Phantom I

1939 Volkswagen

1954 Ferrari
Global Market Comments
August 14, 2019
Fiat Lux
Featured Trade:
(HOW TO HANDLE THE FRIDAY, AUGUST 16 OPTIONS EXPIRATION),
(CRM), (FB), (M), (VIX)
(SILICON VALLEY REAL ESTATE SAYS THE BULL MARKET IN TECH CONTINUES)


Followers of the Mad Hedge Technology Letter have the good fortune to own three deep in-the-money options position that expires on Friday, August 16, and I just want to explain to the newbies how to best maximize their profits.
This involves the:
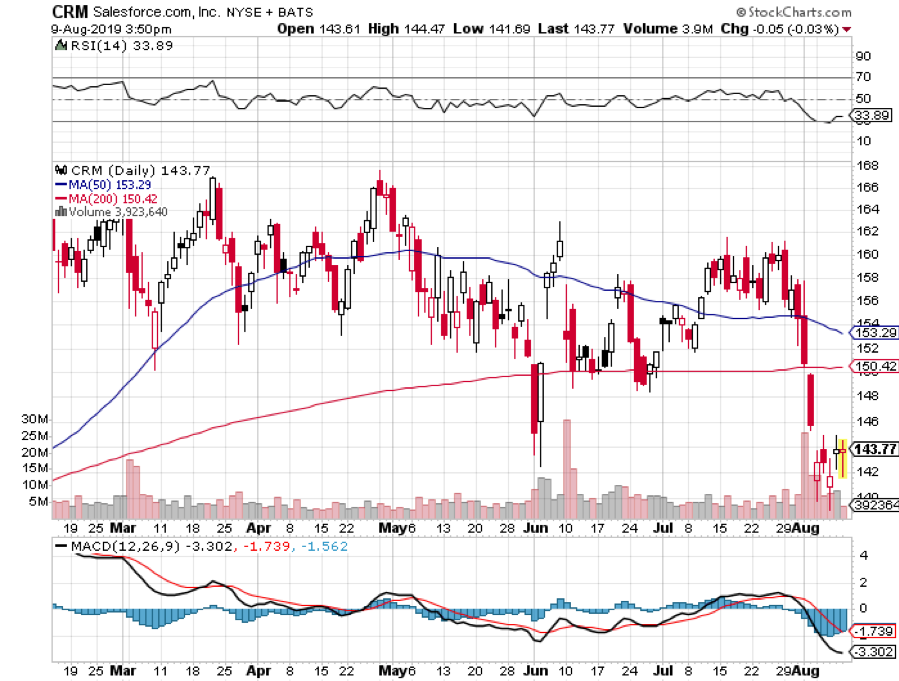
the Salesforce (CRM) August 2019 $125-$130 in-the-money vertical BULL CALL spread at $4.50 which will expire at $5.00
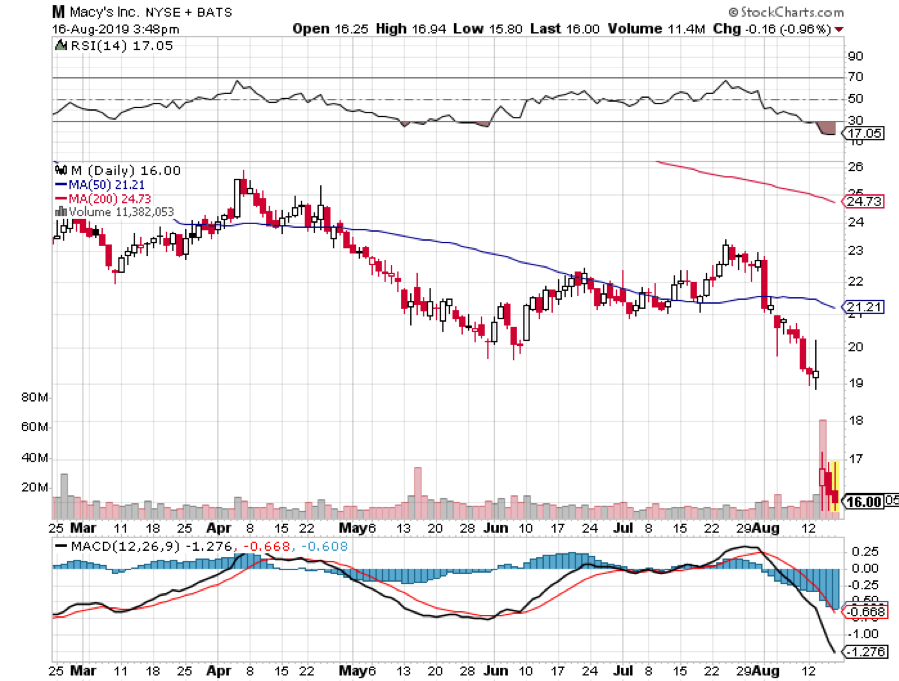
the Macy's (M) August 2019 $23-$25 in-the-money vertical BEAR PUT spread at $1.74 which will expire at $2.00
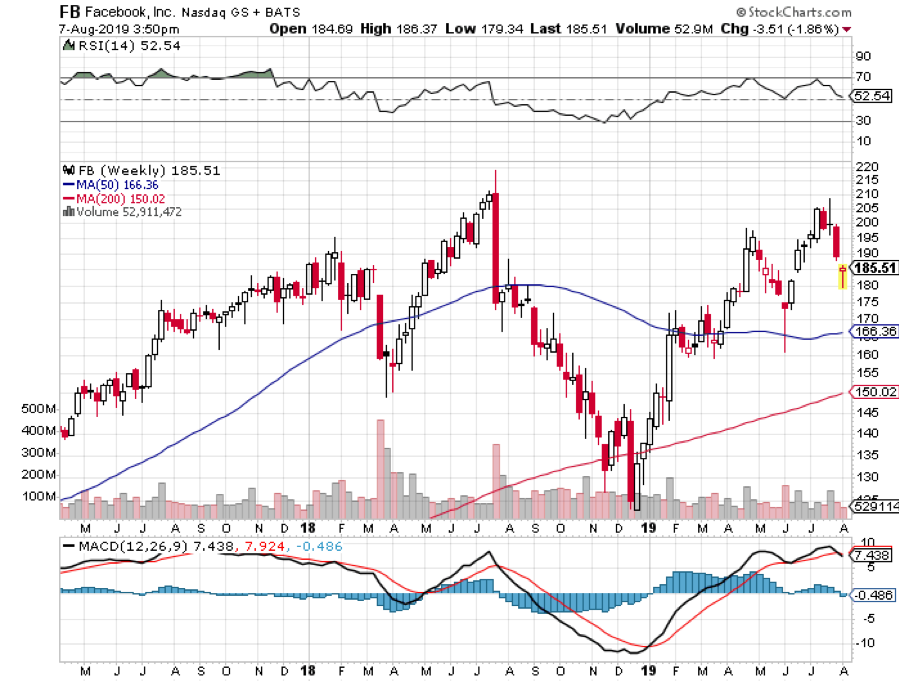
the Facebook (FB) August 2019 $167.50-$172.50 in-the-money vertical BULL CALL spread at $4.50 which will expire at $5.00
The total profit on all three positions will increase the value of our $100,000 model trading portfolio by 3.68%, or $3,680. This position only became possible due to the extreme volatility (VIX) seen in the market in recent weeks.
Provided that we don’t have a monster “RISK OFF” move in the market this week (more failure of the China trade talks? War with Iran? A massacre in Hong Kong?) which causes stocks to collapse and volatility to rocket, these positions should expire at its maximum profit points. So far, so good.
I’ll do the math for you on the Salesforce (CRM) position. Your profit can be calculated as follows:
Profit: $5.00 expiration value - $4.50 cost = $0.50 net profit
(22 contracts X 100 shares per option X $0.50 net profit)
= $1,100 or 11.11% in 7 trading days.
One of the reasons that I run these positions into expiration is that with volatility high, and therefore the implied volatility on the options, we get paid much more to run these into expiration than we have in the past.
Many of you have already emailed me asking what to do with these winning positions.
The answer is very simple. You take your left hand, grab your right wrist, pull it behind your neck, and pat yourself on the back for a job well done.
You don’t have to do anything.
Your broker (are they still called that?) will automatically use your long position to cover your short position, canceling out the total holdings.
The entire profit will be credited to your account on Monday morning August 19 and the margin freed up.
Some firms charge you a modest $10 or $15 fee for performing this service.
If you don’t see the cash show up in your account on Monday, get on the blower immediately and find it.
Although the expiration process is now supposed to be fully automated, mistakes occasionally do occur. Better to sort out any confusion before losses ensue.
If you want to wimp out and close the position before the expiration, it may be expensive to do so. You can probably unload them pennies below their maximum expiration value.
Keep in mind that the liquidity in the options market disappears, and the spreads substantially widen when a security has only hours or minutes until expiration on Friday. So, if you plan to exit, do so well before the final expiration at the Friday market close.
This is known in the trade as the “expiration risk.”
One way or the other, I’m sure you’ll do OK as long as I am looking over your shoulder, as I will be, always. Think of me as your trading guardian angel.
I am going to hang back and wait for good entry points before jumping back in. It’s all about keeping that “Buy low, sell high” thing going.
I’m looking to cherry-pick my new positions going into the next quarter end.
Take your winnings and go out and buy yourself a well-earned dinner. Or use it to put a down payment on a long cruise.
Well done, and on to the next trade.

Global Market Comments
August 12, 2019
Fiat Lux
Featured Trade:
(MARKET OUTLOOK FOR THE WEEK AHEAD, or
(CYB), (FXE), (TLT), (FXY), (COPX), (USO),
(GLD), (VIX), (FXB), (IWM0, (DIS), (CRB), (FB)
(A COW BASED ECONOMICS LESSON)

So, this is what the best trading week looks like.
Investors panicked. The hot money fled in droves. Predictions of escalating trade wars, recessions, and depressions abounded.
The bottom line for followers of the Mad Hedge Fund Trader? We picked up 4.4% on the week, as may make as much next week.
A number of trading nostrums were re-proven once again. That which can’t continue, won’t. When too many people gather on one side of the canoe, it will capsize. If you execute a trade and then throw up on your shoes, you know it will be a good one. I could go on and on.
The week also highlighted another trend. That is the market has become a one-trick pony. The focus of the market is overwhelmingly on technology, the only sector that can promise double digit growth for years to come. And it’s not just technology, but a handful of large cap companies. Investing has become a matter of technology on, or technology off.
This is always how bull markets end, be it the Nifty 50 of the early 1970s, Japanese stocks of the late 1980s, or the Dotcom Bubble of the 1990s.
It was a week that ran off fast forward every day.
China retaliated against the US in the trade war and stocks dove 900 points intraday. The Middle Kingdom imposed a total ban on all US agricultural imports and took the Yuan (CYB) down to a decade low to offset tariffs.
All financial markets and asset classes are now flashing recession and bear market warnings. The Mad Hedge Market Timing Index fell from 70 to 22, the steepest drop in recent memory. The US dollar dropped sharply against the Euro (FXE) and the Japanese yen (FXY). Oil (USO) went into free fall. Copper (COPX) collapsed to a new low for the year.
The New York Fed lowered its Q3 GDP growth to a lowly 1.56%, with the Atlanta Fed pegging 1.9%. Payrolls, orders, import/export prices, and trade are shrinking across the board, all accelerated by the ramp up in the trade war. Manufacturing and retailing are going down the toilet. Sow the wind, reap the whirlwind.
The German economy (EWG) is in free fall, as most analysts expect a negative -0.1% GDP figure for Q2. The fatherland is on the brink of a recession which will certainly spill into the US. That Mercedes Benz AMG S class you’ve been eyeing is about to go on sale. Great Britain (FXB) is already there, with a Brexit-induced negative -0.2% for the quarter.
Some 50% of S&P 500 dividends now yield more than US Treasury bonds. At some point, that makes equities a screaming “BUY” in this yield-starved world, but not quite yet. Is TINA (there is no alternative to stocks) dead, or is she just on vacation?
Ten-year US Treasury bonds (TLT) hit 1.61%, down an incredible 50 basis point in three weeks. Zero rates are within range by next year. The problem is that if the US goes into the next recession at zero interest rates, there is no way to get out. A decades-long Japanese style Great Depression could ensue.
Bond giant PIMCO too says zero interest rates are coming to the US. Too bad they are six months late from my call. It’s all a matter of the US coming into line with the rest of the world. The global cash and profit glut has nowhere else to go but the US. Much of the buying is coming from abroad.
Gold (GLD) hit a six-year high, as a rolling stock market panics drive investors into “RISK OFF” trades and downside hedges. While high interest rates are the enemy of the barbarous relic, low rates are its best friend and negative rates are even better. We are rapidly approaching century lows on a global basis.
Do your Christmas shopping early this year, except do it at the jewelry store and for your portfolio. Above $1,500 an ounce gold is beating stocks this year and the old all-time high of $1,927 is in the cards.
As I expected, August is proving to be the best short selling opportunity of the year. Not only can we make money in falling markets, elevated volatility means we can get into long side plays at spectacularly low levels as well.
With the Volatility Index (VIX) over $20, it is almost impossible to lose money on option spreads. The trick was to get positions off while markets were falling so fast.
The week started out with a rude awakening, my short in the US Treasury Bond Fund rising 1 ½ points at the opening. I covered that for a tear-jerking 3.26% loss, my biggest of the year. But I also knew that making money had suddenly become like falling off a log.
I fortuitously covered all of my short positions in the S&P 500 (SPY) and the Russell 2000 (IWM) right when the Dow average was plumbing depths 2,000-2,200 points lower than the highs of only two weeks ago. Then I went aggressively long technology with very short dated August plays in Walt Disney (DIS), Salesforce (CRM), and Facebook (FB).
My Global Trading Dispatch has hit a new all-time high of 324.78% and my year-to-date shot up to +24.68%. My ten-year average annualized profit bobbed up to +33.60%.
I coined a blockbuster 6.31% so far in August. In a mere three weeks I shot out 12 Trade Alerts, 11 of which made money, bringing in a 10% profit net of the one-bond loss. All of you people who just subscribed in June and July are looking like geniuses.
The coming week will be a snore on the data front. Believe it or not, it could be quiet.
On Monday, August 12 at 11:00 AM EST, the Consumer Inflation Expectations for July are released.
On Tuesday, August 13 at 8:30 AM US Core Inflation for July is published.
On Wednesday, August 14, at 10:30 the IEA Crude Oil Stocks are announced for the previous week.
On Thursday, August 15 at 8:30 AM EST, the Weekly Jobless Claims are printed. At 9:15 we learn July Industrial Production.
On Friday, August 16 at 8:30 AM, the July Housing Starts are out.
The Baker Hughes Rig Count follows at 2:00 PM.
As for me, I’ll be headed to the Land’s End Music Festival in San Francisco this weekend and listen to many of the local rock groups. Hopefully, I will be able to unwind from the stress and volatility of the week.
Good luck and good trading.
John Thomas
CEO & Publisher
The Diary of a Mad Hedge Fund Trader

Global Market Comments
August 8, 2019
Fiat Lux
Featured Trade:
(HOW TO KNOW IF THE BULL MARKET IS WELL AND TRULY OVER),
(THE TALE OF TWO ECONOMIES),
(FB), (AAPL), (AMZN)
I’m looking at my screens this morning and virtually every stock sold short by the Dairy of a Mad Hedge Fund Trader cratered to new six-month lows.
Call it lucky, call it fortuitous. All I know is that the harder I work the luckier I get.
If you are in the right economy, that of the future, you are having another spectacular year. If you aren’t, you are probably posting horrific losses for 2019. Call it the “Tale of two Economies.”
I suspected that this was setting up over the last couple of weeks. No matter how much bad news and uncertainty dumped on these companies, the shares absolutely refused to go down. Instead, they flat lined just below their 2019 highs. It was a market begging for a selloff.
When the Facebook (FB) hacking scandal hit, investors were ringing their hands about the potential demise of Mark Zuckerberg’s vaunted business model and the shares plunged to $123.
However, while analysts were making these dire productions, I knew that Facebook itself was signing a long-term lease for a brand new 46-story skyscraper in downtown San Francisco just to house its Instagram operations.
Months later, and the company that misused Facebook’s data, Steve Bannon’s Cambridge Analytica, is bankrupt, and (FB) is trading at $185, a new high. Facebook was right, and the Cassandras were wrong.
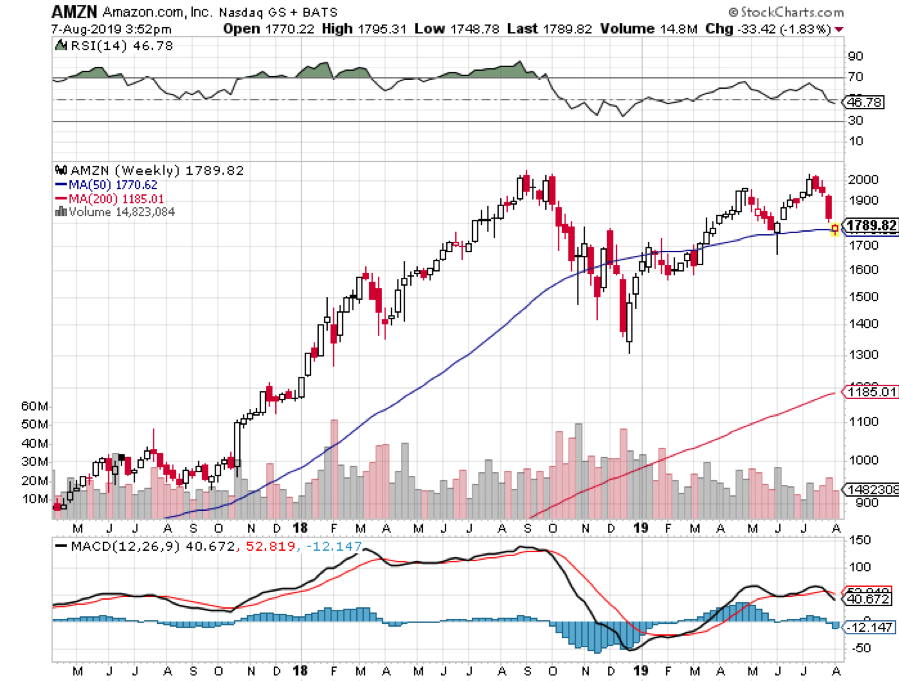
Amazon was given up for dead during the February melt down as the shares withered from a daily onslaught of presidential attacks threatening antitrust action. Today, the shares are up a mind-blowing 38% above those lows.
And when Apple announced its earnings, the shares tickled $222, putting it squarely back into the ranks of the $1 trillion club ($949 billion at today’s close).
It turns out that technology companies are immune from most of the negative developments that have caused the rest of the stock market to drag. I’ll go through these one at a time.
Falling Interest Rates
Tech companies are sitting gigantic cash mountains, some $245 billion in Apple’s case, which means that as net lenders to the credit markets, they are beneficiaries of the credit markets. This makes tech companies immune from the credit problems that will demolish old economy industries during the next rate spike.
Rising Oil Prices
While tech companies are prodigious consumers of electricity, many power these with massive solar arrays and they sell periodic excess power to local utilities. So as net energy producers, they profit from rising energy prices.
Rising Inflation
Since the output of technology companies is entirely digital, they can handily increase productivity faster than the inflation rate, whatever it is. Traditional old economy companies, like industrials and retailers can’t do this.
Remember that while analogue production grows linearly, digital production grows exponentially, enabling tech companies to handily beat the inflation demon, leaving others behind in the dust.
Share Buybacks
While technology companies account for only 26% of the S&P 500 stock market capitalization, they generate 50% of the profits. Thanks to the massive tax breaks and low tax repatriation of foreign profits enabled by the 2017 tax bill, share buybacks are expected to rocket from $500 billion to $1 trillion this year. Companies repurchasing their own shares have become the sole net buyers of equities in 2019.
And companies with the biggest profits buy back the most stock. This has created a virtuous cycle whereby higher share prices generate more buybacks to create yet higher share prices. Old economy companies with lesser profits are buying back little, if any, of their own shares.
Of course, tech companies are not without their own challenges. For a start, they have each other to worry about. FANGs will simultaneously cooperate with each other in a dozen areas, while fight tooth and nail and sue on a dozen others. It’s like watching Silicon Valley’s own version of HBO’s Game of Thrones.
Also, occasionally, the tech story becomes so obvious to the unwashed masses that it creates severe overbought conditions and temporary peaks, like we saw in January.
Mad Hedge Technology Letter
July 29, 2019
Fiat Lux
Featured Trade:
(THE RACE TO THE BOTTOM),
(SCHW), (FB), (SQ), (WMT), (AMZN), (FFIDX), (BOX)
Gone are the days of brokers shouting from the trading pits, a bygone era where pimple-faced traders cut their teeth rubbing shoulders with the journeymen of yore.
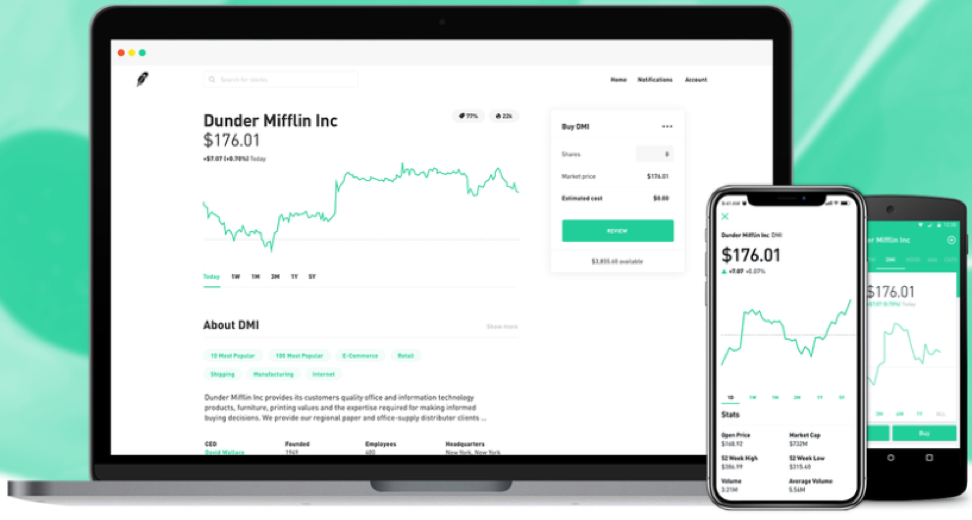
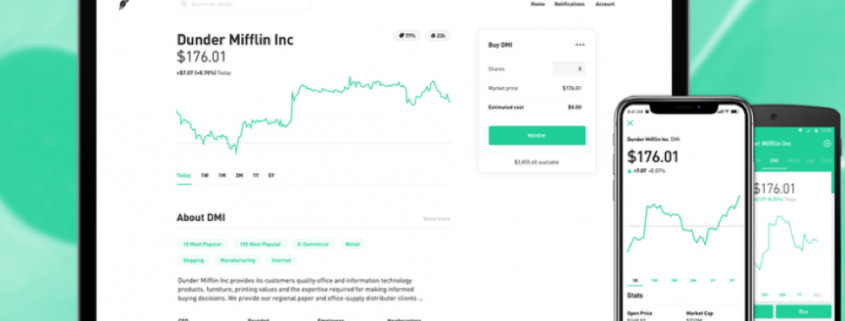
The stock brokerage industry is at an inflection point with the revolutionary online stock brokerage Robinhood on the verge of shaking up an industry that has needed shaking up for years.
A common thread revisited by this newsletter is the phenomenon of broker apps being low-quality tech.
A broker ultimately serves little or no value to the real players among the deal, usually extracting huge commissions.
Technology and now blockchain technology vie to completely remove this exorbitant layer from the business process.
Well, for the stock brokerage industry, that time is now.
Robinhood is an online stock brokerage company based in Menlo Park, Calif., trading an assortment of asset classes including equities, options, and cryptocurrencies.
So, what's the catch?
Robinhood does not charge commission.
That's right, you can invest up until the $500,000 threshold protected by the Securities Investor Protection Corporation (SIPC) and you can go along with your merry day trading for free.
The online brokerage industry has been getting away with murder for years.
They got comfortable and stopped innovating - the death knell of any company in 2019.
Effectively, high execution costs reaping massive profits were the norm for brokers, and nobody questioned this philosophy until Robinhood exposed the ugly truth - unreasonably high rates.
Peeking at a monthly chart of brokerage costs will make your stomach churn.
For instance, a trader frequently executing trades with an account of $100,000 would hand over $1836 in commission in 2017 if their account was with Fidelity.
On the cheaper side, Interactive Brokers would charge $854 for its brokerage services to habitual traders per month.
The outlier was Tradier, a start-up brokerage founded in 2014 using the powerful tool of an Application Programming Interface (API) which charged $213 per month to trade frequently.
An API is described as a software intermediary allowing two applications to communicate with each other.
This model helped cut costs for the online brokerage because Tradier did not have to focus its funds on the trading platform that was delegated to various third-party platforms.
Tradier is largely responsible for the aggregation of data and charts thus employing an army of developers to meet their end of the business.
This model is truly the democratization of the online brokerage industry, which has been coming for years.
Costs are cut to a minimum with equity trades at Tradier costing investors $3.49 per order and options contracts costing $0.35 per contract with a $9 options assignment and exercise fee.
Technology has defeated the traditionalist again.
More than 80% of Robinhood's accounts are owned by millennials – as expected.
Trading cryptocurrencies act as a gateway asset to springboard into other asset classes such as equities and derivative contracts.
Vlad Tenev, co-CEO of Robinhood, indicated that Robinhood will have to modify its radical business model to monetize more of the business in the future, but he is comfortable with the current business model.
But Tenev has already seen fruit borne with the likes of Robinhood applying fierce pressure to the legacy brokerages' pricing models.
The traditionalists are locked in a vicious pricing war with each other slashing their commission rates to stay competitive.
The longer the likes of Charles Schwab (SCHW) feel it necessary to charge $4.95, down from the January 2017 cost of $8.95, the better the chances are that Robinhood can build its account base rapidly.
Charles Schwab has more than 10 million accounts, only double the number of Robinhood, after being founded in 1971.
The 42-year head start over Robinhood has not produced the desired effect, and it is ill-prepared to battle these tech companies that enter the fray.
Robinhood has been able to add a million new accounts per year. If Charles Schwab relatively performed at the same rate, it would have 47 million accounts open today.
It doesn't and that is a problem because the company can be caught up to.
The age of specialization is upon us with full force, and customer demand requires care and diligence that never existed before.
Robinhood continues to enhance its offerings of various products adding Litecoin and Bitcoin Cash to the crypto lineup.
Only Bitcoin and Ethereum were offered before.
And there is one more outrageous thing I forgot to tell you.
Robinhood hopes to snatch away the traditional savings account by offering checking and savings accounts with an interest rate almost 30 times larger than most brick and mortar banks – 3%.
These accounts would have no minimum balances or no fees that nickel and dime customers.
The service will conveniently sit alongside its trading app and this move into the industry led by JP Morgan could start to derail Wall Street.
As with most FinTech start-ups, the roll-out of this new service was slightly botched because Robinhood failed to get the go-ahead from regulators concerning ensuring the accounts properly.
All this does is delay the inevitable and by spring 2019, potential customers should be earning 3% in Robinhood’s checking and savings account.
Sign me up!