Below please find subscribers’ Q&A for the October 28 Mad Hedge Fund Trader Global Strategy Webinar broadcast from Silicon Valley, CA with my guest and co-host Bill Davis of the Mad Day Trader. Keep those questions coming!
Q: Do you think if Trump contests the election, it will be bad for stocks?
A: Yes, count on that knocking another 10% off of stocks. The market has spent the last six months pricing in a Biden win. Take that away and you have to price that back out again, about 6,000 Dow Average points (INDU). We’ve already dropped 2,500 points so that leaves another 3,500 points of downside t0 go in the event of a Trump win.
Q: Will that result in a crash?
A: Yes. At least 1,000 points in the overnight session following.
Q: Do you think it’s going to happen?
A: No. According to the polls, Trump will lose by at least 15 million votes. While the polls missed the Electoral College result last time, they were dead on with the popular vote, with Hillary Clinton winning by 3 million votes. If the margin were only a few hundred or thousand votes in a single battleground state, Trump might win a court fight. But he can’t win if the margin is in ten states and tens of millions of votes. That is too much to fudge. That is how markets react: they hate surprises, and a second Trump win would be the surprise of the century.
Q: With all of the earnings positive, do you think markets will stay positive?
A: Earnings aren’t important right now. Everyone knew earnings would be great because we were coming off of hundred-year lows caused by the pandemic. So yes, we knew they’d be up 50%, 100%, 150%; that's not the surprise. The bigger issue is what the pandemic is going to do, and of course, only biochemists know that—most stock traders have no idea, which is reflected in these gigantic swings we’re seeing in the market both on the upside and the downside. As a biochemist, I can tell you that this is our final wave that's coming up and it could last several months. After that, we get a vaccine or herd immunity. When it's done, you have the bull market of a lifetime—up 400% in ten years from these levels. Dow 120,000 here we come!
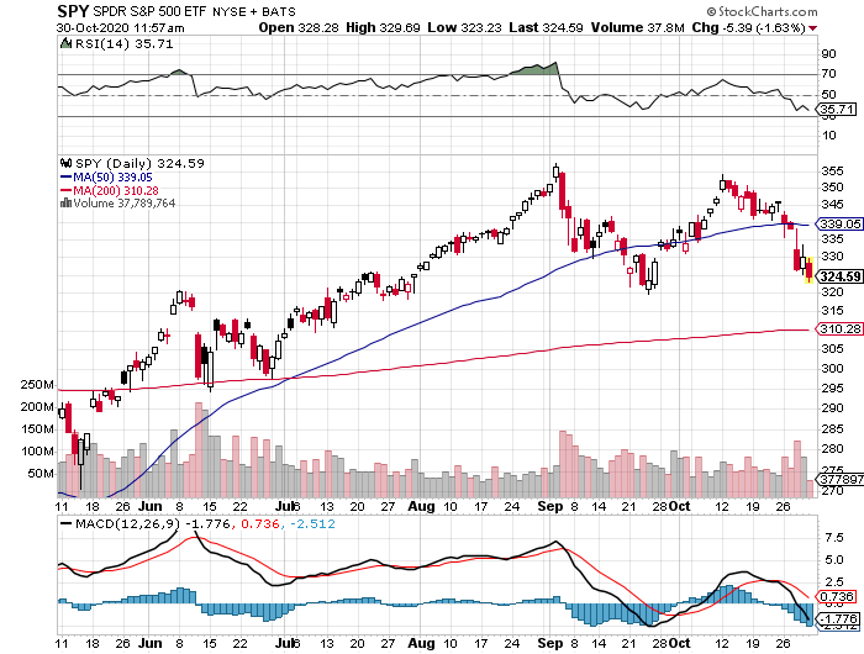
Q: Do you see a tax selloff if Biden gets in? Should we get short?
A: Definitely; there will be a tax selloff. Past ones have only lasted a week or two and those were the last two weeks of December, so it really won’t be that bad. It’s not like it’s a surprise that Biden is ahead in the polls, because he has been for 6 months. Nor is it a surprise that he is going to raise taxes on the wealthy. I wouldn’t get short though. The short play was last week and the week before; and I did manage to get out three shorts but didn't want to get too big in front of an election. So those all worked. I'm out of all of them now, and now we’re looking only at long plays. And with the Volatility Index (VIX) over $40, you can go 20% or 30% in-the-money on these call spreads and still look to make 10%-20% profit on the position in a month.
Q: Isn’t the pandemic great for Amazon (AMZN)?
A: Yes, Amazon was taking over the world anyway, and forcing everyone to an online-only economy which couldn’t be better for them. A lot of this shifting is permanent and won’t be going back to the way it was before the pandemic with brick and mortar shops and malls. So yes, we love Amazon and I would buy on the dips. There’s a double from here.
Q: Do you have long term names I can buy to sit on?
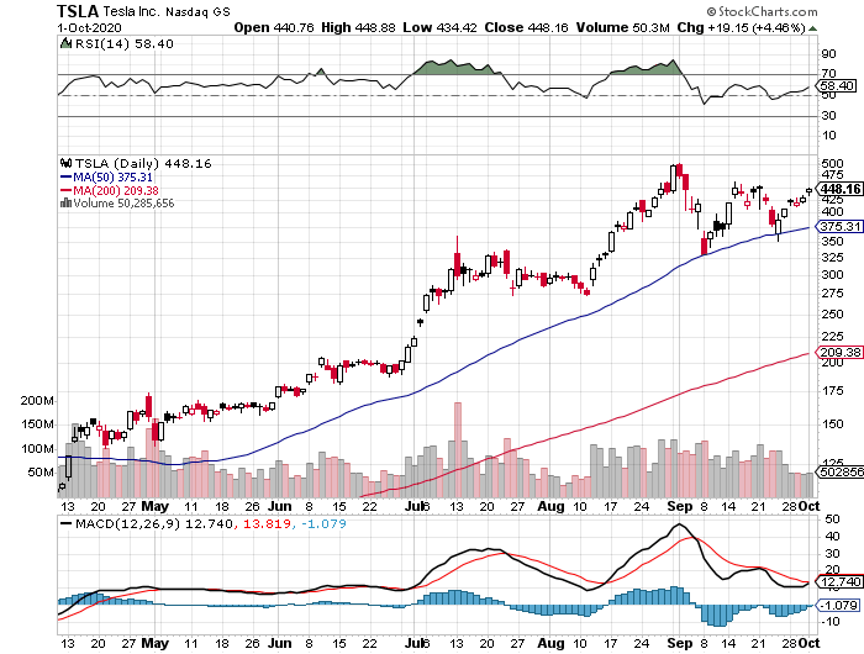
A: Yes, we actually do have a long-term portfolio posted on the website. It would be listed under your subscription area once you log in—we rebalance that twice a year. And of course, we had a 10% holding in Tesla (TSLA) which went up ten times, so the performance of the long-term portfolio is through the roof. To find the long-term portfolio, please click here.
Q: Do you record this webinar?
A: Yes, we post it on the www.madhedgefundtrader.com site in two hours.
Q: Do you still like the Internet security stocks like FireEye (FEYE)?
A: Yes. Hacking is growing faster than the Internet itself. You should also look at Palo Alto Networks (PANW) and the ETF (HACK).
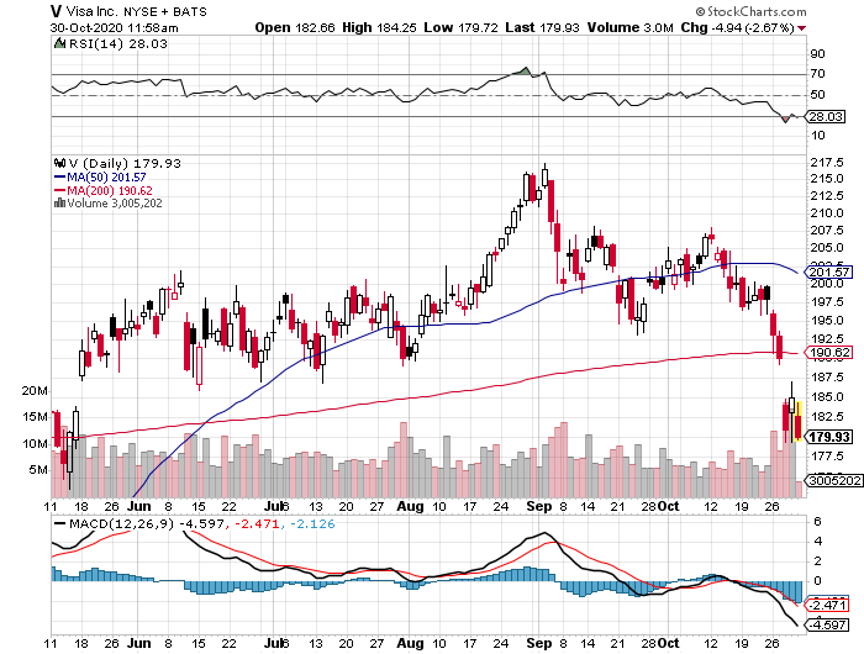
Q: Should we hold on to the Visa (V) spread hoping it will come back after the election drop?
A: Hope is not an investment strategy. I always stop out of positions when they hit a 2% loss. The only time I have 4% losses is when we get these gigantic gap moves overnight, which tend to happen once every one or two years. In this case, Visa got hit with a surprise antitrust suit from the Department of Justice that knocked $10 off of the stock. So no, I will not hold on to it in the hope that it does better; I will try to minimize my losses, get out, and get into the next winning position. Hope is what turns a 4% loss into a complete 10% write off.
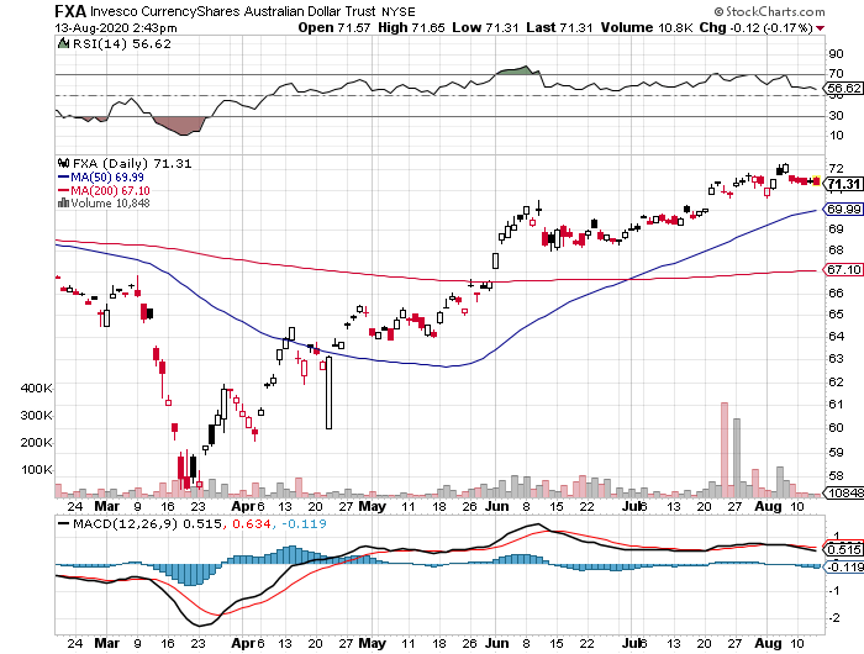
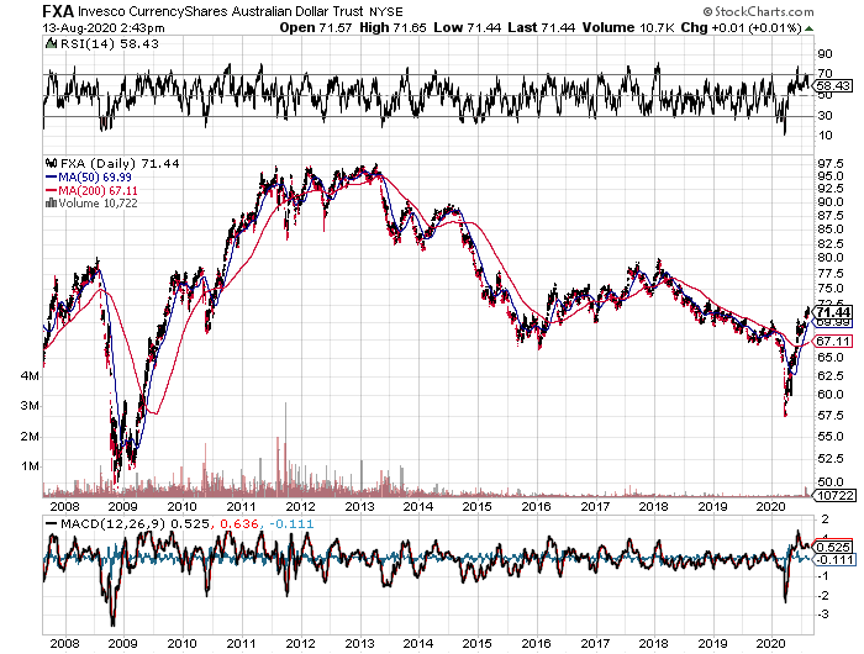
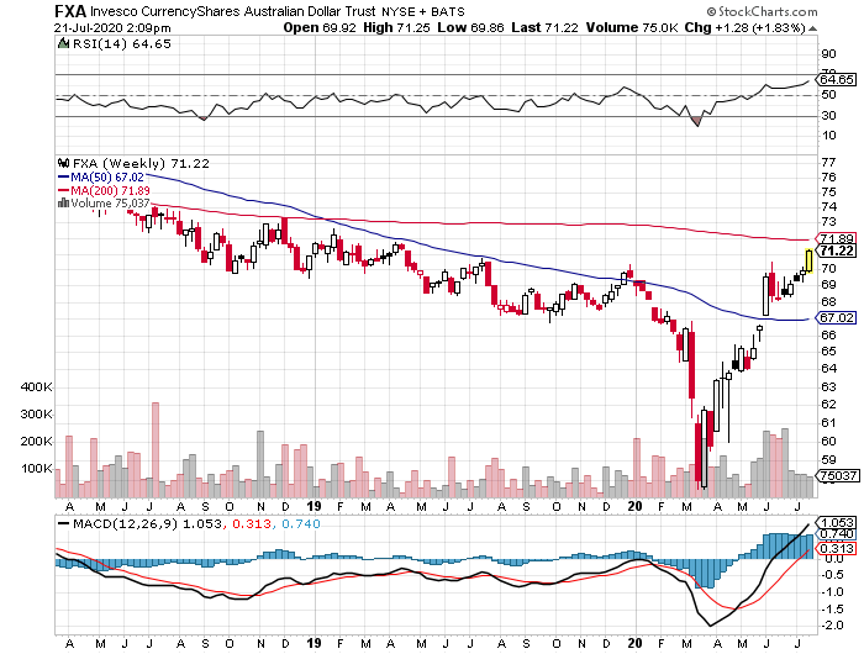
Q: What’s your view on the Canadian dollar (FXC)?
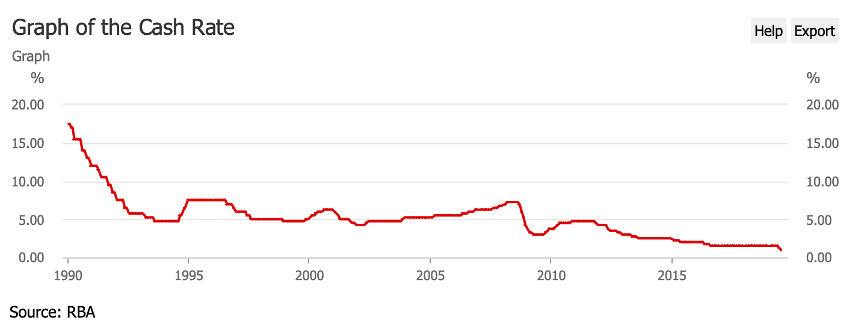
A: I like it, but it’s not as good as the Australian dollar (FXA) because Canada has a major oil exposure, and actually the worst kind of oil exposure—tar sands in northern Alberta. The outlook for oil is poor and that will be a drag on the currency in the form of fewer exports. Buy the (FXA). No oil troubles here. Kangaroos are another story.
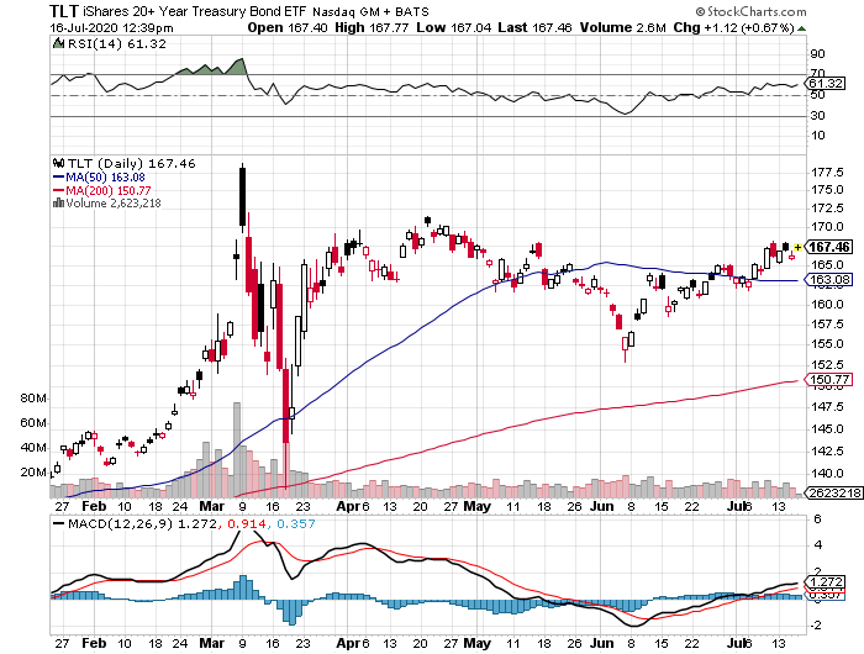
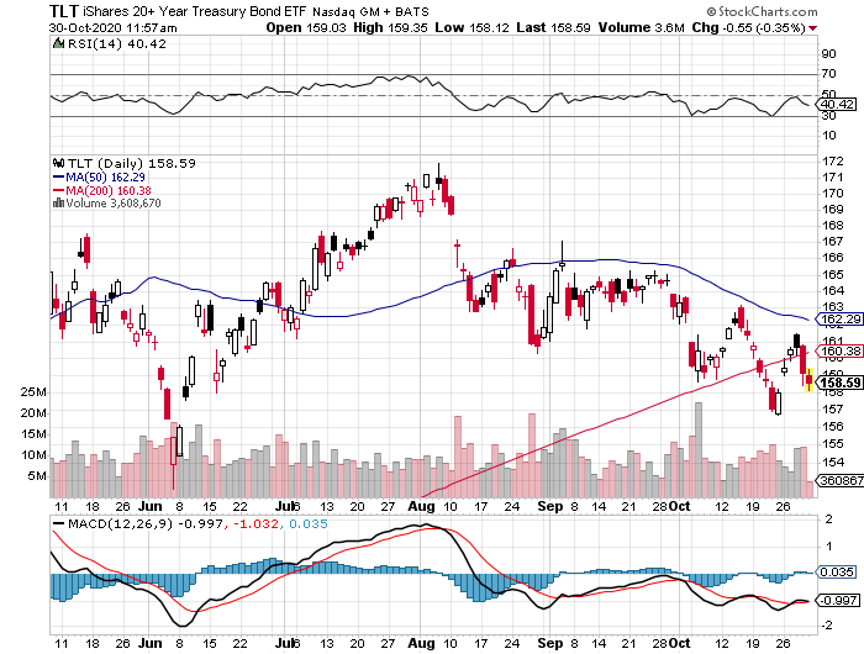
Q: Will you be looking to sell short on the United States Treasury Bond Fund (TLT)?
A: Yes, if we can just get a little bit higher. We’re looking at an economic recovery next year, so we’d expect the (TLT) to be lower by at least $20 points in 2021.
Q: Do you think the San Francisco and New York housing markets will return to what they were before with so many people are moving out of the city?
A: Yes, they will come back, I’ve been through many of these cycles in San Francisco over the past 50 years; it always comes back. Once the pandemic is over, people will say, “Oh my gosh, I can’t believe you can get a two-bedroom apartment in San Francisco for only $2 million.” That's probably another year or two off after a vaccine is in widespread distribution.
Q: Is real estate in a bubble?
A: Absolutely, but real estate bubbles can go on for a long time, like ten years. The bubble in Australia has been going on for 30 years. Ultimately, real estate prices are driven by the earnings power of the local economy which, in the case of San Francisco, is huge. This time around, we have a record large millennial generation looking for real estate. There are 85 million millennia buyers with only 65 million Gen X-er’s selling homes. So, we have to make up a shortfall of 20 million houses at some point. That’s why building permits are through the roof every month.
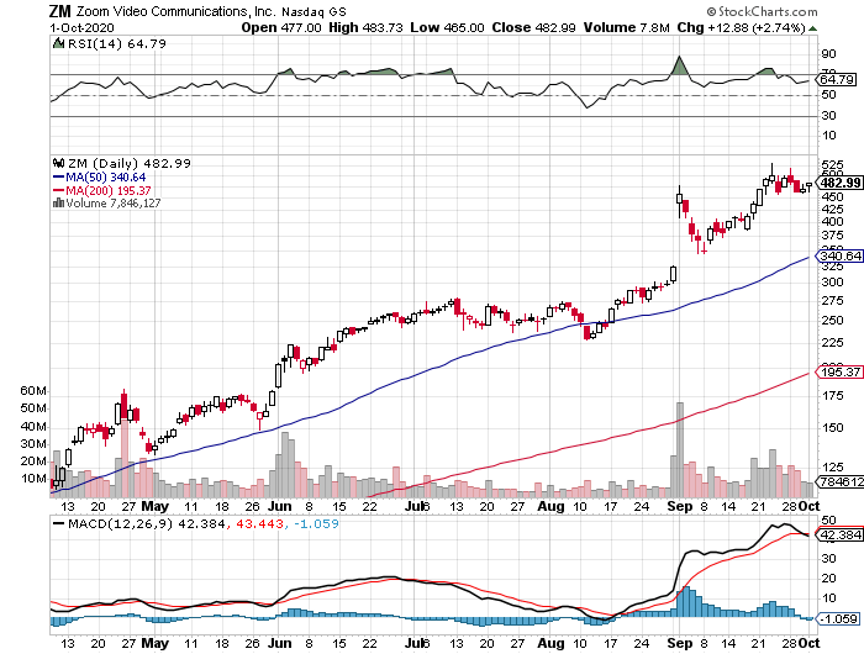
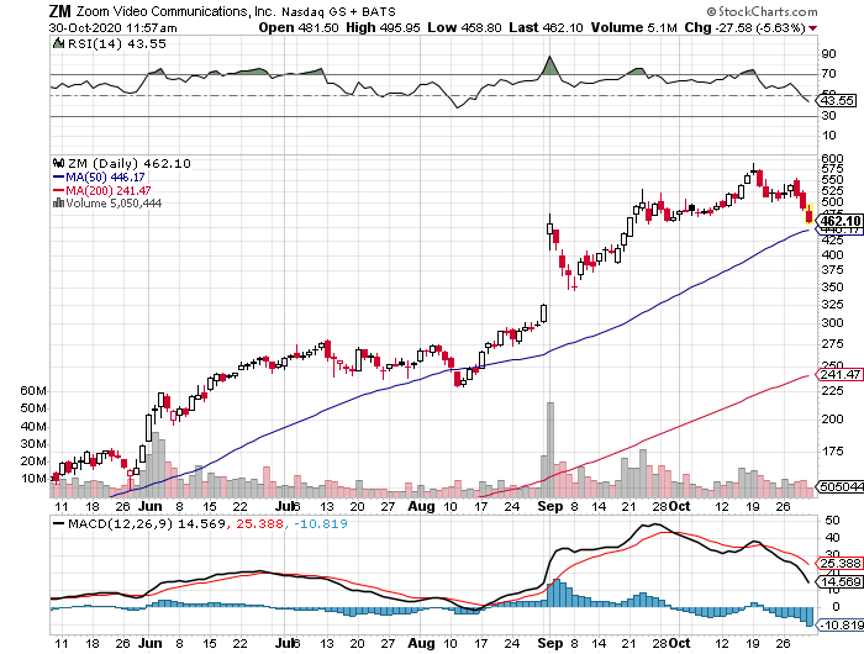
Q: Zoom (ZM) and DocuSign (DOCU) are the darling stocks of COVID 2020—what do you think about them at these high prices?
A: Very high risk. If you bought these a year ago when we first started covering them, good for you as they're up ten times. However, there are better fish to fry than chasing these big pandemic winners at all-time highs.
Q: If Biden wins, what happens to defense stocks like Raytheon Technology (RTX)?
A: They go down. It turns out a lot of the defense business is in very long term contracts that can’t be broken. They have to supply so many planes a year to the government for a decade or more. However, the sentiment on these sectors sours under democratic administrations because they are not initiating new weapons systems where the big money is made. Lockheed Martin (LMT), Northrop Grumman (NOC), and General Dynamics (GD) all have the same problem. I grew up with these companies. They were the FANGs of their day.
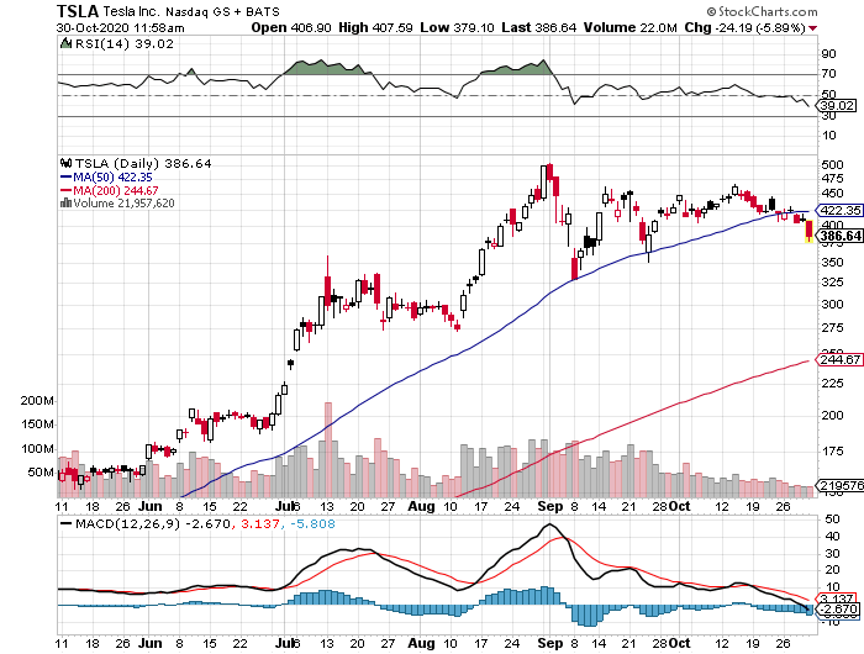
Q: How does a Biden win affect Tesla (TSLA)?
A: Then $2,500 a share for Tesla looks cheap (it’s now at $410). Biden will do everything he can to slow climate change and accelerate alternative energy. Tesla is front and center on that. Under current law, car manufacturers are limited on the number of units they can sell to get the $7,500 tax break per vehicle. Tesla used up all their subsidies five years ago. My bet is that the limits will be eliminated and that leads to a huge surge in Tesla sales in the U.S., which is why the stock has gone up 10 times in the last year. Tesla has promised to drop their car price to $25,000 in three years. If you throw in $10,000 in federal and state tax subsidies you get the car for free. Then you can write off General Motors (GM) and Ford (F).
Good Luck and Stay Healthy.
John Thomas
CEO & Publisher
The Diary of a Mad Hedge Fund Trader

Bear Sighting