Whatever the market is drinking right now, I’ll take some of that stuff. If you could bottle it and sell it, you’d be rich. Certainly, the Viagra business would go broke.
To see the Dow average only give up 7% in response to the worst trade war in a century is nothing less than stunning. To see it then make half of that back in the next four days is even more amazing. But then, that is the world we live in now.
When the stock market shrugs off the causes of the last great depression like it’s nothing, you have to reexamine the root causes of the bull market. It’s all about the Fed, the Fed, the Fed.
Our August central bank’s decision to cancel all interest rate rises for a year provided a major tailwind for share prices at the end of 2018. The ending of quantitative tightening six months early injected the steroids, some $50 billion in new cash for the economy per month.
We now have a free Fed put option on share prices. Even if we did enter another 4,500-point swan dive, most now believe that the Fed will counter with more interest rate cuts, thanks to extreme pressure from Washington. A high stock market is seen as crucial to winning the 2020 presidential election.
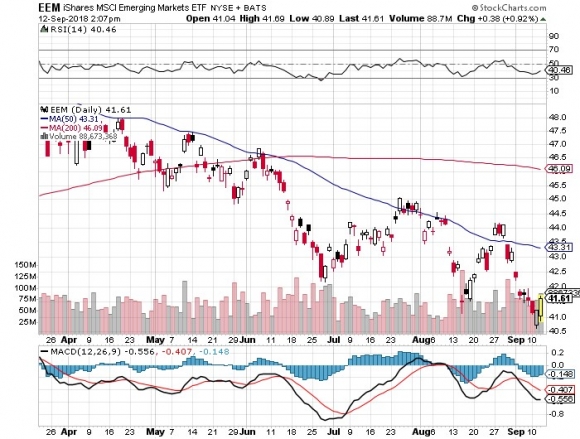
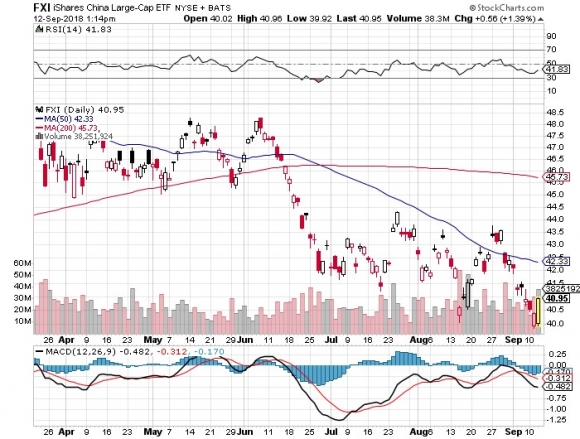
Furthermore, permabulls are poo-pooing the threat to the US economy the China (FXI) trade war presents. Some $500 billion in Chinese exports barely dent the $21.3 trillion US GDP. It’s not even a lot for China, amounting to 3.7% of their $13.4 trillion GDP, or so the argument goes.
Here’s the problem with that logic. The lack of a $5 part from China can ground the manufacture of $30 million aircraft when there are no domestic alternatives. Similarly, millions of small online businesses, mostly based in the Midwest, couldn’t survive a 25% price increase in the cost of their inventory.
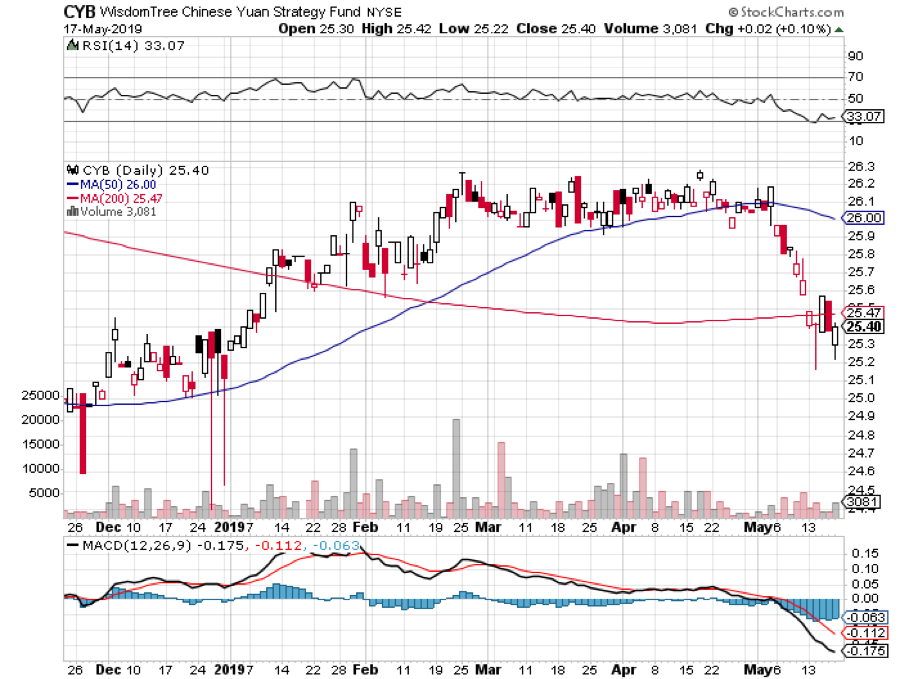
As for the Chinese, while trade with us is only 3.7% of their economy, it most likely accounts for 90% of their profits. That’s why the Chinese yuan (CYB) has recently been in free fall in a desperate attempt to offset punitive tariffs with a substantially cheaper currency.
The market will figure out all of this eventually on a delayed basis and probably in a few months when slowing economic growth becomes undeniable. However, the answer for now is NOT YET!
Markets can be dumb, poor sighted, and mostly deaf animals. It takes them a while to see the obvious. One of the problems with seeing things before the rest of the world does, I can be early on trades, and that can translate into losing money. So, I have to be cautious here.
When that happens, I revert to an approach I call “Trading devoid of the thought process.” When prices are high, I sell. When they are low, I buy. All other information is noise. And I keep my size small and stop out of losers lightning fast. That’s how I managed to eke out a modest 0.63% profit so far this month, despite horrendous trading conditions.
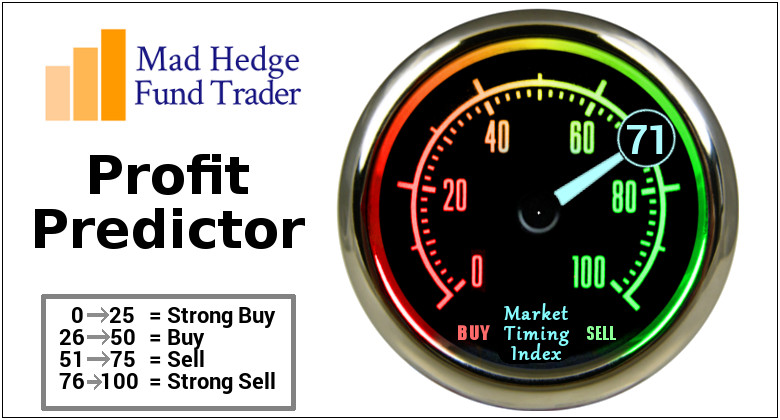
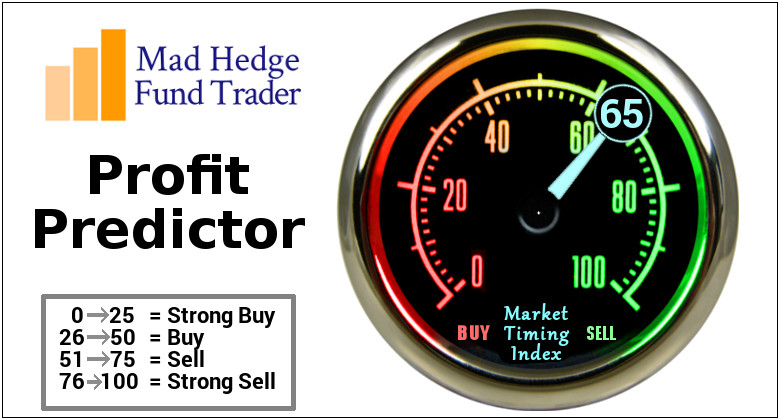
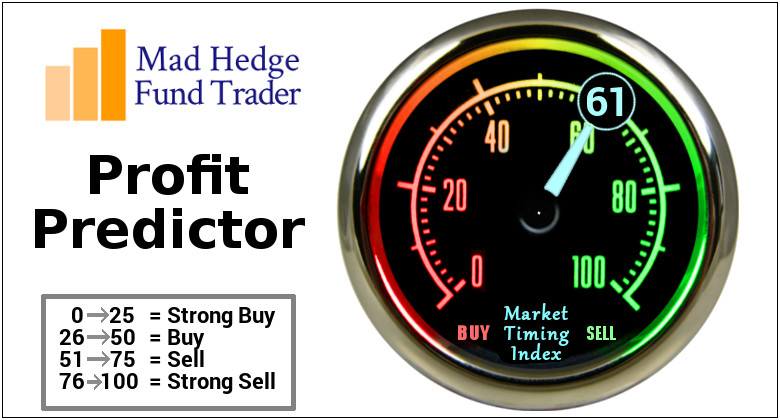
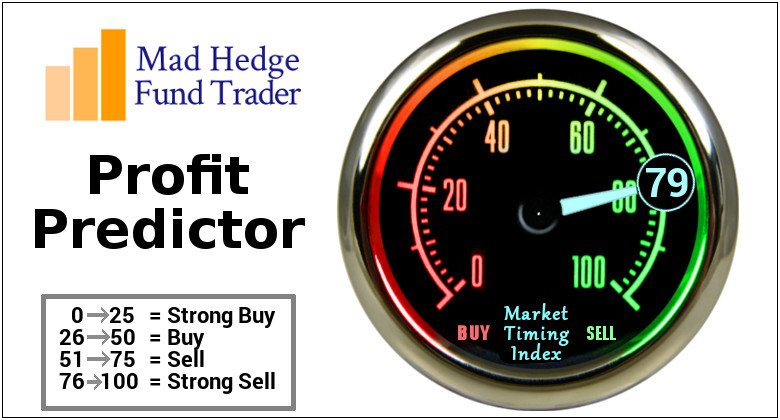
You have to trade the market you have, not what it should be, or what you wish you had. It goes without saying that the Mad Hedge Market Timing Index become an incredibly valuable tool in such conditions.
It was a volatile week, to say the least.
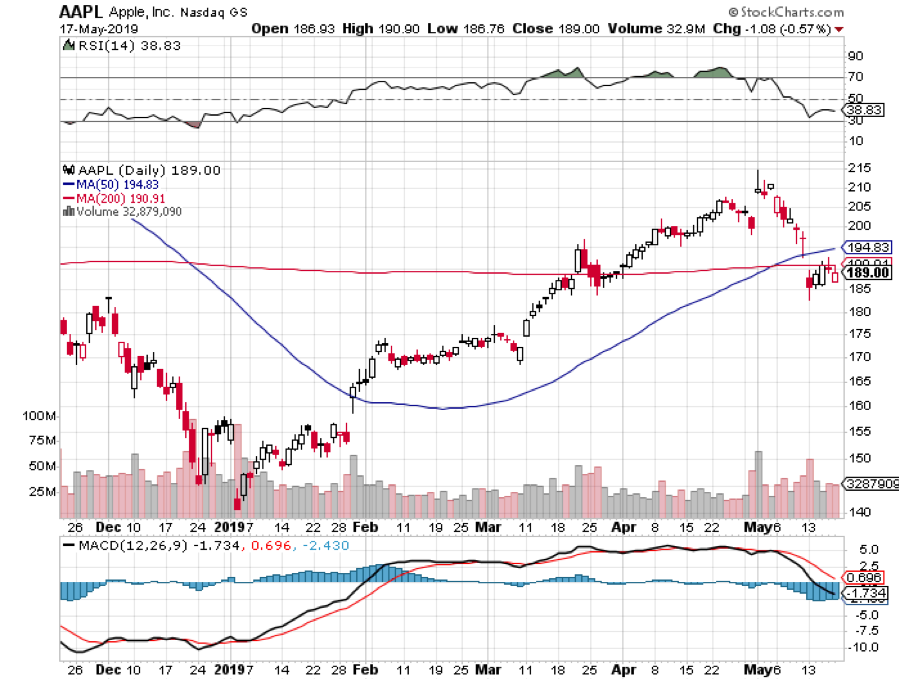
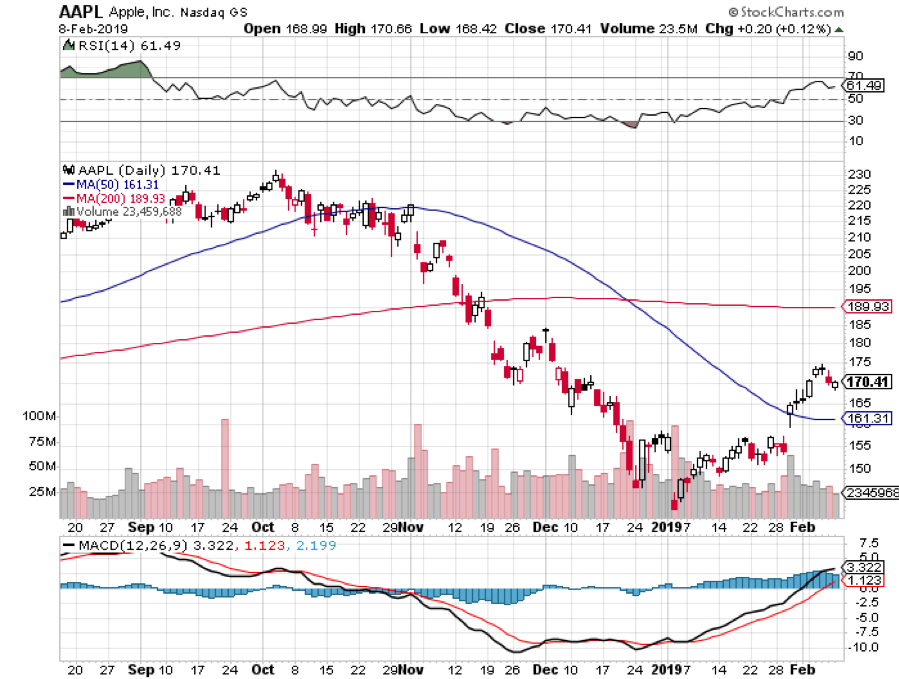
China retaliated, raising tariffs on US goods, ratcheting up the trade war. US markets were crushed with the Dow average down 720 intraday and Chinese plays like Apple (AAPL) and Boeing (BA) especially hard hit.
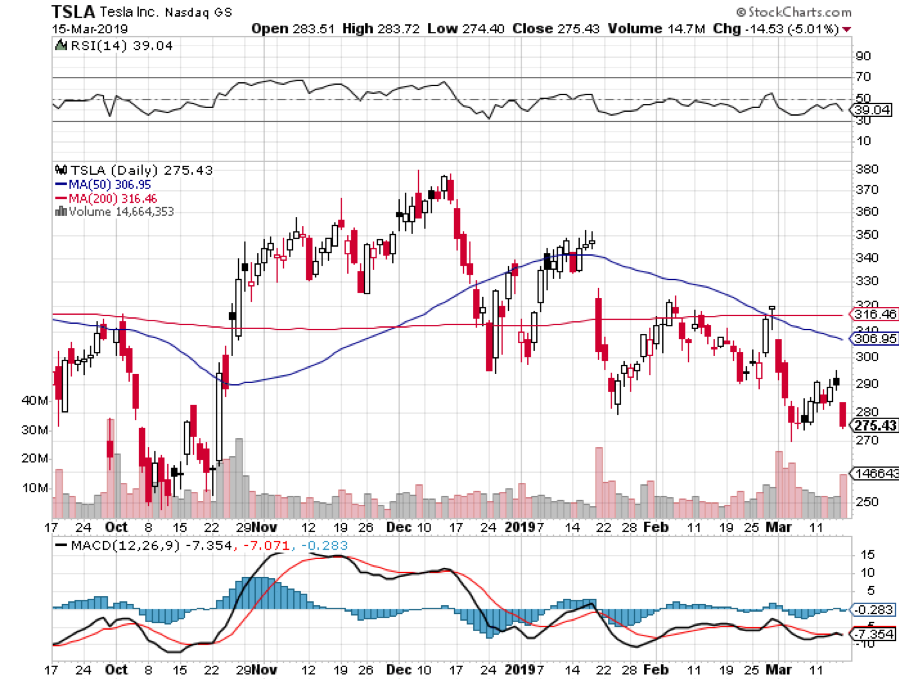
China tariffs are to cost US households $500 each in rising import costs. Don’t point at me! I buy all American with my Tesla (TSLA).
The China tariffs delivered the largest tax increases in history, some $72 billion according to US Treasury figures. With Walmart (WMT) already issuing warnings on coming price hikes, we should sit up and take notice. It is a highly regressive tax hike, with the poorest hardest hit.
The Atlanta Fed already axed growth prospects for Q2, from 3.2% to 1.1%. This trade war is getting expensive. No wonder stocks have been in a swan dive.
US Retail Sales cratered in March while Industrial Production was off 0.5%. Why is the data suddenly turning recessionary? It isn’t even reflecting the escalated trade war yet.
European auto tariff delay boosted markets in one of the administration’s daily attempts to manipulate the stock market and guarantee support of Michigan, Wisconsin, and Pennsylvania during the next presidential election. All government decisions are now political all the time.
Weekly Jobless Claims plunged by 16,000 to 212,000. Have you noticed how dumb support staff have recently become? I have started asking workers how long they have been at their jobs and the average so far is three months. No one knows anything. This is what a full employment economy gets you.
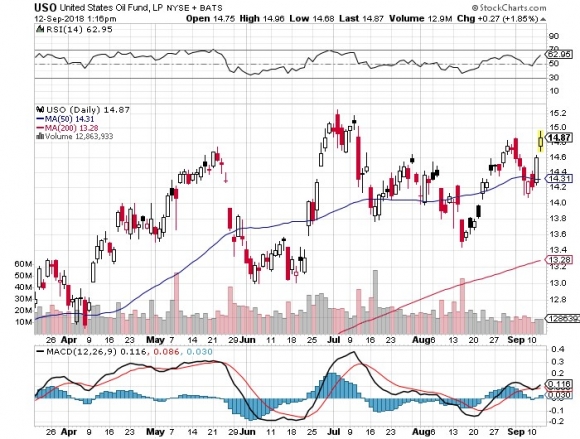
Four oil tankers were attacked at the Saudi port of Fujairah, sending oil soaring. America’s “two war” strategy may be put to the test, with the US attacking Iran and North Korea simultaneously.
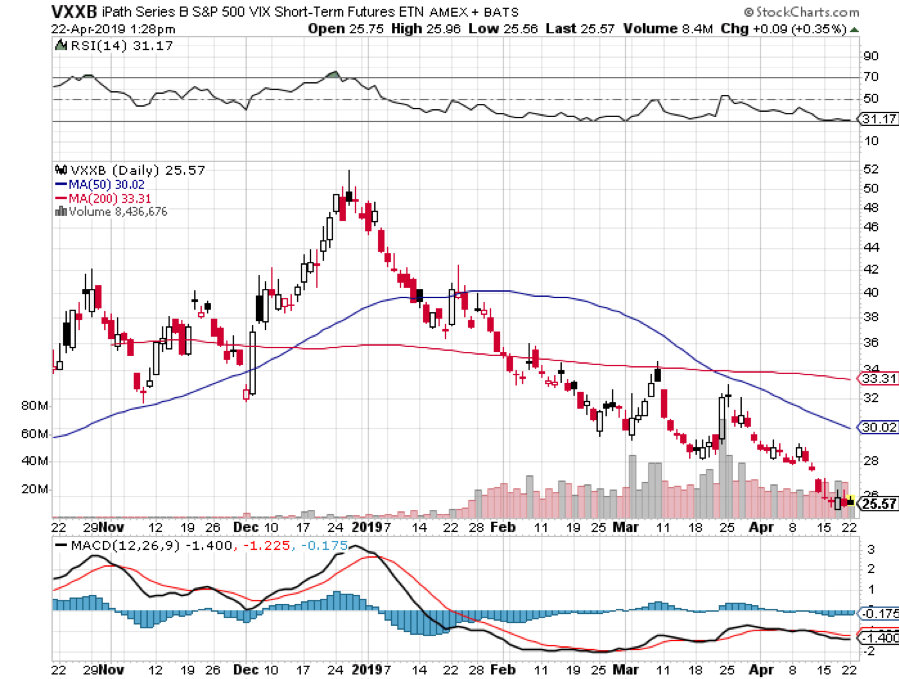
Bitcoin topped 8,000, on a massive “RISK OFF” trade, now double its December low. The cryptocurrency is clearly replacing gold as the fear trade.
The Mad Hedge Fund Trader managed to blast through to a new all-time high last week.
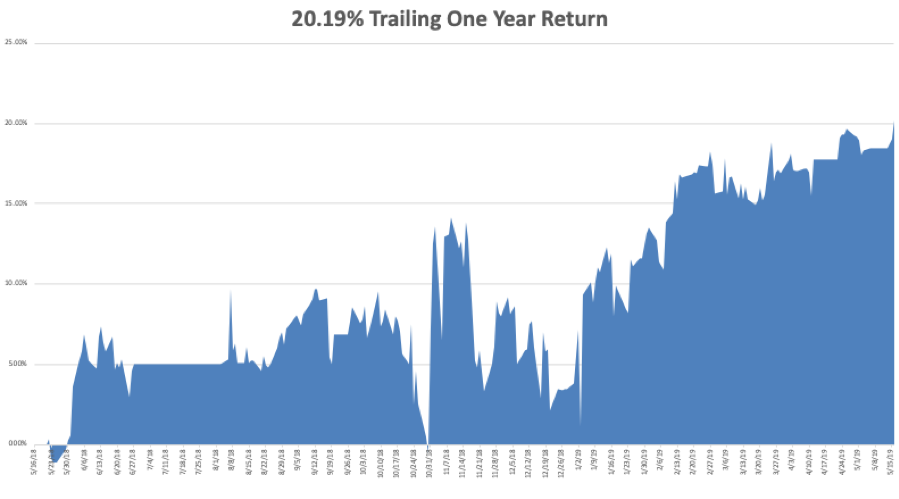
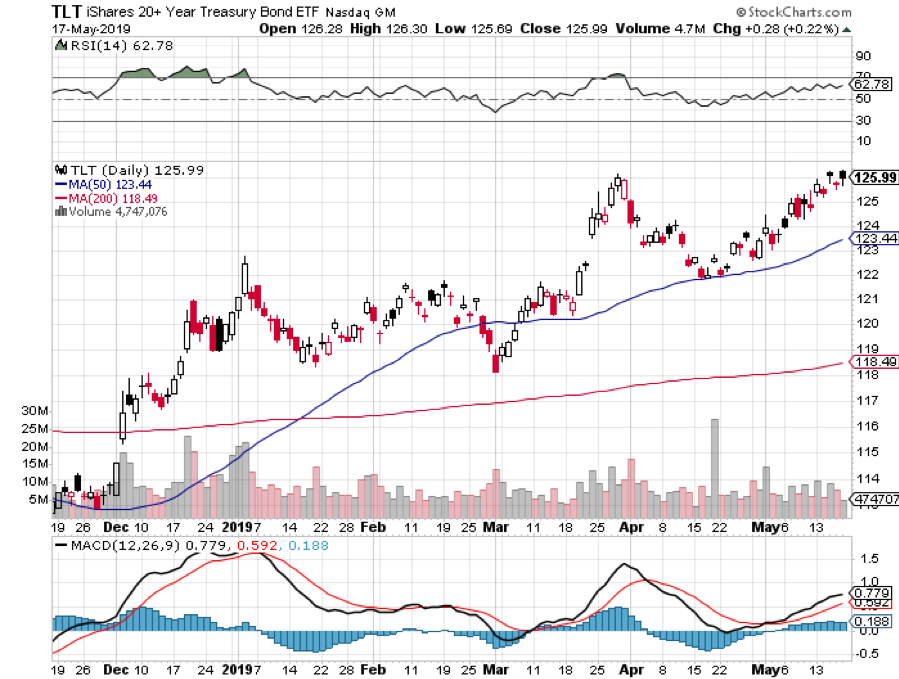
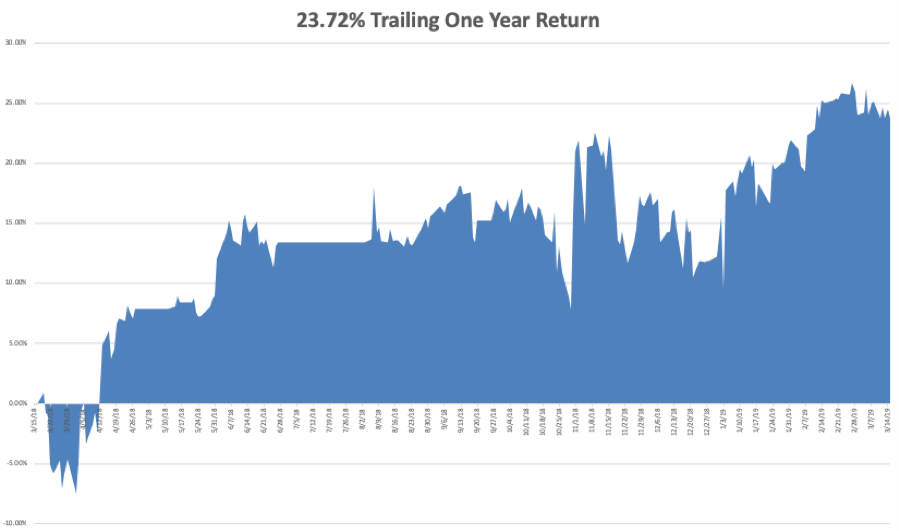
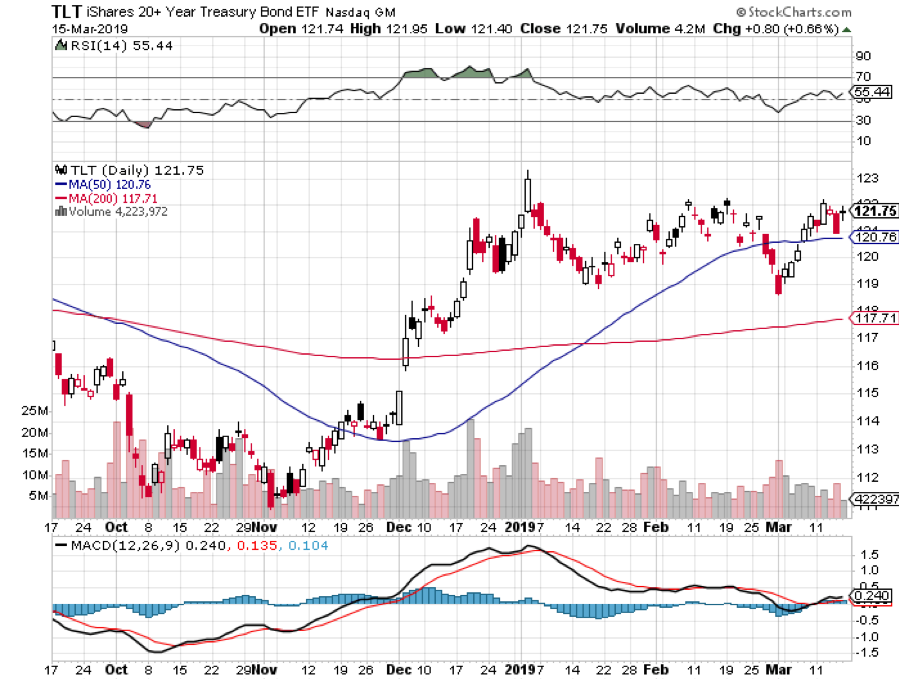
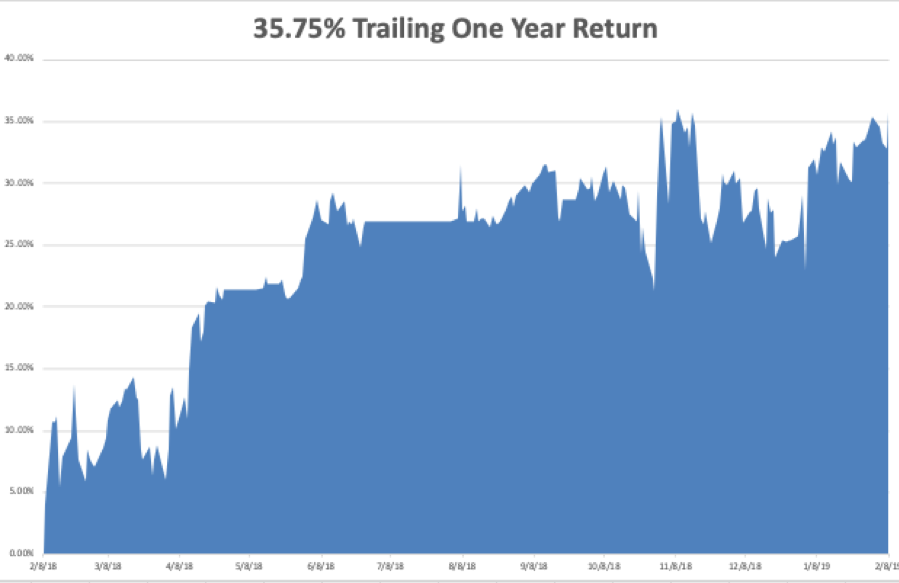
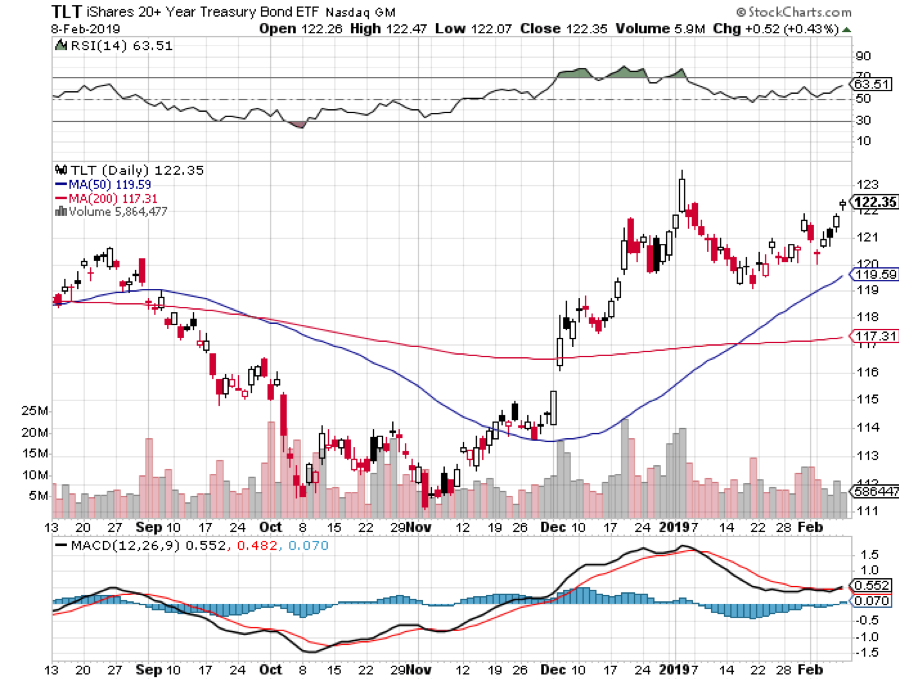
Global Trading Dispatch closed the week up 16.35% year to date and is up 0.63% so far in May. My trailing one-year rose to +20.19%. We jumped in and out of short positions in bonds (TLT) for a small profit, and our tech positions appreciated.
The Mad Hedge Technology Letter did OK, making some good money with a long position in Intuit (INTU) but stopping out for a small loss in Alphabet (GOOGL).
Some 10 out of 13 Mad Hedge Technology Letter round trips have been profitable this year.
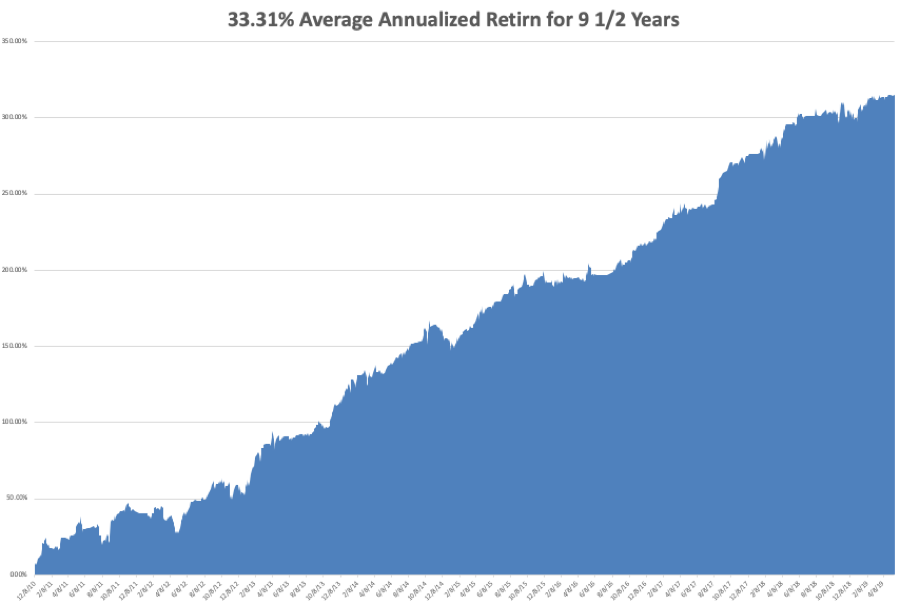
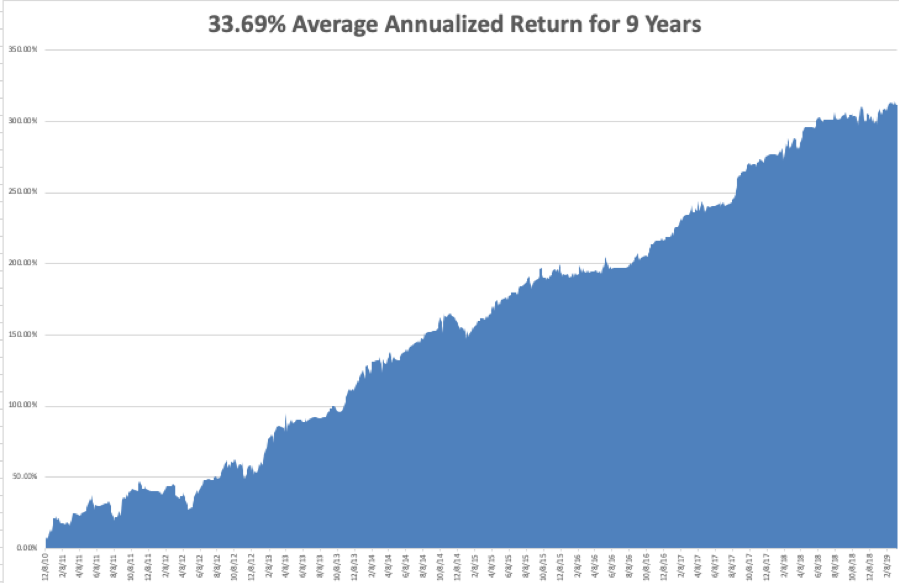
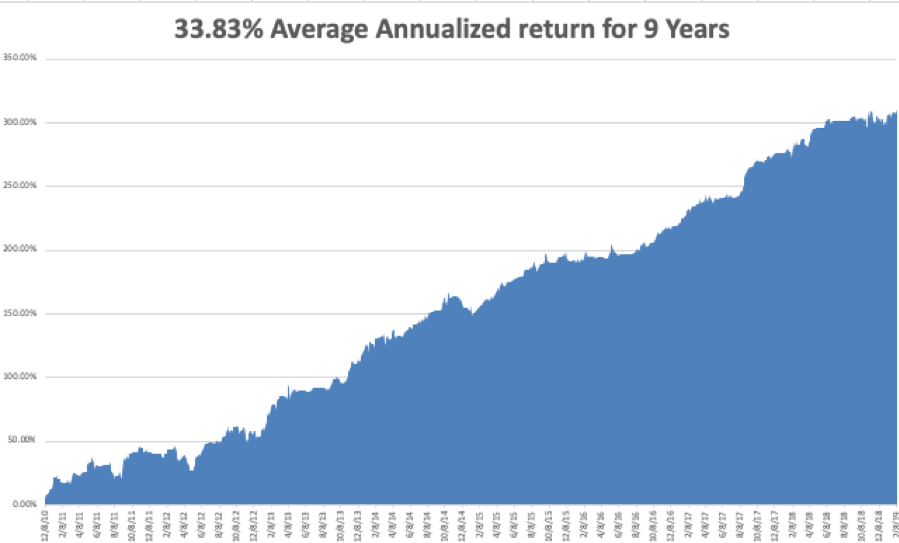
My nine and a half year profit jumped to +316.49%. The average annualized return popped to +33.21%. With the markets incredibly and dangerously volatile, I am now 80% in cash with Global Trading Dispatch and 80% cash in the Mad Hedge Tech Letter.
I’ll wait until the markets retest the bottom end of the recent range before considering another long position.
The coming week will see only one report of any real importance, the Fed Minutes on Wednesday afternoon. Q1 earnings are almost done.
On Monday, May 20 at 8:30 AM, the April Chicago Fed National Activity Index is out.
On Tuesday, May 21, 10:00 AM EST, the April Existing Home Sales is released. Home Depot (HD) announces earnings.
On Wednesday, May 22 at 2:00 PM, the minutes of the last FOMC Meeting are published. Lowes (LOW) announces earnings.
On Thursday, May 16 at 23 AM, Weekly Jobless Claims are published. Intuit (INTU) announces earnings.
On Friday, May 24 at 8:30 AM, April Durable Goods is announced.
As for me, I’ll be taking a carload of Boy Scouts to volunteer at the Oakland Food Bank to help distribute food to the poor and the homeless. Despite living in the richest and highest paid urban area in the world, some 20% of the population now lives on handouts, including many public employees and members of the military. It truly is a have, or have-not economy.
Good luck and good trading.
John Thomas
CEO & Publisher
The Diary of a Mad Hedge Fund Trader