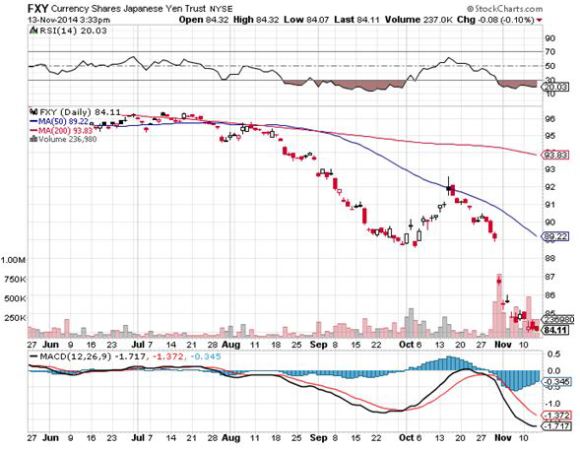
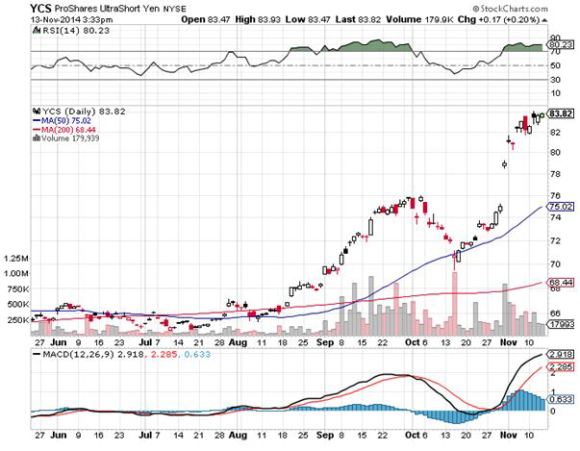
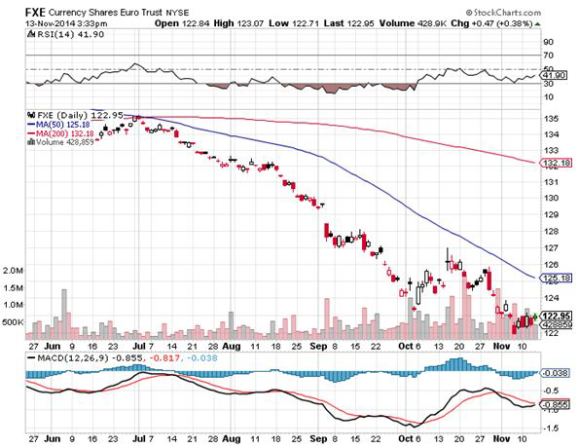
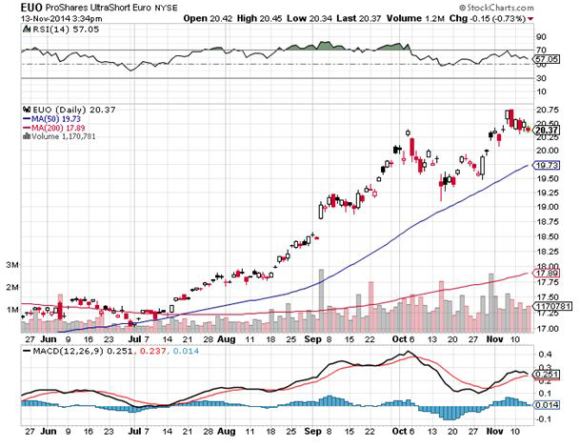
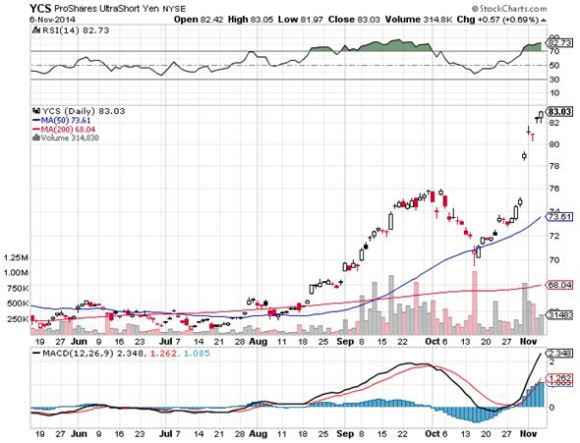
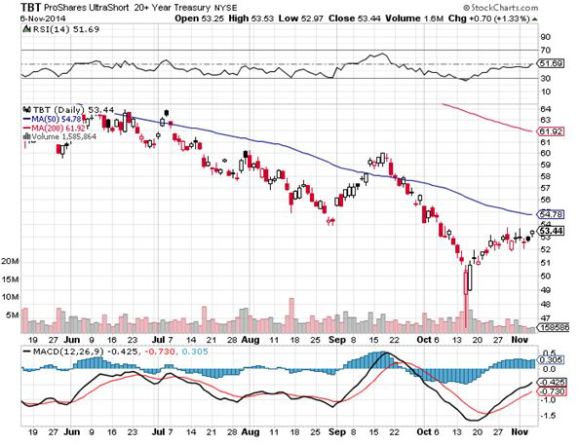
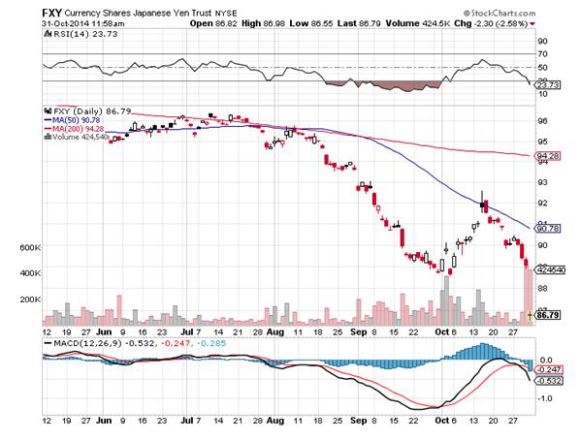
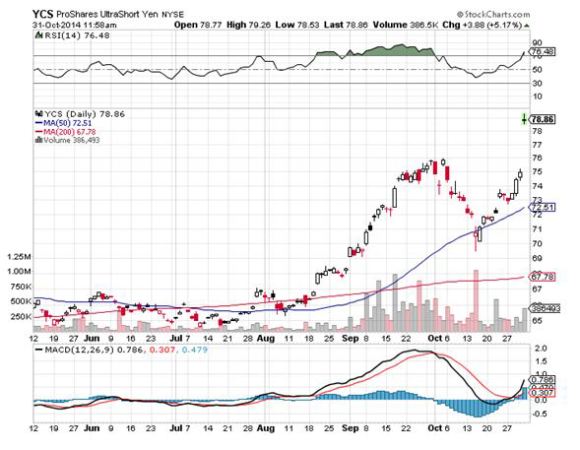
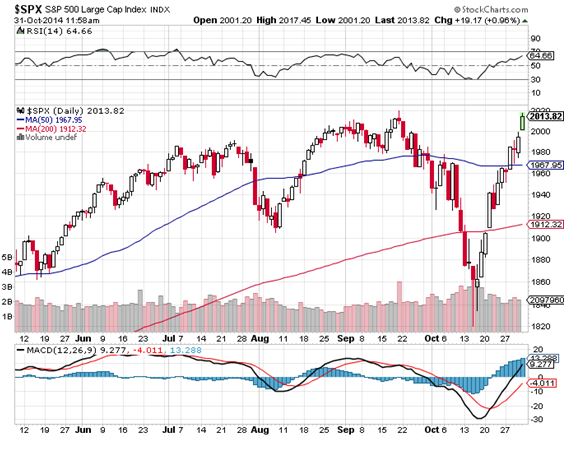
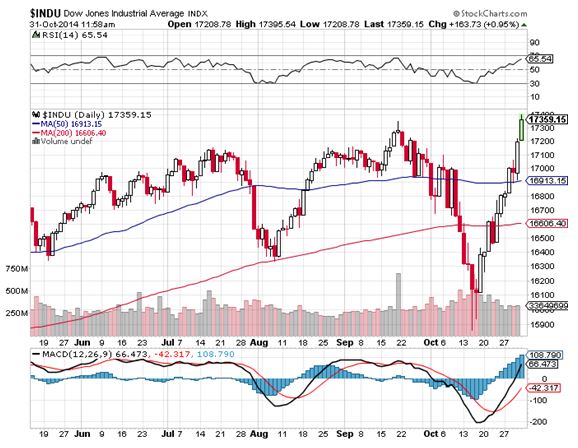
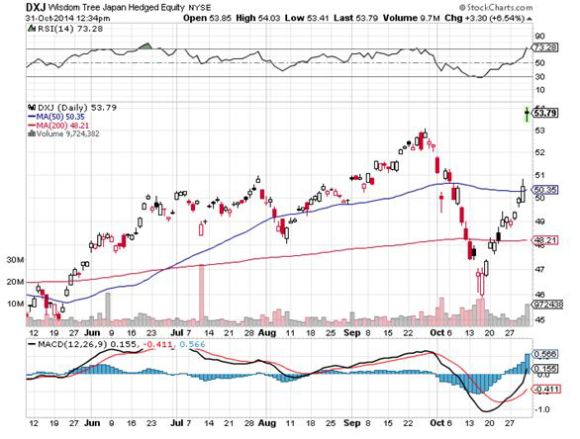
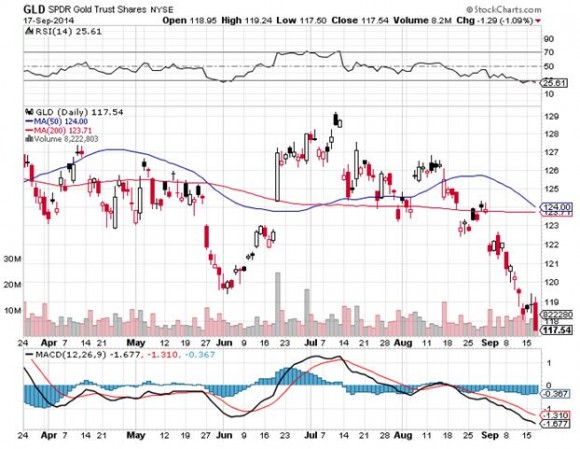
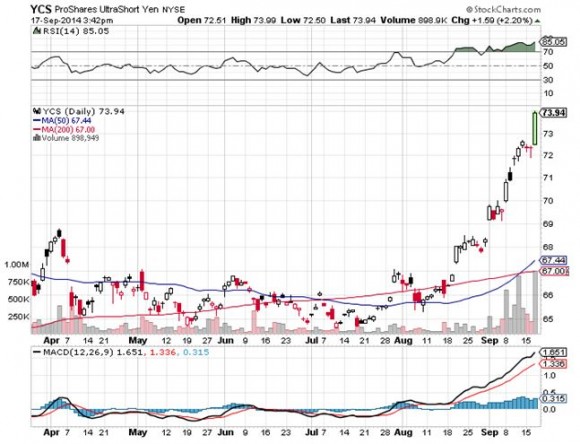
?Oh, how I despise the yen, let me count the ways.? I?m sure Shakespeare would have come up with a line of iambic pentameter similar to this if he were a foreign exchange trader. I firmly believe that a short position in the yen should be at the core of any hedged portfolio for the next decade.
To remind you why you hate the currency of the land of the rising sun, I?ll refresh your memory with this short list:
* With the world?s structurally weakest major economy, Japan is certain to be the last country to raise interest rates. Interest rate differentials are the greatest driver of foreign exchange rates. * This is inciting big hedge funds to borrow yen and sell it to finance longs in every other corner of the financial markets. * Japan has the world?s worst demographic outlook that assures its problems will only get worse. They?re not making enough Japanese any more. * The sovereign debt crisis in Europe is prompting investors to scan the horizon for the next troubled country. With gross debt well over a nosebleed 240% of GDP, or 120% when you net out inter agency crossholdings, Japan is at the top of the list. * The Japanese long bond market, with a yield of only 1%, is a disaster waiting to happen. * You have two willing co-conspirators in this trade, the Ministry of Finance and the Bank of Japan, who will move Mount Fuji if they must to get the yen down and bail out the country?s beleaguered exporters.
When the big turn inevitably comes, we?re going to ?110, then ?120, then ?150. That works out to a price of $200 for the (YCS), which last traded at $62. But it might take a few years to get there.
If you think this is extreme, let me remind you that when I first went to Japan in the early seventies, the yen was trading at ?305, and had just been revalued from the Peace Treaty Dodge line rate of ?360. To me the ?83 I see on my screen today is unbelievable. That would then give you a neat 17-year double top.
https://www.madhedgefundtrader.com/wp-content/uploads/2013/01/Japanese-Lady-Sad.jpg254250Mad Hedge Fund Traderhttps://madhedgefundtrader.com/wp-content/uploads/2019/05/cropped-mad-hedge-logo-transparent-192x192_f9578834168ba24df3eb53916a12c882.pngMad Hedge Fund Trader2014-08-27 01:03:422014-08-27 01:03:42The Party is Just Getting Started With the Japanese Yen
My former employer, The Economist, once the ever tolerant editor of my flabby, disjointed, and juvenile prose (Thanks Peter and Marjorie), has released its ?Big Mac? index of international currency valuations.
Although initially launched as a joke three decades ago, I have followed it religiously and found it an amazingly accurate predictor of future economic success. The index counts the cost of McDonald?s (MCD) premium sandwich around the world, ranging from $7.20 in Norway to $1.78 in Argentina, and comes up with a measure of currency under and over valuation.
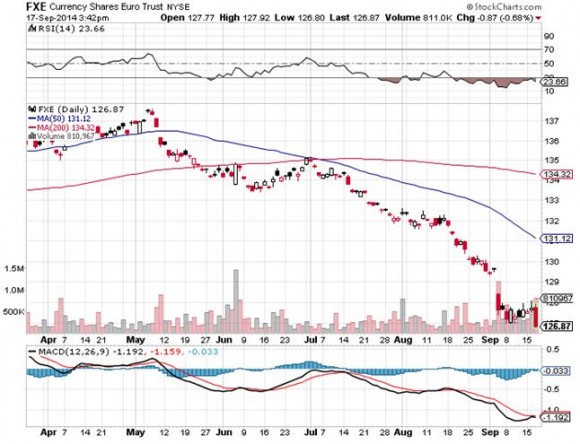
What are its conclusions today? The Swiss franc (FXF), the Brazilian real, and the Euro (FXE) are overvalued, while the Hong Kong dollar, the Chinese Yuan (CYB), and the Thai Baht are cheap. I couldn?t agree more with many of these conclusions. It?s as if the august weekly publication was tapping The Diary of the Mad Hedge Fund Trader for ideas. I am no longer the frequent consumer of Big Macs that I once was, as my metabolism has slowed to such an extent that in eating one, you might as well tape it to my ass. Better to use it as an economic forecasting tool, than a speedy lunch.
https://www.madhedgefundtrader.com/wp-content/uploads/2014/06/McDonalds-China-e1470951249636.jpg300400Mad Hedge Fund Traderhttps://madhedgefundtrader.com/wp-content/uploads/2019/05/cropped-mad-hedge-logo-transparent-192x192_f9578834168ba24df3eb53916a12c882.pngMad Hedge Fund Trader2014-06-25 01:05:032014-06-25 01:05:03Where The Economist ?Big Mac? Index Finds Currency Value
Take the easy money and run. No one every got fired for taking a profit. That?s the mood I was in when I came in and saw my long volatility ETF (VXX) spiking and my short in the S&P 500 (SPY) cratering. I sent out Trade Alerts immediately that took my model-trading portfolio into a rare 100% cash position.
The Volatility Index (VIX) is up a breakneck 35% in a week, while the ETF (VXX) has tacked on 11%. You don?t get such heart palpitating moves like this very often, especially when they are all going in your favor.
It helped that Mad Day Trader Jim Parker, rushed the chart below to me right after the opening showing that the NASDAQ 100, the chief whipping boy in this selloff, is becoming severely oversold and fast approaching a major area of support (the lime green line). Bonds (TLT) are stalling at $110.60, and the ?RISK OFF? move in the Japanese yen (FXY) is approaching the upper limit of its 2014 range.
This all adds up to the possibility that another one of those ?rip your face off? short covering rallies could be near.
The rule in this type of market is to take the quick profits. You especially want to date, and not marry, the (VXX), since the contango over time can cost you your shirt.
Trading on the short side is a totally different animal than traditional long side plays. It is much harder work, as shorts behave totally differently than longs. The movie is on fast forward and you must act quickly.
To be up 15.45% so far in 2014, a down year when most investors are tearing their hair out, and up a meteoric 7.89% in April, is nothing less than heroic. Eight out of my last ten Trade Alerts have been profitable. The email plaudits have already started pouring in. Now all your friends at the country club can hate you, but only if you followed my advice.
Let me tell you what I did right this week, so you can take a page from the playbook of the master.
1) I kept the positions small, so I could sleep at night
2) I did the hard trade, selling when everyone else loved this market
3) I took trading profits quickly
4) I ignored the talking heads on TV so I wouldn?t puke out at the bottom
5) I didn?t take the Princess cruise from San Francisco to Los Angeles, where 50 passengers and 25 crew came down with norovirus. Imagine getting sick before your get to Mexico.
Is it possible that I am improving with age? That I?m becoming a better trader as I get older? That the payoff for a 45-year accumulation of market experience keeps increasing? What a concept!
I don?t think this correction is over. Vladimir Putin can drop a bombshell on the markets at any time. We are going into the traditional May-October ?RISK OFF? seasonal with markets still very near all time highs. The midterm elections in November are introducing a new level of uncertainty. The IPO bubble continues unabated (there are seven today!), and will only end in tears.
And who knows when another cruise ship is going to come down with norovirus?
But nothing moves in a straight line. It?s time to move to the sidelines so I can reload on the short side after the next short covering rally exhausts itself.
As for me, I am going to spend the rest of the day writing checks to the US Treasury to pay taxes for myself, the numerous entities I control, and a gaggle of impoverished relatives. All American tax returns are due on Tuesday.
Then I?m going down to Union Square in San Francisco and buy myself a new Brioni pin stripe suit, another pair of Bruno Magli alligator skin shoes, and have a kir royal at the top of the Mark Hopkins Hotel, thankful for my good fortune that I can pay all these bills.
https://www.madhedgefundtrader.com/wp-content/uploads/2014/04/Burning-Building-e1430840521423.jpg308400Mad Hedge Fund Traderhttps://madhedgefundtrader.com/wp-content/uploads/2019/05/cropped-mad-hedge-logo-transparent-192x192_f9578834168ba24df3eb53916a12c882.pngMad Hedge Fund Trader2014-04-14 01:05:442014-04-14 01:05:44Cashing in on My Shorts
It was little after midnight west coast time when the Bank of Japan dropped its bombshell. It said it would refrain from stimulating the economy further to offset the deflationary effects of the VAT tax increase from 5% to 8%, which took effect on April 1.
Within seconds, the Japanese yen rocketed and never looked back. The Nikkei stock average crashed. Traders were stunned by the BOJ?s ill-timed move, as many GDP forecasts for the current quarter hover around the negative -1% level.
I held back on covering my yen short, waiting for a pullback. It was not to be, and I had to stop out with a small loss. Given the heightened level of anxiety in the markets since last week, I don?t have to be told twice to unload a ?RISK ON? position.
I am in the fortunate position in that I can offset this loss with the major gains I made on my short S&P 500 (SPY) and Russell 2000 (IWM) positions. This is why the word ?Hedge? is in the name ?Mad Hedge Fund Trader.?
However, the central bank said it would stick with its current plan to increase the money supply by 60-70 trillion yen per year for the next two years. One of Japan?s confidence indicators fell to the lowest level since 2011. The government is said to be mulling over a further VAT tax hike to 10%. So don?t count on the central bank to stick to the hard line for very long.
Many think that this is just a speed bump on Japan?s road to economic recovery, and that more stimulus is on its way in July, once the magnitude of the current slowdown is indisputable. This could just be another case of central banks slow to adapt to reality, as they are often wont to do.
?Oh, how I despise the yen, let me count the ways.? I?m sure Shakespeare would have come up with a line of iambic pentameter similar to this if he were a foreign exchange trader. I firmly believe that a short position in the yen should be at the core of any hedged portfolio for the next decade.
To remind you why you hate the currency of the land of the rising sun, I?ll refresh your memory with this short list:
* With the world?s structurally weakest major economy, Japan is certain to be the last country to raise interest rates. Interest rate differentials are the greatest driver of foreign exchange rates.
* This is inciting big hedge funds to borrow yen and sell it to finance longs in every other corner of the financial markets.
* Japan has the world?s worst demographic outlook that assures its problems will only get worse. They?re not making enough Japanese any more.
* The sovereign debt crisis in Europe is prompting investors to scan the horizon for the next troubled country. With gross debt well over a nosebleed 240% of GDP, or 120% when you net out inter agency crossholdings, Japan is at the top of the list.
* The Japanese long bond market, with a yield of only 0.61%, is a disaster waiting to happen.
* You have two willing co-conspirators in this trade, the Ministry of Finance and the Bank of Japan, who will move Mount Fuji if they must to get the yen down and bail out the country?s beleaguered exporters.
When the big turn inevitably comes, we?re going to ?110, then ?120, then ?150. That works out to a price of $200 for the (YCS), which last traded at $65. But it might take a few years to get there.
If you think this is extreme, let me remind you that when I first went to Japan in the early seventies, the yen was trading at ?305, and had just been revalued from the Peace Treaty Dodge line rate of ?360. To me the ?83 I see on my screen today is unbelievable. That would then give you a neat 17-year double top.
https://www.madhedgefundtrader.com/wp-content/uploads/2014/04/Japanese-Lady-Sad-e1400531413320.jpg324319Mad Hedge Fund Traderhttps://madhedgefundtrader.com/wp-content/uploads/2019/05/cropped-mad-hedge-logo-transparent-192x192_f9578834168ba24df3eb53916a12c882.pngMad Hedge Fund Trader2014-04-09 01:04:092014-04-09 01:04:09BOJ Bombshell Hits Yen Sellers in the Shorts
Mad Day Trader, Jim Parker, thinks that the next three to six months will be a tough time for the financial markets. They won?t crash, but won?t break out to new highs either.
Instead, they will stay confined to technically driven, narrow, low volume ranges that will cause traders to tear their hair out. It will be an environment where it will be tough for anyone to make money. The long only crowd will be particularly challenged. Better to take your summer vacation early this year, and make it a long one.
Jim uses a dozen proprietary short-term technical and momentum indicators to generate buy and sell signals, which he has developed over 40 years of trading in the Chicago futures markets. Last year Jim?s Trade Alerts generated returns for followers well into triple digits. He absolutely nailed the performance of every asset class this year in his Q1 Medium Term Outlook (click here for the link at http://madhedgefundradio.com/january-2-2014-mdt-medium-term-outlook-1st-qtr-2014/ . Ignore him at your peril.
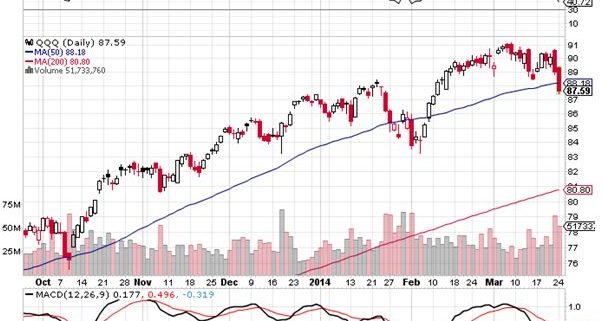
Parker has been using NASDAQ (QQQ) as his lead contract for 2014. When it rolled over two weeks ago, it broke momentum across asset classes. Look no further than the biotech area, formerly the hottest in the market. It?s dramatic, sudden reversal, along with the losses seen in other speculative names, like Tesla (TSLA), Netflix (NFLX), and Herbalife (HLF), indicate that the easy money is gone.
The big confirming move for this cautious stance has been in the Treasury bond market (TLT). Its failure to break down has amazed many strategists. Instead of the ten-year bond yield exploding to a 3.05% yield as expected, it ran all the way down to 2.58%. This was the tell that the bull markets days were numbered. Bond prices are now threatening to break to new highs, taking yields to 2.50% or lower.
The other clue to the behavior of this years markets has been the Japanese yen. While the yen was plunging, stocks and other risk assets soared. That came to an abrupt halt on the last trading day of 2013. Notice that since then, the major stock indexes have not been able to hold on to any gains whatsoever.
This is because traders borrow, and then sell the Japanese currency, to fund any new positions. A flat lining yen means that risk taking has ceased, and that?s exactly what we have seen so far in 2014.
It won?t always be this bad. A long period digesting the meteoric gains of the past two and five years could be followed by a bang up fourth quarter, much like we saw in 2013. The key to success will be not to lose all your money before then.
Here is Jim?s Q2 forecast for each major asset class:
Stocks ? The leadership of NASDAQ is dead and buried for now. Don?t go back in until it closes above 3,745 and holds it. The same is true for the S&P 500 (SPX), which must surpass 1,880 to buy.
Bonds ? It?s alright to hold them here (TLT). If we break the years high at $109.60, it could race up to $114. At that point get out, as risk will be high.
Foreign Currencies - $139.50 has got to be the top in the Euro (FXE). As long as the yen (FXY) is comatose, he doesn?t want to touch it. You want to buy the Australia dollar (FXA) on a break above $91.50. Until then, it will remain trapped in an $88.50-$91.50 range.
Commodities ? The fireworks are over for now for oil. We need some digestion of the $15 move from $92 before we can revisit the upside. Hands off, until we break above $101.50. Copper (CU) is at the bottom of an extended range. You would be nuts to go short here, unless of course, we slice through $2.95.
Precious Metals ? Gold (GLD), (GDX) is toast. To see the sell off accelerate when geopolitical risk remains high has to be especially disheartening for the bulls. A retest of the $1,265 low, then $1,180 is in the cards. Unless you went short the barbarous relic the day it peaked last week, avoid.
Agricultural ? Jim called the bottom on this one (DBA), (CORN) at the New Year. Since then, the ags have raced to an intermediate high. The Crimea crisis gave it an added boost. His long side targets for soybeans (SOYB) have all been hit.? Nothing to do here, unless the weather suddenly turns bad.
While the Diary of a Mad Hedge Fund Trader and Global Trading Dispatch focus on investment over a one week to six-month time frame, Mad Day Trader will exploit moneymaking opportunities over a ten minute to three-day window. It is ideally suited for day traders, but can also be used by long-term investors to improve market timing for entry and exit points. During normal trading conditions, you should receive two to five market updates and Trade Alerts a day.
As with our existing service, you will receive ticker symbols, entry and exit points, targets, stop losses, and regular real time updates. At the end of each day, a separate short-term model portfolio will be posted on the website.
Jim is a 40-year veteran of the financial markets and has long made a living as an independent trader in the pits at the Chicago Mercantile Exchange. He has worked his way up from a junior floor runner, to advisor to some of the world?s largest hedge funds. We are lucky to have him on our team and gain access to his experience, knowledge, and expertise.
I have been following his alerts for the past five years, and his market timing has become an important part of the ?unfair advantage? that I provide readers.
A trading service with this degree of success and sophistication normally costs $20,000 a year. As a client of The Mad Hedge Fund Trader, you can purchase Mad Day Trader alone for $699 a quarter, or $2,000 a year. Or you can buy it as a package together with Global Trading Dispatch, which we call Mad Hedge Fund Trader PRO, for $4,000 a year, a 20% discount to the full retail price.
If you want to get a pro rata upgrade from your existing Newsletter or Global Trading Dispatch subscription to Mad Hedge Fund Trader Pro, which includes Mad Day Trader, just email Nancy in customer support at support@madhedgefundtrader.com.
https://www.madhedgefundtrader.com/wp-content/uploads/2014/03/QQQ-3-24-14.jpg467605Mad Hedge Fund Traderhttps://madhedgefundtrader.com/wp-content/uploads/2019/05/cropped-mad-hedge-logo-transparent-192x192_f9578834168ba24df3eb53916a12c882.pngMad Hedge Fund Trader2014-03-25 01:03:162014-03-25 01:03:16Heed the Mad Day Trader?s Q2 Forecasts
Bad China data?.Russia threatens the Ukraine?.more bad China data?.maneuvers at the Russia-Crimea border. The bull has been punched out with a market that was down every day last week, China and Russia both taking turns thrashing investors, like tag team wrestlers. When will it end?
The canaries in the coal mine will be found in the charts below. This is where you will first hear the all-clear signal, when it is safe to return with an aggressive ?RISK ON? posture.
As always, watch the bond market. If the current rally in the (TLT) fails anywhere short of $110, it?s a sign that traders are fleeing the safety of the Treasury bond market and are happy to return to riskier assets, like equities. That equates to a ten year Treasury bond yield of just over 2.50%. A breakout of prices above this, and yields below suggest that more trouble is coming.
Keep close tabs on the Chinese Yuan (CYB). After an unrelenting five-year appreciation, it started a swan dive two weeks ago. That is when a banking crises in the Middle Kingdom started picking up steam. This prompted currency traders to unload Chinese renminbi for more stable dollars. The collapse of copper mirrors this. New signs of life in the Yuan and copper will hint that trouble there is over for now.
The Japanese yen is another big one to monitor. Most hedge funds borrow yen and sell them to finance long positions around the world. This is why the yen has been perennially week for the past two years. But when they dump these positions and hide under their beds, the reverse happens.
They buy back their yen shorts, pushing it up. That?s why the latest round of jitters has the Japanese currency probing four-month highs. If the yen fails here, it?s because investors are going back into the market for other assets.
Of course, the Russian stock market (RSX) is a no brainer to watch. Thanks to the antics of Vladimir Putin, it is down 28% so far in 2014, making it the world?s worst performing market this year. Invading your neighbors and threatening to incite WWIII is not good for your equities. I doubt he cares, but emerging market investors do.
Gold (GLD) is certainly earning its pay as a flight to safety instrument. It has been flying like a bat out of hell all year and is now testing major resistance. If the barbarous relic suddenly loses its luster, the memo will go out to buy paper assets once more.
Finally, keep the chart for the Volatility Index (VIX) planted on the top of your screen. Recent tops have been around the $21 level, only $3 higher than the current level. When cooler heads prevail, the (VIX) will collapse once again. Puts on the (VXX) are the way to play this move.
The interesting thing about these charts is that they are all moving to the extreme edges of multi month ranges. So we could be one more flush away from the end of this move.
That?s unless Russia really does invade Crimea in force. Then all bets are off.
https://www.madhedgefundtrader.com/wp-content/uploads/2014/03/Atomic-Bomb.jpg334447Mad Hedge Fund Traderhttps://madhedgefundtrader.com/wp-content/uploads/2019/05/cropped-mad-hedge-logo-transparent-192x192_f9578834168ba24df3eb53916a12c882.pngMad Hedge Fund Trader2014-03-17 01:04:512014-03-17 01:04:51Charts to Watch For an End to the Crisis
I believe that the global economy is setting up for a new golden age reminiscent of the one the United States enjoyed during the 1950?s, and which I still remember fondly.
This is not some pie in the sky prediction. It simply assumes a continuation of existing trends in demographics, technology, politics, and economics. The implications for your investment portfolio will be huge.
What I call ?intergenerational arbitrage? will be the principal impetus. The main reason that we are now enduring two ?lost decades? is that 80 million baby boomers are retiring to be followed by only 65 million ?gen Xer?s.
When the majority of the population is in retirement mode, it means that there are fewer buyers of real estate, home appliances, and ?RISK ON? assets like equities, and more buyers of assisted living facilities, health care, and ?RISK OFF? assets like bonds.
The net result of this is slower economic growth, higher budget deficits, a weak currency, and registered investment advisors who have distilled their practices down to only municipal bond sales.
Fast forward ten years when the reverse happens and the baby boomers are out of the economy, worried about whether their diapers get changed on time or if their favorite flavor of Ensure is in stock at the nursing home. That is when you have 65 million gen Xer?s being chased by 85 million of the following ?millennial? generation trying to buy their assets.
By then we will not have built new homes in appreciable numbers for 20 years and a severe scarcity of housing hits. Residential real estate prices will soar. Labor shortages will force wage hikes. The middle class standard of living will reverse a then 40-year decline. Annual GDP growth will return from the current subdued 2% rate to near the torrid 4% seen during the 1990?s.
The stock market rockets in this scenario. Share prices may rise gradually for the rest of the teens as long as growth stagnates. A 5% annual gain takes the Dow to 20,000 by 2020. After that, we could see the same fourfold return we saw during the Clinton administration, taking the Dow to 80,000 by 2030. Emerging stock markets (EEM) with much higher growth rates do far better.
This is not just a demographic story. The next 20 years should bring a fundamental restructuring of our energy infrastructure as well. The 100-year supply of natural gas (UNG) we have recently discovered through the new ?fracking? and horizontal drilling technology will finally make it to end users, replacing coal (KOL) and oil (USO).
Fracking applied to oilfields is also unlocking vast new supplies. That?s why oil is now $70 a barrel in North Dakota versus $95 in Oklahoma 1,000 miles to the South.
Since 1995, the US Geological Survey estimate of recoverable reserves has ballooned from 150 million barrels to 8 billion. OPEC?s share of global reserves is collapsing. This is all happening while automobile efficiencies are rapidly improving and the use of public transportation soars.? Mileage for the average US car has jumped from 23 to 24.7 miles per gallon in the last couple of years. Total gasoline consumption is now at a five year low.
Alternative energy technologies will also contribute in an important way in states like California, accounting for 30% of total electric power generation. I now have an all-electric garage, with a Nissan Leaf (NSANY) for local errands and a Tesla S-1 (TSLA) for longer trips, allowing me to disappear from the gasoline market completely. Millions will follow. The net result of all of this is lower energy prices for everyone.
It will also flip the US from a net importer to an exporter of energy, with hugely positive implications for America?s balance of payments. Eliminating our largest import and adding an important export is very dollar bullish for the long term. That sets up a multiyear short for the world?s big energy consuming currencies, especially the Japanese yen (FXY) and the Euro (FXE). A strong greenback further reinforces the bull case for stocks.
Accelerating technology will bring another continuing positive. Of course, it?s great to have new toys to play with on the weekends, send out Facebook photos to the family, and edit your own home videos. But at the enterprise level this is enabling speedy improvements in productivity that is filtering down to every business in the US.
This is why corporate earnings have been outperforming the economy as a whole by a large margin. Profit margins are at an all time high. Living near booming Silicon Valley, I can tell you that there are thousands of new technologies and business models that you have never heard of under development. When the winners emerge they will have a big cross-leveraged effect on economy.
New health care breakthroughs will make serious disease a thing of the past, which are also being spearheaded in the San Francisco Bay area. This is because the Golden State thumbed its nose at the federal government ten years ago when the stem cell research ban was implemented. It raised $3 billion through a bond issue to fund its own research, even though it couldn?t afford it.
I tell my kids they will never be afflicted by my maladies. When they get cancer in 40 years they will just go down to Wal-Mart and buy a bottle of cancer pills for $5, and it will be gone by Friday. What is this worth to the global economy? Oh, about $2 trillion a year, or 4% of GDP. Who is overwhelmingly in the driver?s seat on these innovations? The USA.
There is a political element to the new Golden Age as well. Gridlock in Washington can?t last forever. Eventually, one side or another will prevail with a clear majority. This will allow them to push through needed long-term structural reforms, the solution of which everyone agrees on now, but nobody wants to be blamed for.
That means raising the retirement age from 66 to 70 where it belongs, and means testing recipients. Billionaires don?t need the $30,156 annual retirement supplement. Nor do I.
The ending of our foreign wars and the elimination of extravagant unneeded weapons systems cuts defense spending from $800 billion a year to $400 billion, or back to the 2000, pre-9/11 level. Guess what happens when we cut defense spending? So does everyone else.
I can tell you from personal experience that staying friendly with someone is far cheaper than blowing them up. A Pax Americana would ensue. That means China will have to defend its own oil supply, instead of relying on us to do it for them. That?s why they?re in the market for a second used aircraft carrier.
Medicare also needs to be reformed. How is it that the world?s most efficient economy has the least efficient health care system? This is going to be a decade long workout and I can?t guess how it will end. Raise the growth rate and trim back the government?s participation in the credit markets, and you make the numerous miracles above more likely.
The national debt comes under control, and we don?t end up like Greece. The long awaited Treasury bond (TLT) crash never happens. Ben Bernanke has already told us as much by indicating that the Federal Reserve may never unwind its massive $3.5 trillion in bond holdings.
Sure, this is all very long-term, over the horizon stuff. You can expect the financial markets to start discounting a few years hence, even though the main drivers won?t kick in for another decade. But some individual industries and companies will start to discount this rosy scenario now. Perhaps this is what the nonstop rally in stocks in 2013 was trying to tell us.
https://www.madhedgefundtrader.com/wp-content/uploads/2012/03/thunderbird_1.jpg230300Mad Hedge Fund Traderhttps://madhedgefundtrader.com/wp-content/uploads/2019/05/cropped-mad-hedge-logo-transparent-192x192_f9578834168ba24df3eb53916a12c882.pngMad Hedge Fund Trader2014-02-12 01:03:292014-02-12 01:03:29Get Ready for the Next Golden Age
I wrote at length yesterday about why this is not a new bear market, but a traditional 7%-10% correction instead. Now, I?ll show you three charts that will call the exact turnaround.
The ten-year Treasury bond (TLT), (TBT) is clearly the lead contract. It has, far and away, been the most accurate in anticipating the future direction of all asset classes. Get this one right, and everything else falls into line.
Take a look at the chart for the (TLT) below, which has clearly broken the 200 day moving average. I think that this is a false breakout, and that we are not trading in a new $108-$112 trading range that prevailed last spring. Note that while the 200-day average is busted, the 200-week is still putting up fierce resistance. This may well be the line in the sand that counts.
Next, take a look at the chart for the Japanese yen (FXY), (YCS). This is crucial because the yen is the world?s funding currency, thanks to its zero interest rates. When traders are in ?RISK OFF? MODE, they dump their positions in all asset classes and buy yen to repay their broker loans. This forces the yen to appreciate against the US dollar, something the Japanese government is loathe to seeing. This occurs on a scale of trillions of dollars.
When investors throw caution to the wind and pile back into ?RISK ON? portfolios, the reverse happens. They borrow yen and sell them to finance new positions, sending the yen down. Weakness in the yen is therefore the first place you will see a recovery in global markets.
The yen chart bellows shows that it is taking a run at its 200 day moving average at $97.91. That is only $1.70 up from here, and in line with ?100 to the dollar in the cash market, another important resistance level.
My expectation is that the yen will fail here and return to its longer-term downtrend, bringing a major 6% rally against the greenback to an end. That will send a great flashing green light to traders that the buyers strike is over and that its time to get back to work.
You see a very similar inverse chart with the S&P 500 (SPX). The bottom here also appears to be the 200 day moving average at 1,708, a mere 32 points below today?s low. That is only one bad day away. Watch for a rally from here to trigger simultaneous sell offs in the Treasury bond and yen markets.
You can play this game all day long. A confirming move of a top in interest rates would be a big rally in bank shares, which need higher interest rates to make more money. So keep a laser focus on Bank of America (BAC) and Citigroup (C). At the same time, gold (GLD) will once again get thrown out with the trash, since higher rates punish holders here with a greater opportunity cost.
This all may happen sooner than you think. The Friday January nonfarm payroll neatly sets up a double top in the volatility index at $21. Get a good number, like over 200,000, and see substantial back month revisions up, and volatility will collapse back to the mid teens. Everything else I described above will come to pass.
However, I won?t find out what transpired until Saturday. When the Department of Labor releases the anxiously awaited report, I should be fast asleep in my first class cabin somewhere over French Polynesia on my way to New Zealand. Send me an email on what happens.
https://www.madhedgefundtrader.com/wp-content/uploads/2014/02/Hula-Girls.jpg269409Mad Hedge Fund Traderhttps://madhedgefundtrader.com/wp-content/uploads/2019/05/cropped-mad-hedge-logo-transparent-192x192_f9578834168ba24df3eb53916a12c882.pngMad Hedge Fund Trader2014-02-05 01:05:332014-02-05 01:05:33Three Charts That Will Turn the Markets
I can?t believe how fast the year has gone by. It seems like only yesterday that I was riding the transcontinental railroad from Chicago to San Francisco, writing my 2013 All Asset Class Review. Now 2014 is at our doorstep.
As usual, the market has got it all wrong. There is not going to be a taper by the Federal Reserve next week. If there is, it will be only $5-$10 billion, which means that $70-$75 billion a month in Fed bond buying continues. Either way it is a win-win.
However, managers are eternally loath to trade against an unknown, hence the weakness we are seeing this week. I think that we have entered another one of those sideways corrections that has been a hallmark of the market all year, and that there is a reasonable chance that we saw the low of the entire move down this morning at 1,780 in the S&P 500.
That sets up a dead, range trading market into the Fed decision next Wednesday afternoon. Once their Solomon like choice is out, it will be off to the races for the markets once again, probably all the way until 2014.
However, we are heading in the Christmas holidays, when volume and volatility shrivel to a shadow of its former selves, with daily ranges often falling within 50 Dow points. So it is important to have a large short volatility element to your portfolio.
That way, you will make money on every flat day, of which there should be many. That?s why I have 70% of my current model-trading portfolio invested in call spreads.
My current holding in the (SPY) has me profitable at all points above $175.68. If we move below that, any losses should be more than offset by profits thrown off by the rest of the portfolio. The same is true for my call spread in the financial ETF (XLF).
The Japanese yen is clearly in free fall, probing new lows almost every day. That should take the (FXY) to $95, and explains my triple weight 30% holding in the area. Bonds (TLT) just can?t get a break, failing to rally over $105 for the third time. Lower levels beckon, making my bear put spread look pretty good, my second one this month.
With a dramatically weakening yen, you have to add to Japanese equities, which will benefit hugely. That?s why I doubled up on my position in Masayoshi Son?s Softbank (SFTBY) this morning. The day they announce the Ailibaba IPO, probably early next year, these shares should be up 10%-20%.
To summarize, this portfolio is perfectly set up for the following: ?A sideways move for four more trading days, then an upside breakout after the Fed decision, then going to sleep inside a slow grind up over Christmas and New Years.
The grand finale should come on January 2, the first trading day of 2014, when I expect the value of the portfolio to pop a full 5% or more. This will be delivered by a massive new wave of capital into the markets, which for calendar and legal reasons couldn?t be invested until this day.
What will they buy? Everything that worked last year. After all, that?s why these managers were hired. Why not start the New Year with a bang, and then spend the rest of the year trading against that profit.
https://www.madhedgefundtrader.com/wp-content/uploads/2013/01/Zephyr.jpg342451Mad Hedge Fund Traderhttps://madhedgefundtrader.com/wp-content/uploads/2019/05/cropped-mad-hedge-logo-transparent-192x192_f9578834168ba24df3eb53916a12c882.pngMad Hedge Fund Trader2013-12-13 01:05:282013-12-13 01:05:28My Market Take for the Rest of 2014
The big talk in the financial markets this year was of the ?Great Reallocation? out of bonds and into stocks.? The problem is that it was just that: talk. While redemptions of retail bond mutual funds have topped $147 billion since June, the big money has yet to move in size.
However, there is a great reallocation that is already well under way. In fact, it already completed its first leg earlier this year, and has just begun the second. That is the ?Great Reallocation? out of yen (FXY), (YCS) and into the dollar. It is being executed not only by Japanese institutional investors, but foreign ones as well.
Take a look at the chart below, and you will see that the beleaguered Japanese currency broke to a new four year low this morning. Nothing like a jolt of fresh (FXY) to wake you up first thing in the day, and clear out those cobwebs.
This freefall was on the heels of my doubling up of my yen short positions for my model-trading portfolio with my Trade Alert on Black Friday. The (FXY), now trading at $94.80, is clearly targeting the $90 low set in 2008 for the short term, and after that, the $81 low last seen in 2007.
To understand why this is happening, take a look at this from the point of view of the Japanese money manager, who is running the world?s second largest pool of investable assets, after the US. After a 23-year performance drought, you have just had one of your best years in history.
The Nikkei rocketed by 48%. Better yet, the yen has fallen by 16% against the dollar, which directly translates into an equivalent increase on your foreign investments.
Why not visit the well a second time? Why wait until 2014, when everyone else is going to do the same thing again? In fact, why not drink twice as much this time, as the water is so sweet? What is the conclusion of all of this? Sell more yen, and lots of them. That was what I clearly saw unfolding a month ago. This is why you are making so much money now.
This explains why I have been running big shorts in the yen for almost all of the last two years, doubling up, taking profits, and then doubling up again. I have no doubt that when I total up my numbers for 2014, the yen will pop out as my most profitable trade. Domo Arigato Abe-san!
As for the original ?Great Reallocation? from bonds to stocks, take a look at the chart of Treasury bond futures below lifted from the Gartman Report, reproduced from my friend, Dennis Gartman. Veteran traders will immediately recognize the ?head and shoulders top? that is unfolding in the US Treasury bond market. This is the chart that promises of great things to come in the bond market in 2014?.on the downside.
https://www.madhedgefundtrader.com/wp-content/uploads/2013/11/Woman-Hari-Kari.jpg280396Mad Hedge Fund Traderhttps://madhedgefundtrader.com/wp-content/uploads/2019/05/cropped-mad-hedge-logo-transparent-192x192_f9578834168ba24df3eb53916a12c882.pngMad Hedge Fund Trader2013-12-03 09:25:062013-12-03 09:25:06That Other ?Great Reallocation? Out of the Yen
Legal Disclaimer
There is a very high degree of risk involved in trading. Past results are not indicative of future returns. MadHedgeFundTrader.com and all individuals affiliated with this site assume no responsibilities for your trading and investment results. The indicators, strategies, columns, articles and all other features are for educational purposes only and should not be construed as investment advice. Information for futures trading observations are obtained from sources believed to be reliable, but we do not warrant its completeness or accuracy, or warrant any results from the use of the information. Your use of the trading observations is entirely at your own risk and it is your sole responsibility to evaluate the accuracy, completeness and usefulness of the information. You must assess the risk of any trade with your broker and make your own independent decisions regarding any securities mentioned herein. Affiliates of MadHedgeFundTrader.com may have a position or effect transactions in the securities described herein (or options thereon) and/or otherwise employ trading strategies that may be consistent or inconsistent with the provided strategies.
We may request cookies to be set on your device. We use cookies to let us know when you visit our websites, how you interact with us, to enrich your user experience, and to customize your relationship with our website.
Click on the different category headings to find out more. You can also change some of your preferences. Note that blocking some types of cookies may impact your experience on our websites and the services we are able to offer.
Essential Website Cookies
These cookies are strictly necessary to provide you with services available through our website and to use some of its features.
Because these cookies are strictly necessary to deliver the website, refuseing them will have impact how our site functions. You always can block or delete cookies by changing your browser settings and force blocking all cookies on this website. But this will always prompt you to accept/refuse cookies when revisiting our site.
We fully respect if you want to refuse cookies but to avoid asking you again and again kindly allow us to store a cookie for that. You are free to opt out any time or opt in for other cookies to get a better experience. If you refuse cookies we will remove all set cookies in our domain.
We provide you with a list of stored cookies on your computer in our domain so you can check what we stored. Due to security reasons we are not able to show or modify cookies from other domains. You can check these in your browser security settings.
Google Analytics Cookies
These cookies collect information that is used either in aggregate form to help us understand how our website is being used or how effective our marketing campaigns are, or to help us customize our website and application for you in order to enhance your experience.
If you do not want that we track your visist to our site you can disable tracking in your browser here:
Other external services
We also use different external services like Google Webfonts, Google Maps, and external Video providers. Since these providers may collect personal data like your IP address we allow you to block them here. Please be aware that this might heavily reduce the functionality and appearance of our site. Changes will take effect once you reload the page.