When Elon Musk personally invited me to tour his Gigafactory in Sparks, Nevada, I thought, “How could I pass on this?” He had read my recent report on Tesla and thought the more I know about Tesla the better.
I couldn’t agree more.
As I approached the remote facility 20 miles east of Reno, I spotted a herd of wild Mustangs on the red volcanic hills above. I thought it was a great metaphor for our rapidly evolving transportation system, from horse to all-electric in 100 years.
There are no signs to the Gigafactory until you approach the main gate. I had to find it with my GPS after inputting longitude and latitude. When you upset the apple cart for the global energy system, you make a lot of enemies. Once in, no cameras are allowed.
What I found inside what much what I saw at the original Fremont, CA factory 15 years ago: an army of robots building machines. The factory is in effect a machine that makes machines….by the millions. Occasionally, a worker would swan past with an oil can in his hand and squirt some lubricant into an important joint, then swan away.
If you want a view of the future, this is it.
Elon does nothing small.
The present factory occupies about 2 million square feet, or about 33 football fields. Some 60% of the world’s lithium-ion batteries come out of this one place right now, which are devoted to Tesla Model 3’s and Powerwalls, of which I own six. Japan’s Panasonic, which has the contract to supply the batteries, occupies a substantial part of the factory space.
When completed, it will occupy 6 million square feet, making it the world’s largest building. The planet’s greatest solar array sits on top, making the entire facility energy neutral when combined with local windmills. The plant is fully automated and runs 24/7. There are still a few of those pesky humans around to perform complex tasks which robots can’t do….yet.
The State of Nevada just granted Tesla a ten-year tax holiday to start the second phase, which will employ another 5,000. Whole cities are being carved out of the virgin desert to accommodate them, so the entire city of Reno is rapidly marching east. Burger Kings, Taco Bells, Subways, and Chinese and Mexican restaurants are popping up in the middle of nowhere.
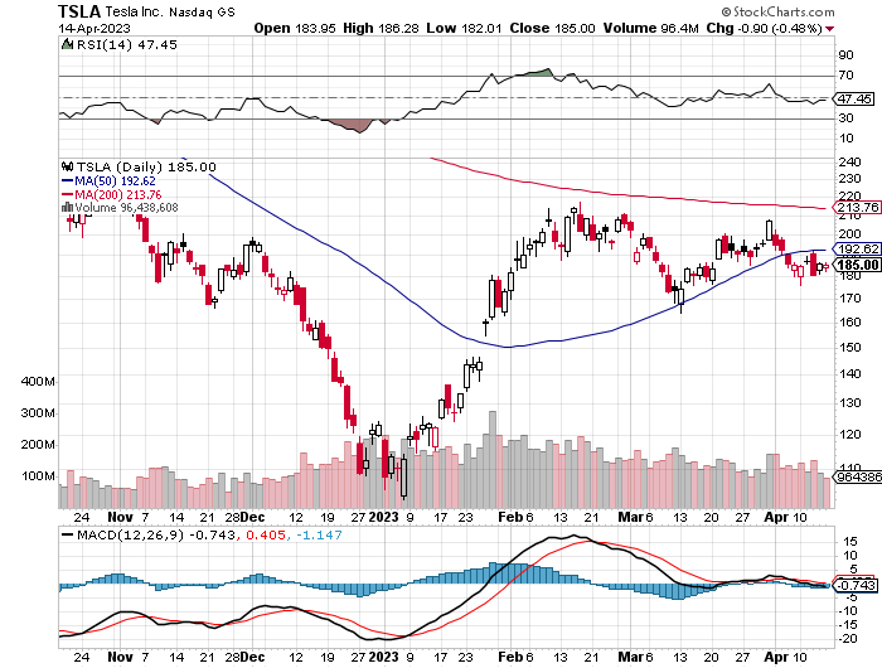
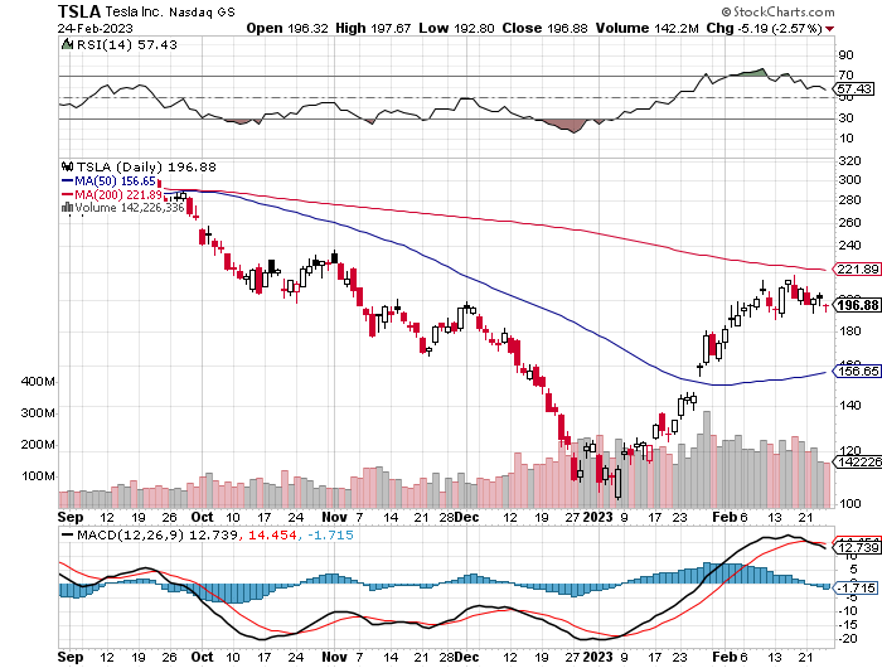
It's all coming into place to assure that Tesla meets its 1.8 million vehicle target for 2023, up 40% from 2022. The last time someone had a technology lead this great was in 1913 when Henry Ford launched assembly lines that mass-produced Model T’s for the first time. He offered them for $400 each and doubled his workers’ pay to $5 a day to buy them. This gave Ford a 75% share of the US car market for two decades.
Elon Musk will achieve the same.
Which all raises a much larger issue.
The future is happening far faster than anyone realizes.
Tesla is just the tip of the iceberg in an AI/automation trend that is rapidly taking over the world. The net effect will be to double or triple the value of the companies that embrace these trends and wipe out those that don’t. ALL companies are AI plays. This is a large part of my Dow 240,000 in a decade prediction.
Microsoft brought out its office in 1990 and it instantly made ALL companies more valuable as they adopted it. The Dow Average soared by 20 times from $600 to $12,000. The same thing is going on now with AI.
If it worked before it will work again. A 20-fold return from here takes the Dow Average from $34,000 to $680,000, except it will happen much more quickly as technology is hyper-accelerating. Dow 240,000 looks like a chipshot.
If you think this is some kind of George Lucas THX 1138 prediction, think again. These are headlines I saw in the last week.
FedEx (FDX) is firing 86,000 drivers, to be replaced by robots. Uber (UBER) is replacing its 5 million drivers with autonomous drivers to increase reliability and cut costs. Dentists adopting AI to read X-rays are catching the 12% of cavities they miss, increasing fillings and increasing profits.
I often get asked for great AI plays in the market and there are no direct ones. But in five years, companies like Microsoft’s (MSFT) ChatGPT and Alphabet’s (GOOGL) DeepMind Technologies will be spun off and sold at enormous multiples to the public, creating a frenzy.
I’ve seen it all before.
What does doubling or tripling the value of surviving companies do to the economy? It reliquefies the financial system with immense corporate cash flows. All asset classes will rocket in value, including stocks, bonds, commodities, precious metals, energy, and real estate.
While the 2010s had endless quantitative easing and zero interest rates, the 2020s will have AI and robots. Except that this time we won’t have to rely on government handouts to get there.
Suddenly, Dow 240,000 looks cheap.
I just thought you’d like to know.
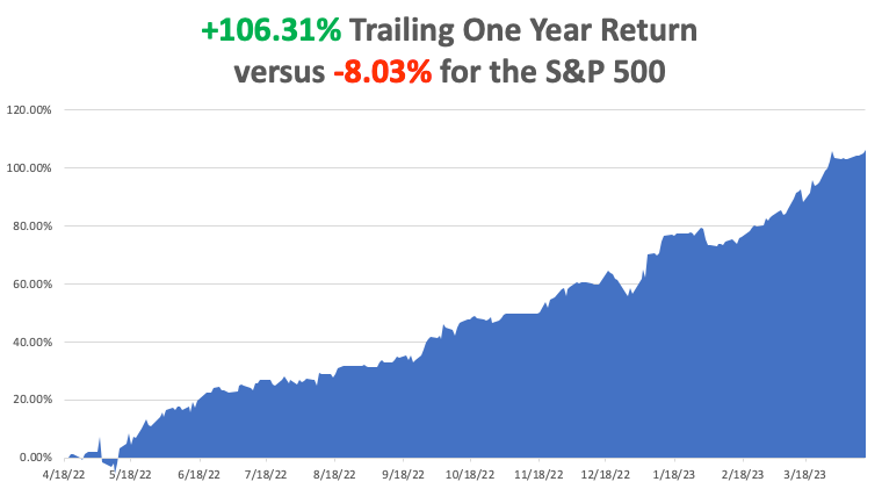
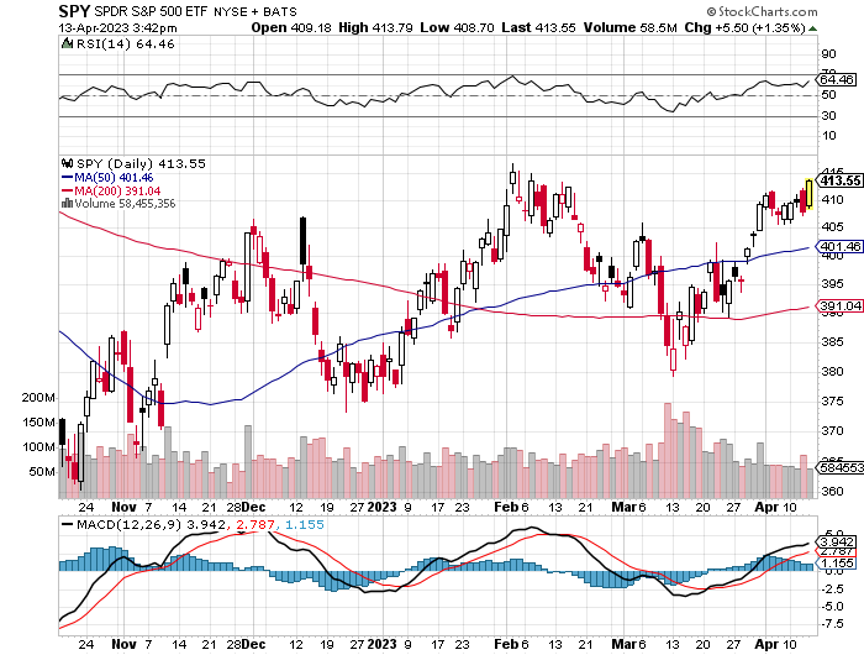
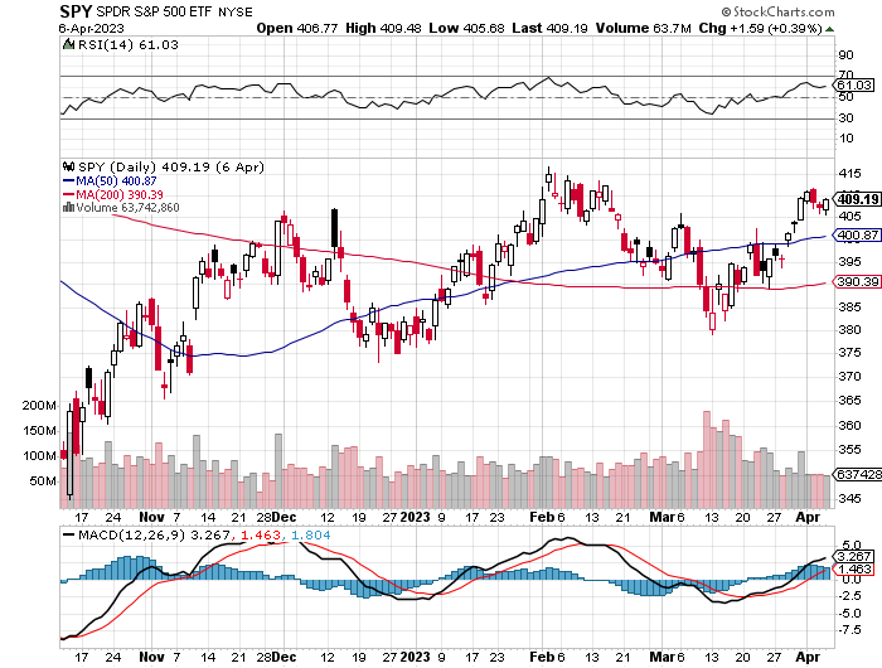
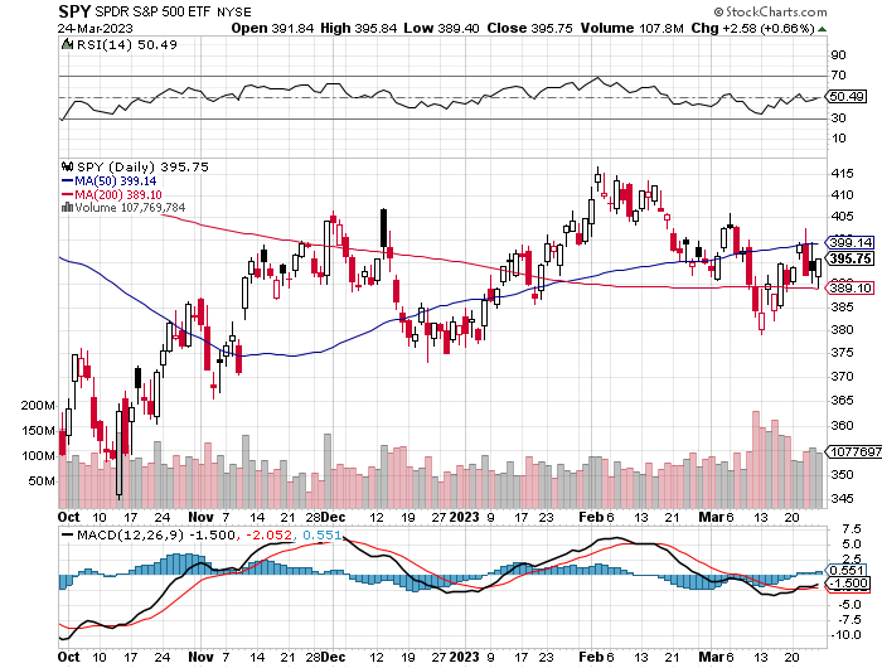
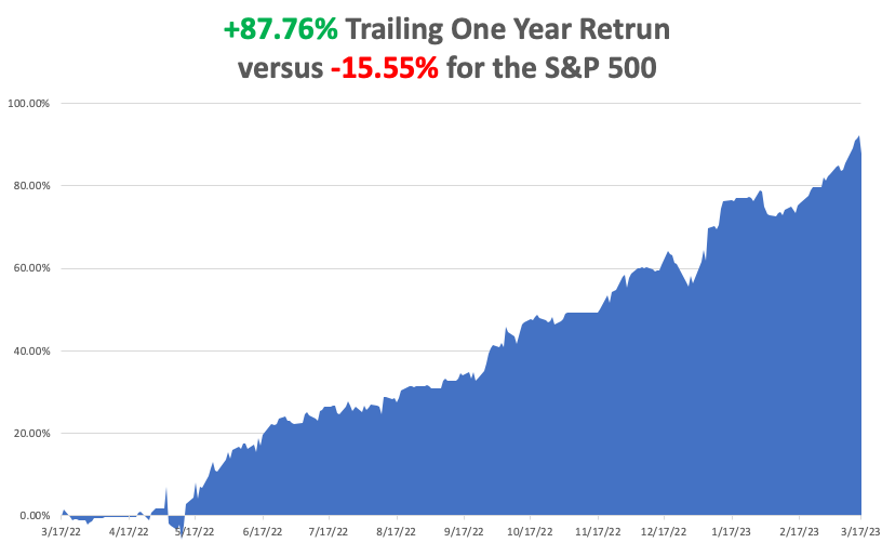
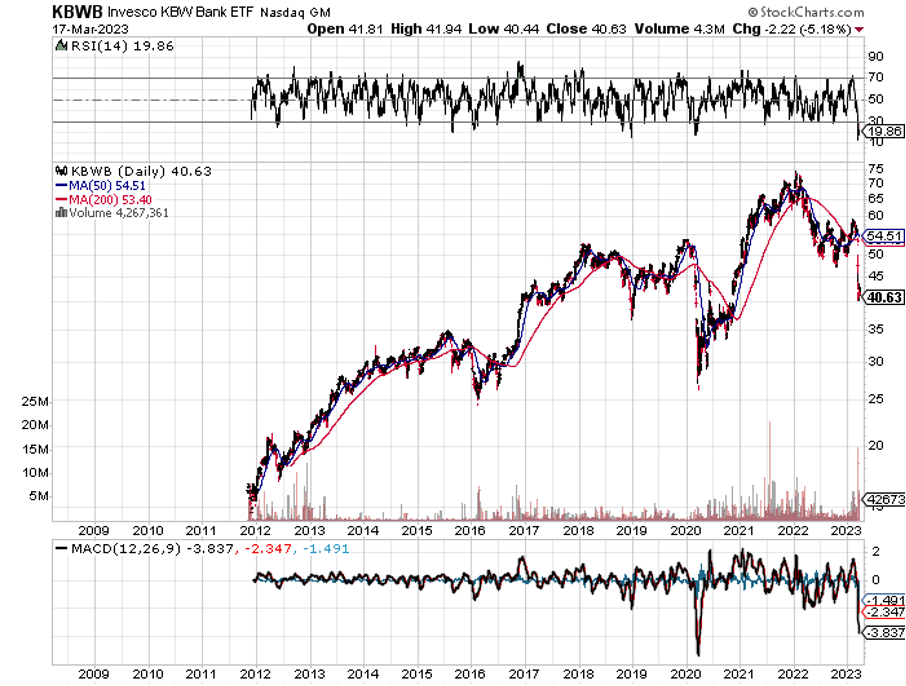
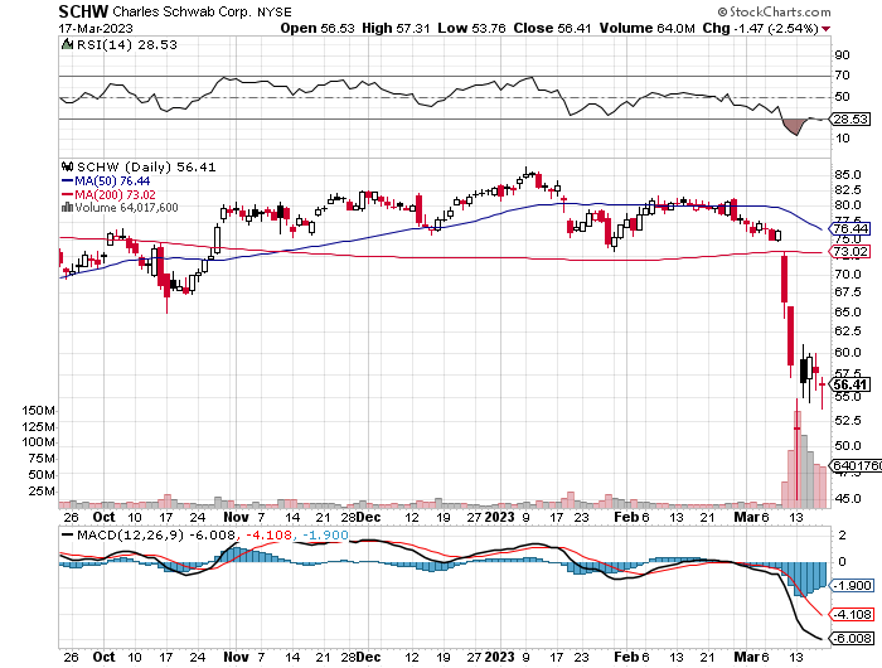
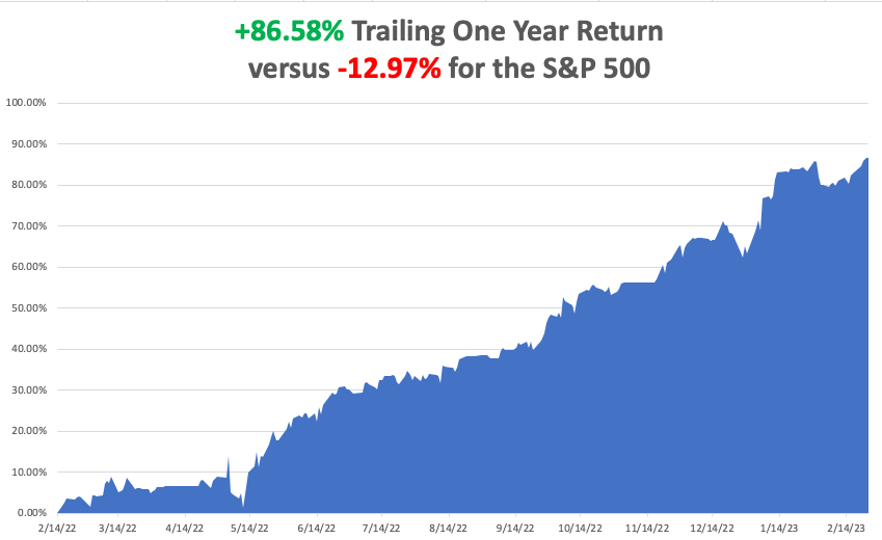
My big bet-the-ranch long in banks and brokers paid off huge. My 2023 year-to-date performance is now at an incredible +49.57%. The S&P 500 (SPY) is up only a miniscule +8.42% so far in 2023. My trailing one-year return maintains a sky-high +106.31% versus -8.03% for the S&P 500.
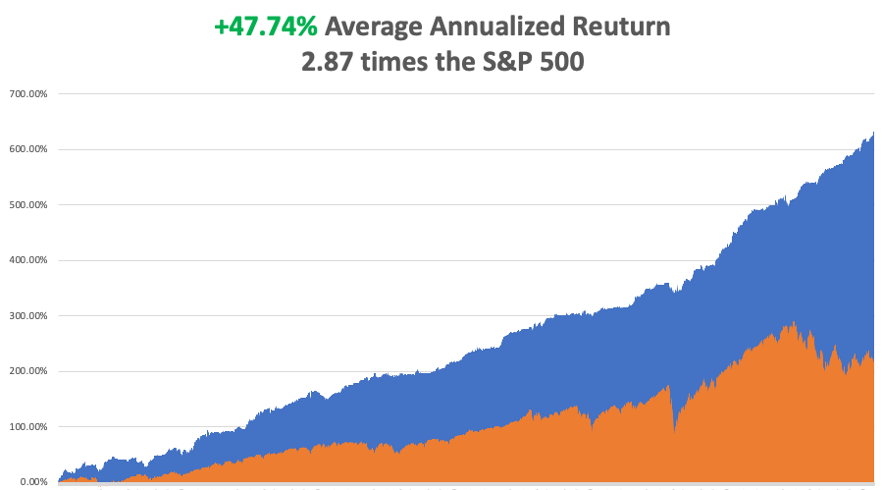
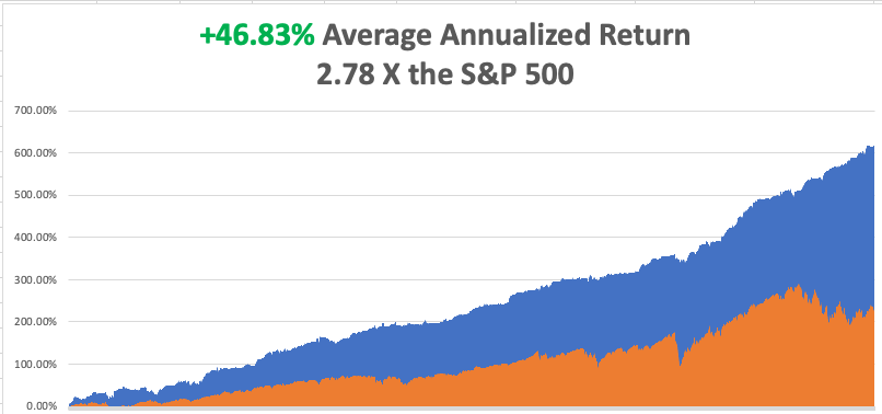
That brings my 15-year total return to +646.76%, some 2.73 times the S&P 500 (SPY) over the same period. My average annualized return has blasted up to +48.51%, another new high.
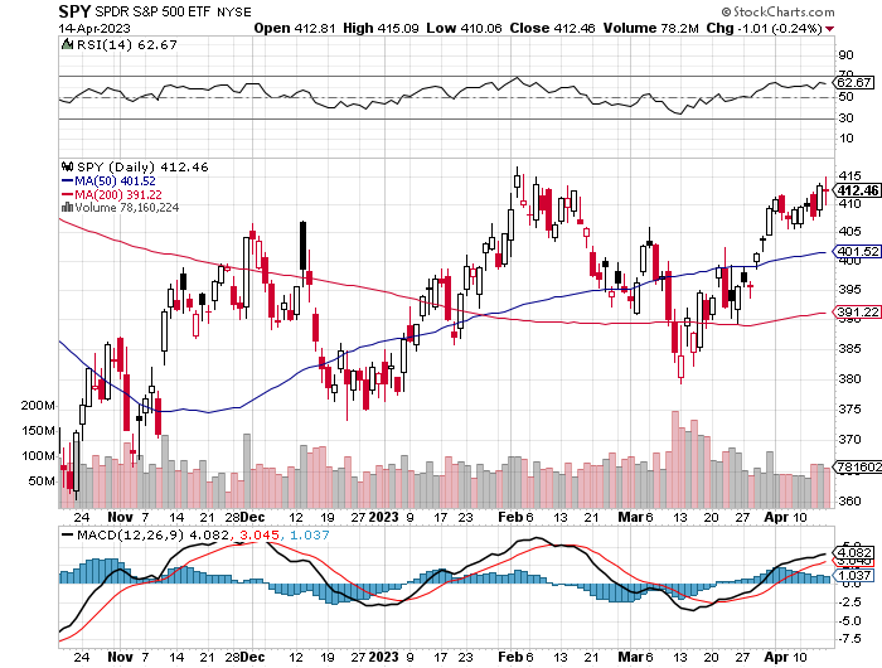
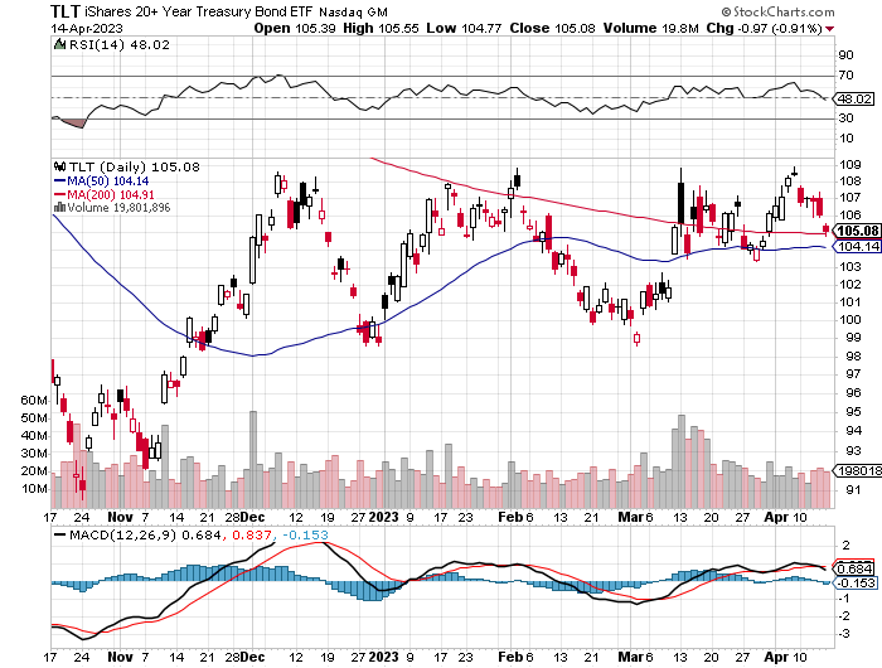
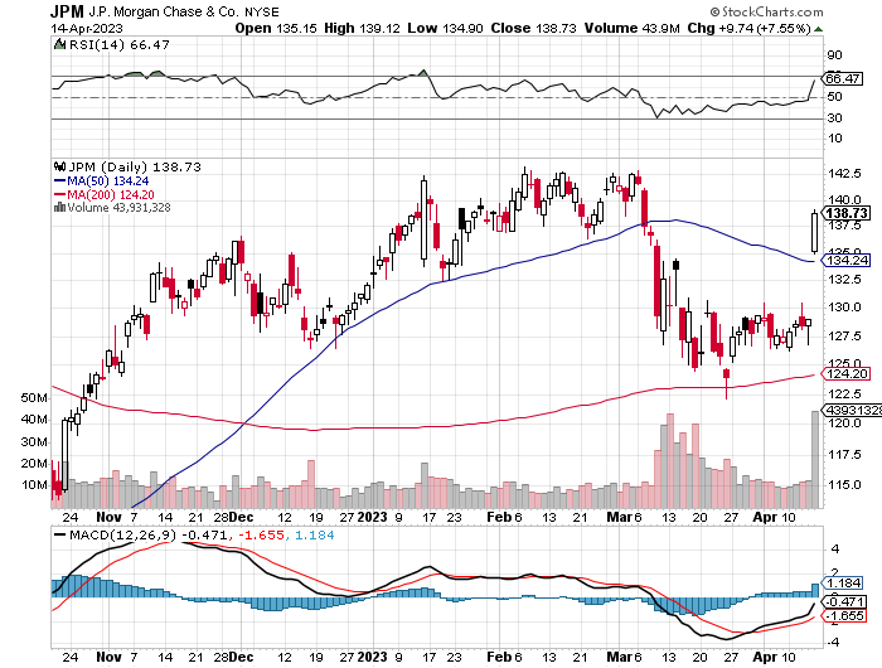
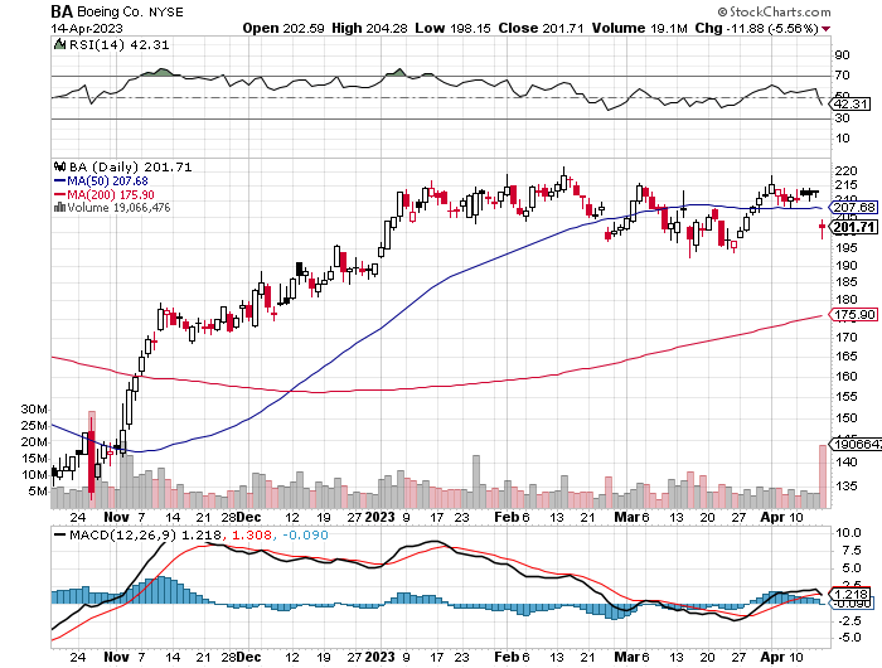
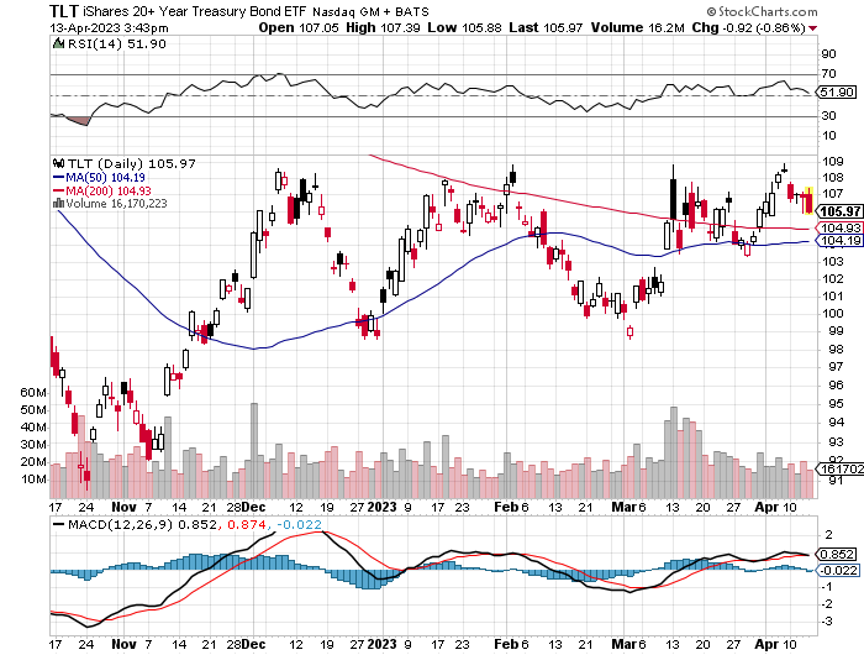
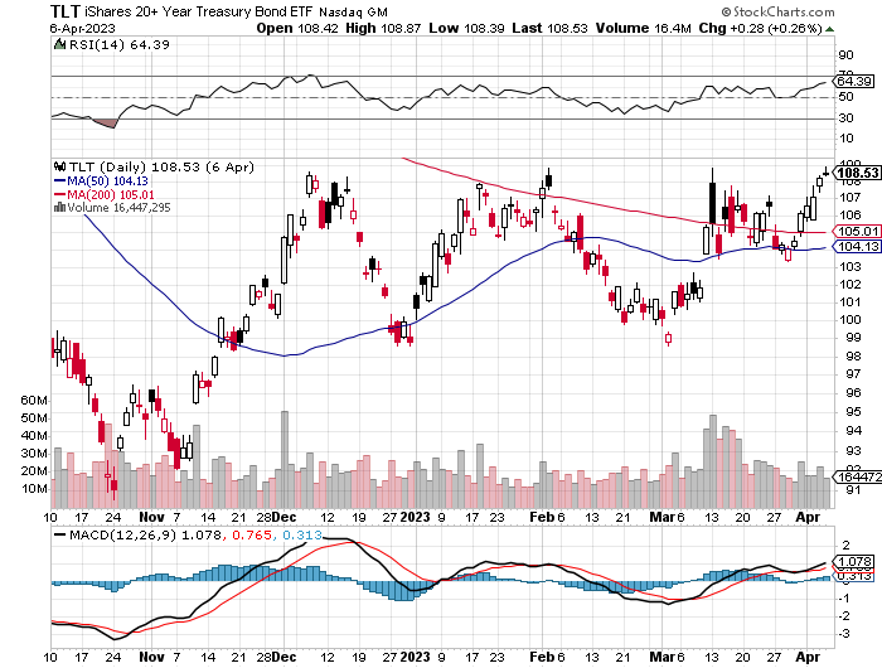
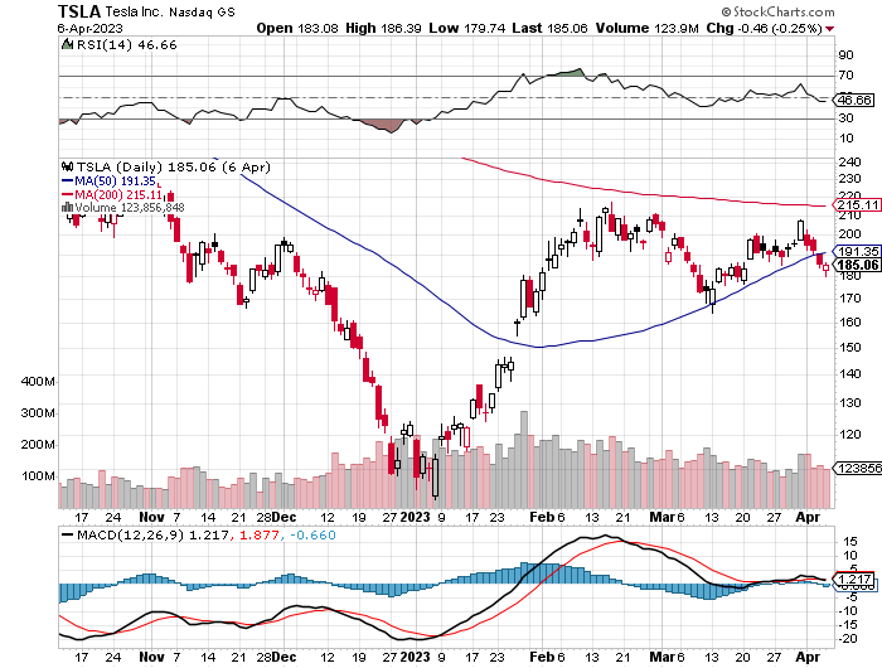
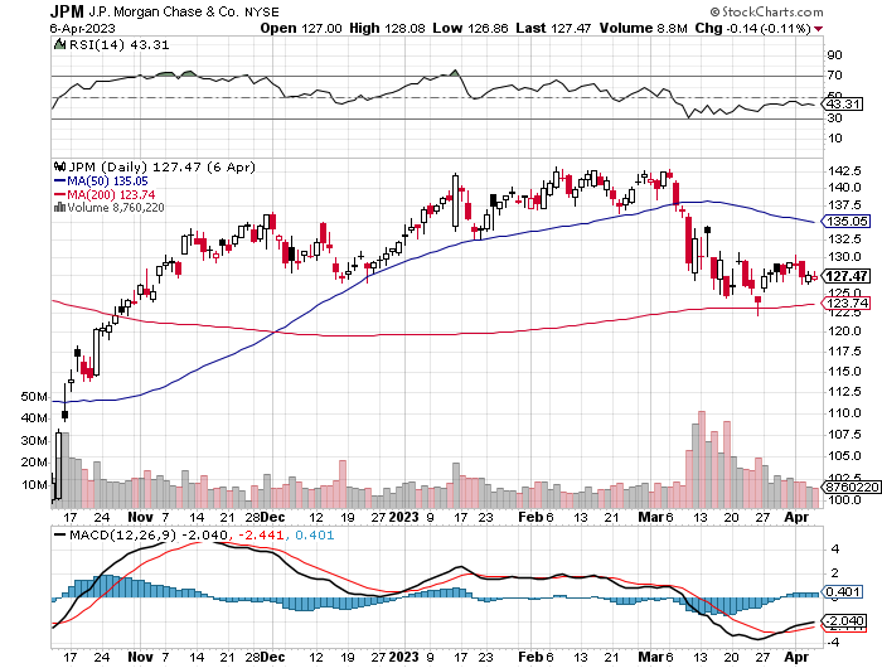
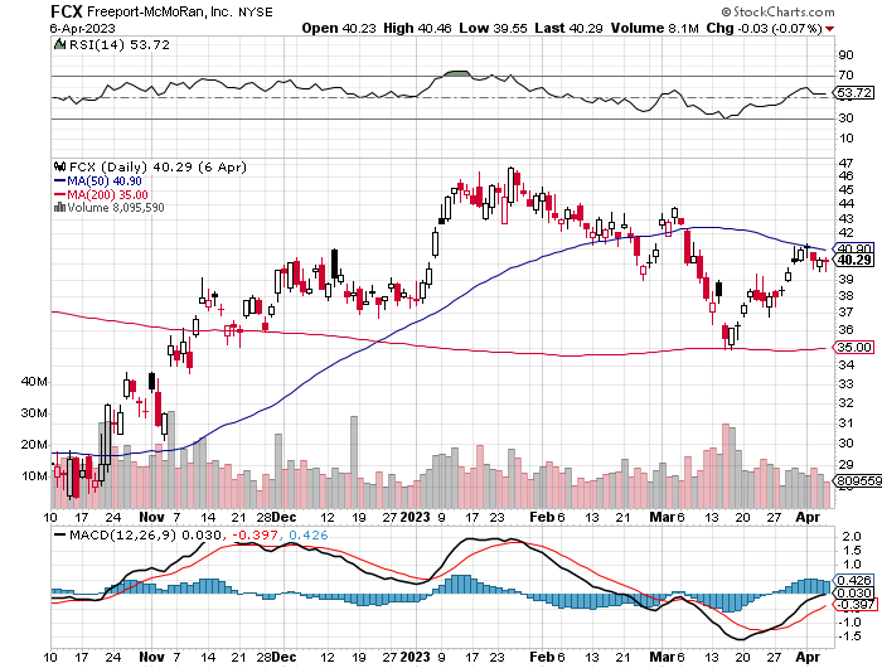
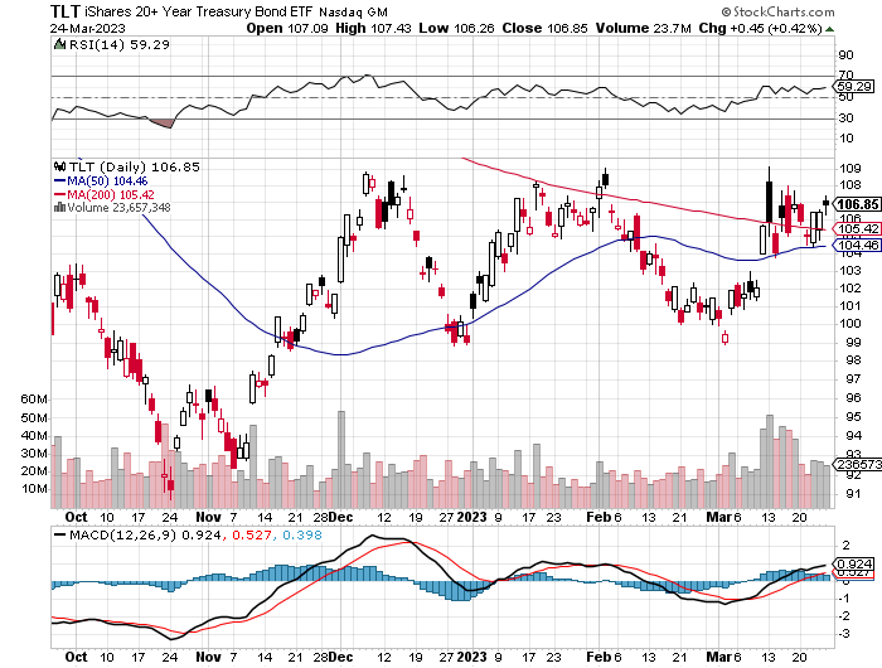
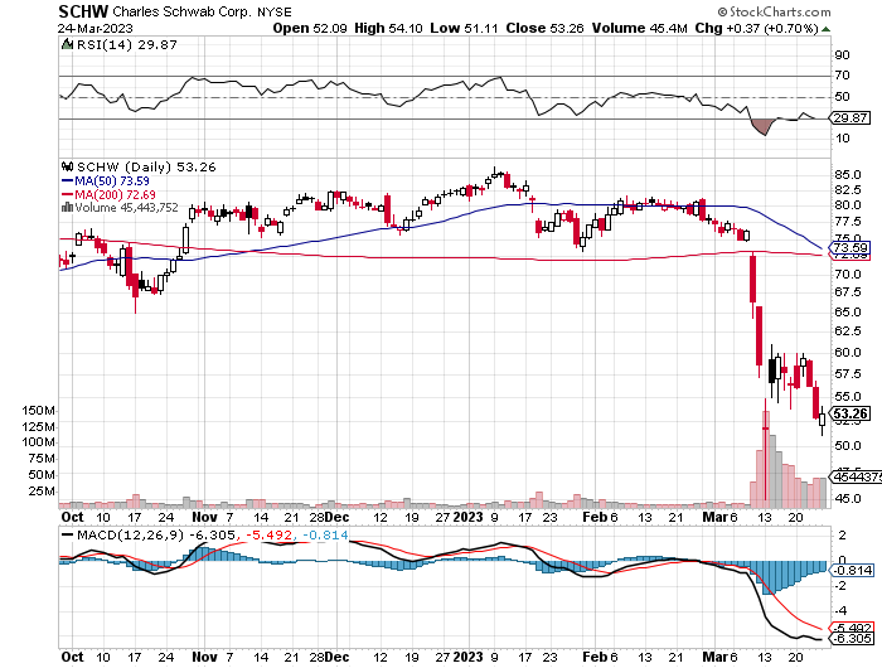
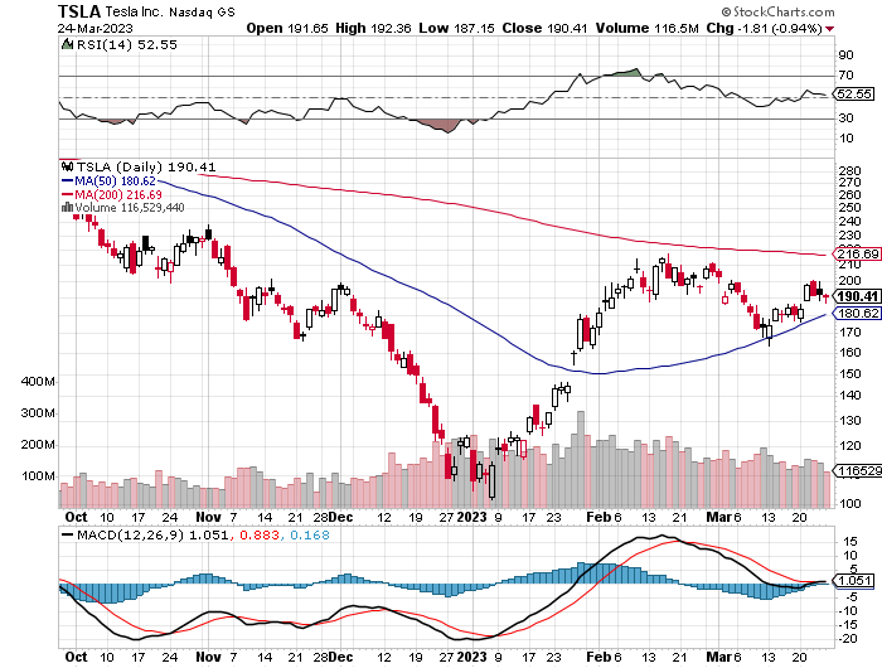
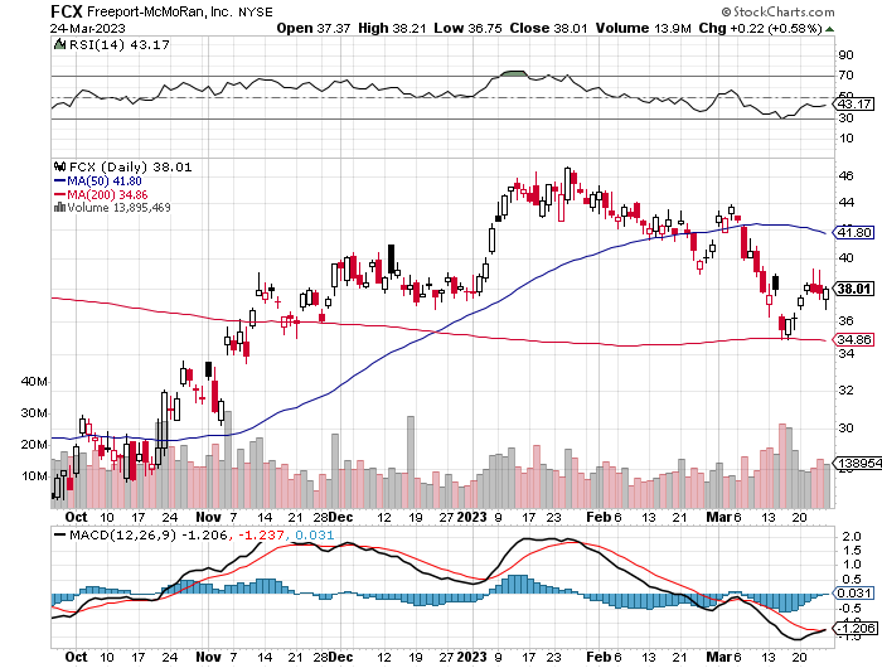
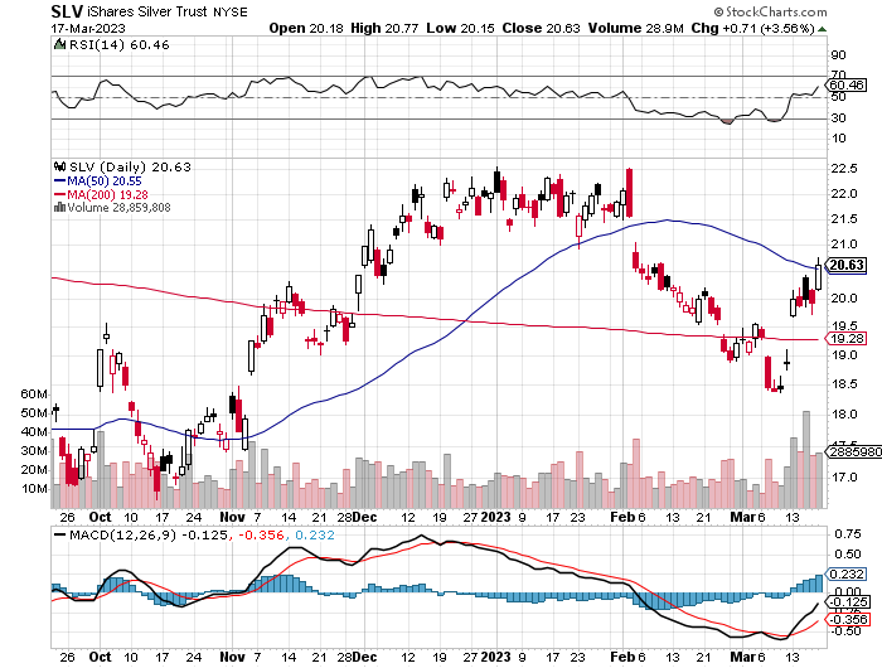
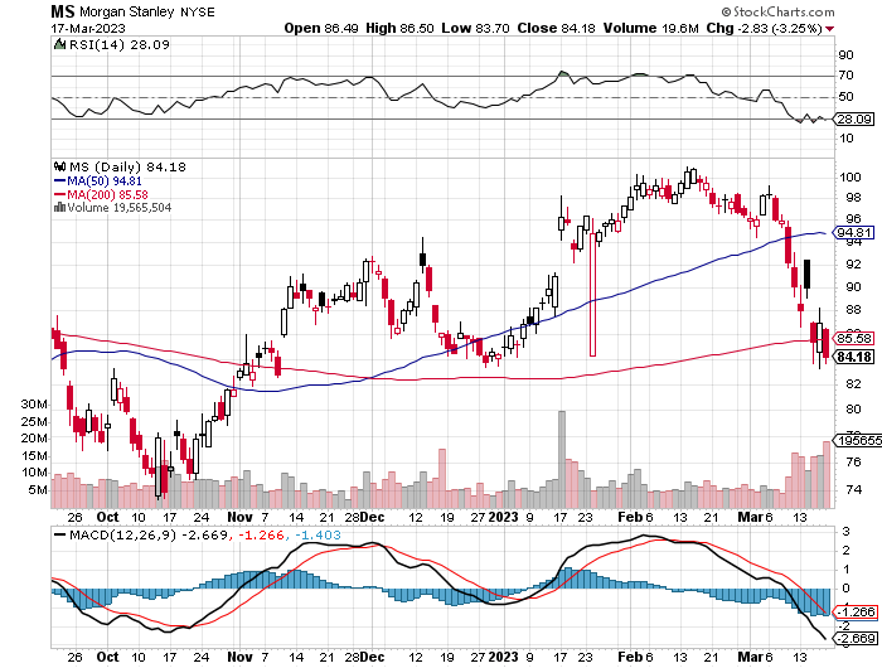
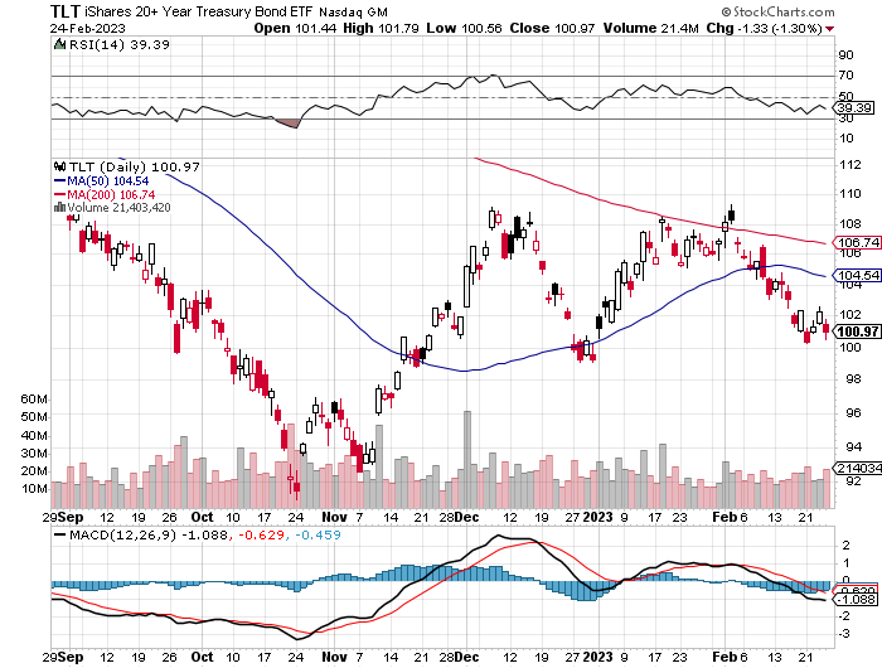
I executed four trades last week. I used the spectacular earnings beat at (JPM) to take profits and rolled that money into Boeing (BA), which had just been trashed. I also took profits on my expiring April bond long (TLT) and rolled it into a May bond long. I will run my remaining expiring April long positions in (TSLA), (BAC), (C), (IBKR), (MS), (and FCX) into the Friday, April 21 expiration.
Inflation Takes a Dive, dropping to a 5.6% YOY rate, the ninth consecutive month of decline. I think we will fall to 3%-4% by yearend, prompting the Fed to lower interest rates. That will spark a new bull market and another leg up for residential real estate. It all more fodder for the bull case. Given what the Fed has been facing, a mild recession would be a huge win.
Fed Minutes Fear Banking Crisis May Lead to a Mild Recession, killing off today’s nascent rally. It will also hobble job growth and lead to sharp declines in interest rates in 2024. Markets now see a 75% probability of a 25-basis point rate hike on May 3.
FedEx Looking to Fire All Drivers, moving to autonomously driven delivery vehicles. It may take 20 years but it’s in the works. (FDX) has already cut 12,000 jobs since June in an effort to maintain profitability and surpass rival (UPS). In 2022, (FDX) took in $93.5 billion in revenues delivering 3 billion packages, 9 for each American. I received more than my share.
PC Sales Drop 29% YOY, in Q1, adding more ammunition to the recession camp. Apple Macs led the charge to the downside with a heart-thumping 40% decline. The news slugged (AAPL). Only 56.9 million PCs we sold during the last quarter. Even with heavy discounting inventories remain high. Amazing, isn’t it?
Tesla Cuts Prices Again, knocking $3,000 off the Model 3 and $5,000 for the Model X. That sets the cat among the pigeons with traditional car companies desperately trying to catch up. Tesla is simply passing on the 50% drop in lithium prices this year. If they flush competitors out of business in the meantime so much the better. Ford has ordered designers to cut the number of parts by 80%, which Tesla did 14 years ago. (F) and (GM) are just too slow to react, even when the writing is on the wall.
$1.5 Trillion in Commercial Real Estate Debt coming due is a Threat to all asset classes. Refi’s are coming due that will double or triple interest rates from the zero-rate era and many won’t qualify. The sector is already being hammered by the “stay-at-home” work trend, with big tech firms virtually vacating whole office building in San Francisco. Regional banks may no longer have the capital to roll over at any prices given recent massive deposit withdrawals. Avoid commercial real estate REITS.
Banks Shares Explode to the Upside. JP Morgan announced blockbuster earnings, taking the stock up a ballistic $11, or 8.6%. Revenues came in at $39.34 billion versus an expected $36.19 billion. Adjusted EPS was $4.32 a share versus an expected $3.41. It is the biggest gap up in share prices on an earnings announcement in 20 years. As a result, we are just short of the maximum profit in our long (JPM), with the shares up an eye-popping 21% from the nearest strike price.
PPI Gives Another Deflation Hint, dropping a shocking 0.5% in March to only a 2.7% YOY rate. That’s a big drop from 4.9% in February. It’s the lowest inflation indicator in two years. Stocks loved the news, jumping $383. Low inflation, and therefore sharp interest rate cuts are coming within reach.
Boeing Goes Back in the Penalty Box, with a recurring bulkhead problem halting 737 MAX production. The stock dumped 8%. Buy (BA) on the dip. They’ll fix it. The company has a massive order backlog of 4,000 planes and will crush it on the earnings. The 737 MAX will shortly be flying again, the company’s largest selling product. With the airline business booming a global aircraft shortage has emerged. The end of the trade wars with China will bring a resurgence of orders there. And Boeing just surpassed Airbus in aircraft deliveries in Q1
Weekly Jobless Claims Jump 11,000 to 239,000, showing that the Fed’s harsh medicine is starting to work. It’s all consistent with a stock market that may start to roll over soon.
Private Sector Payrolls Slow to 145,000, according to ADP, a substantial drop from the previous month. Financials took the big hit with a loss of 51,000 jobs, followed by Business Services at 46,000. Leisure & Hospitality leads again with a 98,000 gain. It is more evidence of the economic slowdown the FED has been attempting to engineer for the past year.
My Ten-Year View
When we come out the other side of the recession, we will be perfectly poised to launch into my new American Golden Age, or the next Roaring Twenties. The economy decarbonizing and technology hyper accelerating, creating enormous investment opportunities. The Dow Average will rise by 800% to 240,000 or more in the coming decade. The new America will be far more efficient and profitable than the old.
Dow 240,000 here we come!
On Monday, April 17 at 7:30 AM EST, the New York State Manufacturing Index is out.
On Tuesday, April 18 at 6:00 AM, the US Building Permits are announced.
On Wednesday, April 19 at 11:00 AM, the Fed Beige Book is printed.
On Thursday, April 20 at 8:30 AM, the Weekly Jobless Claims are announced. Existing Home Sales are out.
On Friday, April 21 at 8:30 AM, the Global Composite Flash PMI is released. We also get the April options expiration at the 4:00 PM stock market close.
As for me, I don’t get invited to help design new nuclear weapons systems very often. So when the order came from Washington to report to Los Alamos, New Mexico, I was on the next plane.
When the Cold War ended in 1992, the United States judiciously stepped in and bought the collapsing Soviet Union’s entire uranium and plutonium supply.
For good measure, my client George Soros provided a $50 million grant to hire every Soviet nuclear engineer. The fear then was that starving scientists would go to work for Libya, North Korea, or Pakistan, which all had active nuclear programs. There ended up here instead.
That provided the fuel to run all US nuclear power plants and warships for 20 years. That fuel has now run out and chances of a resupply from Russia are zero. The Department of Defense attempted to reopen our last plutonium factory in Amarillo, Texas, a legacy of the Johnson administration.
But the facilities were deemed too old and out of date, and it is cheaper to build a new factory from scratch anyway. What better place to do so than Los Alamos, which has the greatest concentration of nuclear expertise in the world.
Before they started, they launched a nationwide search for those who were still alive and had nuclear expertise the last time we made our own plutonium, and they came up with….me?
Los Alamos is a funny sort of place. It sits at 7,320 feet on a mesa on the edge of an ancient volcano so if things go wrong, they won’t blow up the rest of the state. The homes are mid-century modern built when defense budgets were essentially unlimited. As a prime target in a nuclear war, there are said to be miles of secret underground tunnels hacked out of solid rock.
You need to bring a Geiger counter to garage sales because sometimes interesting items are work castaways. A friend almost bought a cool coffee table which turned out to be part of an old cyclotron. And for a town designing the instruments to bring on the possible end of the world, it seems to have an abnormal number of churches. They’re everywhere.
I have hundreds of stories from the old nuclear days passed down from those who worked for J. Robert Oppenheimer and General Leslie Groves, who ran the Manhattan Project in the early 1940s. They were young mathematicians, physicists, and engineers at the time, in their 20’s and 30’s, who later became my university professors. The A-bomb was the most important event of their lives.
Unfortunately, I couldn’t relay this precious unwritten history to anyone without a security clearance. So, it stayed buried with me for a half century, until now. Suddenly, I had an entire room of young scientists who were fair game, and it was fun relaying stories, they hung on my every word. It was like being a Revolutionary War buff and out of the blue you meet someone who knew George Washington.
Some 1,200 engineers will be hired for the first phase of the new plutonium plant, which I got a chance to see. That will create challenges for a town of 13,000 where existing housing shortages already force interns and graduate students to live in tents. It gets cold at night and dropped to 13 degrees F when I was there.
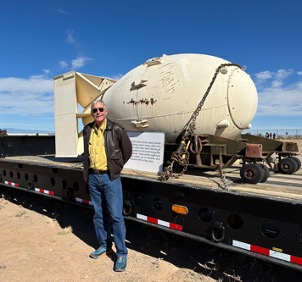
As a reward for my efforts, I was allowed to visit the Trinity site at the White Sands Missile Test Range, the first visitor to do so in many years. This is where the first atomic bomb was exploded on July 16, 1945. The 20-kiloton explosion set off burglar alarms for 200 miles and was double to ten times the expected yield.
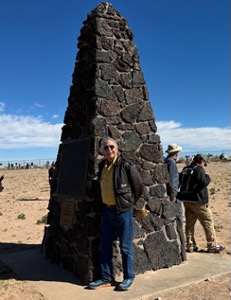
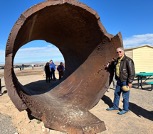
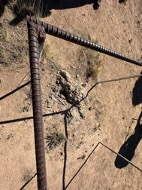
Enormous targets hundreds of yards away were thrown about like toys (they are still there). Half the scientists thought the bomb might ignite the atmosphere and destroy the world but they went ahead anyway because so much money had been spent, 3% of the US GDP for four years. Of the original 100-foot tower, only a tiny stump of concrete is left (picture below).
With the other visitors, there was a carnival atmosphere as people worked so hard to get there. My Army escort never left me out of their sight. Some 78 years after the explosion, the background radiation was ten times normal, so I couldn’t stay more than an hour.
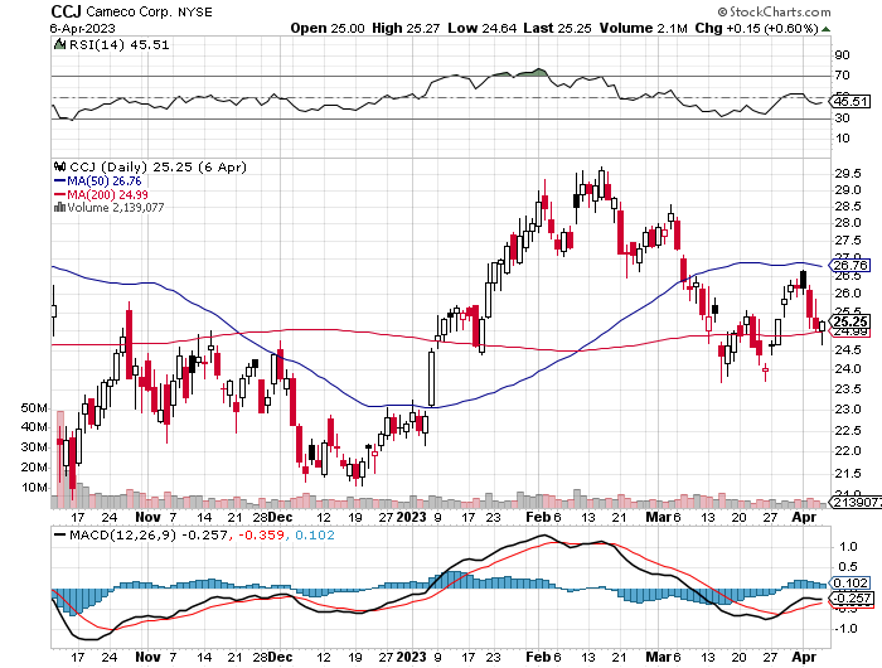
Needless to say, that makes uranium plays like Cameco (CCJ), NextGen Energy (NXE), Uranium Energy (UEC), and Energy Fuels (UUUU) great long-term plays, as prices will almost certainly rise and all of which look cheap. US government demand for uranium and yellow cake, its commercial byproduct, is going to be huge. Uranium is also being touted as a carbon-free energy source needed to replace oil.
I know the numbers, but I can’t tell you as they are classified. Otherwise, I’d have to kill you and you might not renew your subscription to Mad Hedge Fund Trader.
Good Luck and Good Trading,
John Thomas
CEO & Publisher
The Diary of a Mad Hedge Fund Trader
At Ground Zero in 1945
What’s Left of a Trinity Target 200 Yards Out
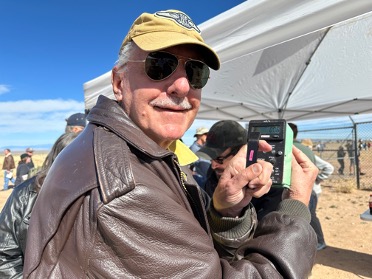
Playing With My Geiger Counter
Atomic Bomb No.3 Which was Never Used
What’s Left from the Original Test