Global Market Comments
January 18, 2021
Fiat LuxFeatured Trade:
(MARKET OUTLOOK FOR THE WEEK AHEAD, or WHAT WOULD KILL THIS MARKET?)
($INDU), (TLT), (TBT), (GLD), (GOLD), (WPM), (TESLA)
Tag Archive for: (GLD)
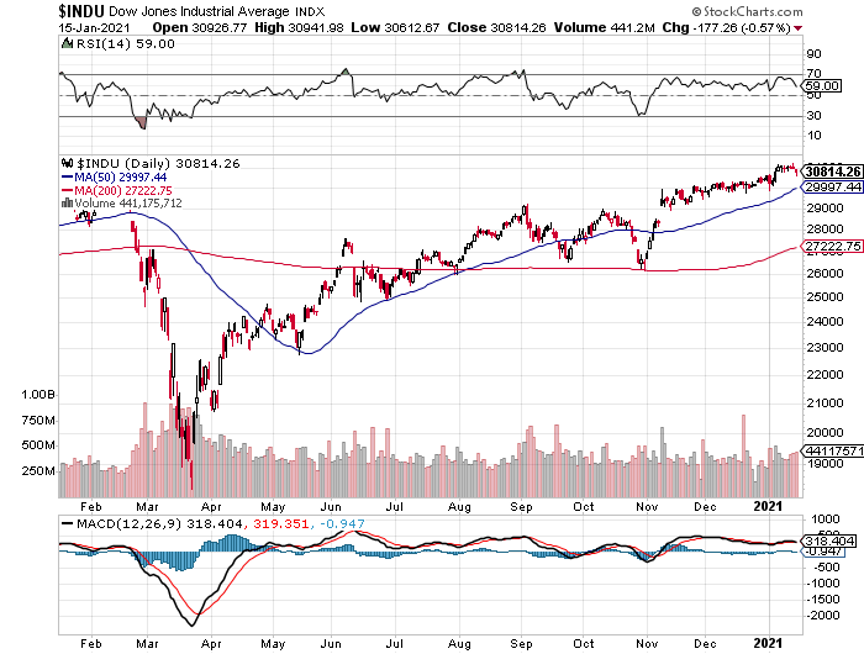
With the Dow Average now up 13,300 points, or 73.89%, since April, I’m getting besieged by questions from readers as to what could make the market go down. This is, after all, the sharpest move up in stocks in history.
With $20 trillion about to hit the US economy, $10 trillion in stimulus, $10 trillion in quantitative easing, and overnight interest rates remaining at zero for three years, there’s not much.
Still, even the most Teflon of bull markets eventually go down. Let’s explore the reasons why. I’m not intending to give you sleepless nights. But the best traders always believe that anything can happen to markets all the time.
1) The Pandemic Ends – If Covid-19 can take the market up 13,300 points in nine months, its disappearance may take it down. That’s because the all-clear on the disease may prompt investors to pull money out of stocks and put it in the real economy.
A lot of people are buying stocks because there is nothing else to do and you can execute trades in the safety of your own home without going outside. Still, this effect may be muted as there are at least 2 million fewer businesses today than before the pandemic.
2) Interest Rates Rise – The Fed has promised not to raise overnight rates for three years, or until the inflation rates top 2% for at least a year (it’s now 0.4%). That seems to give the most aggressive investors a green light for the foreseeable future.
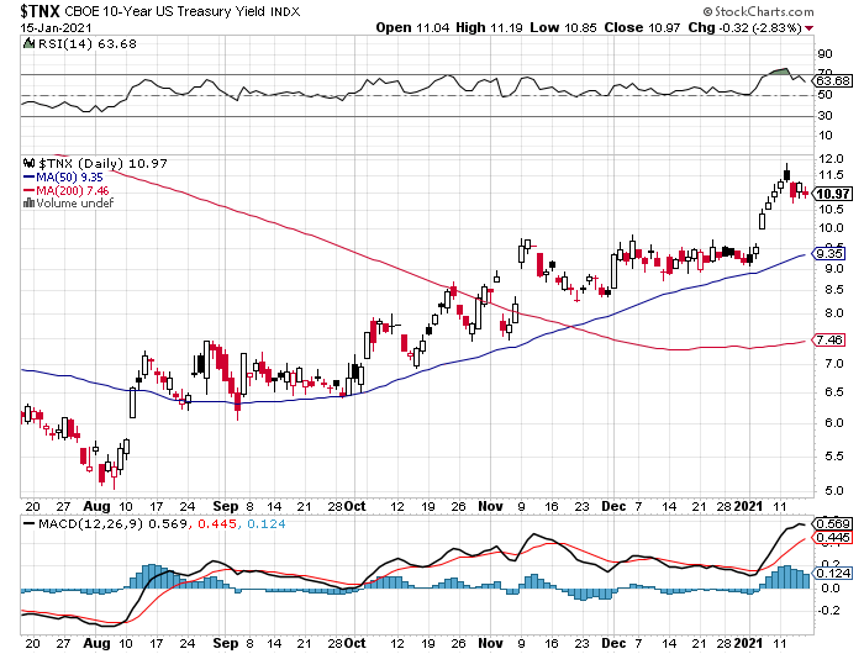
However, the Fed has no control over long term rates, which are set by the bond market. Since January 1, the yield on the ten-year US Treasury bond has soared from 0.90% to an eye-popping $1.20%, and 1.50% is certainly within reach during the first half.
The markets could easily handle that. But if the ten-year yield jumps to 3.0%, which it could do in two years, stocks could suffer, especially if we are at much higher levels by then.
3) Stocks Go Down – A lot of new traders are buying stocks simply because they are going up, independent of the thought process. What if stocks go down? Scads of you are now promising to buy on the next 10% pullback. I guarantee you that when we ARE down 10%, the only thing on your mind will be selling. That’s the way it always works. Loss of upside momentum could easily turn into vicious downside momentum.
4) The Pandemic Gets a Lot Worse – The Teflon market (which was invented during the Manhattan Project to prevent the corrosion of the insides of steel pipes by uranium or plutonium) has matched rising share prices with increasing Corona deaths tic for tic since March. We are now at 4,000 deaths a day and many hospitals now have fleets of freezer trucks parked outside because they can’t bury the bodies fast enough.
Government health officials tell us the pandemic is peaking right now. What if they are wrong? What if in the coming months, deaths top 10,000 a day? That would definitely be worth a 10% correction, if not a 20% one.
Summary
It all sets up a continuing run for stocks that could last at least two years and take the Dow as high at 45,000, or up 50% from here.
Which leads me to a different subject.
What if I am wrong?
I know that many of you have invested in two-year call options (LEAPS, or long term equity participation securities) at the March-May bottom and are sitting on the biggest profits in your life. Lots of these are several thousand percent in the money and have turned into 10X leveraged long equity positions, essentially synthetic futures. As a result, you now have no downside protection whatsoever.
If you bought the 2022 $120-$130 call spread at $20, it is now worth $765, a gain of 38.25X, or 3,825%. You have essentially just won the lottery.
This is what you need to do right now: roll up your strikes.
I shall explain.
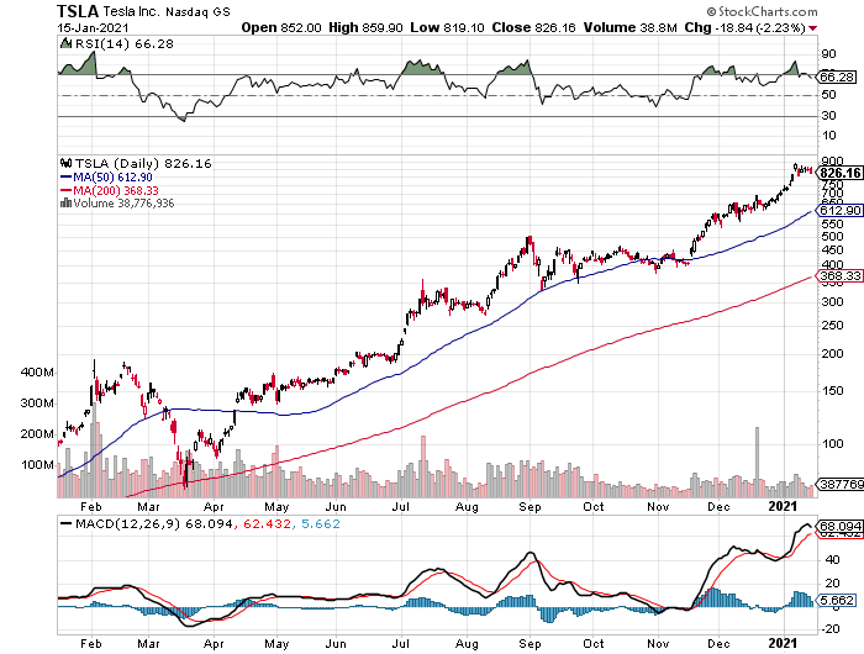
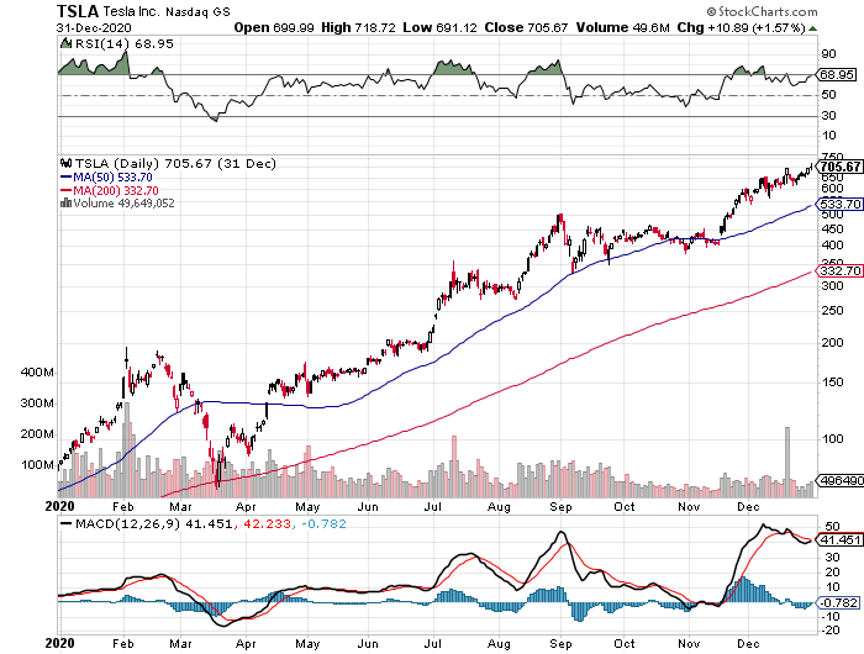
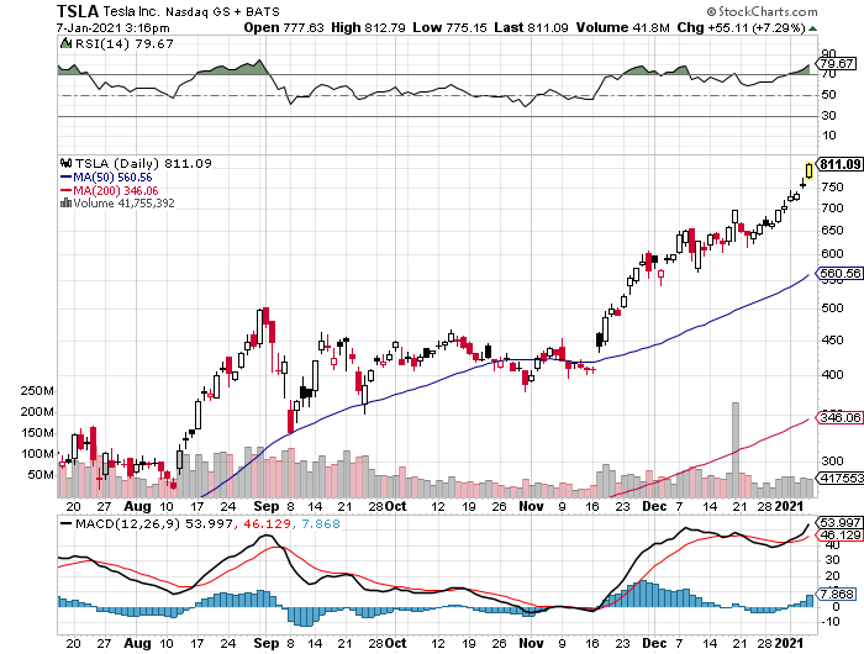
Let’s say that when Tesla was at $80 on a split-adjusted basis, I begged many of you to buy the 2022 $120-$130 call spread. Tesla shares then rose by a mind-boggling 1,006%.
Here’s what you do. Sell your 2022 $120-$130 call spread immediately. Lock in the profit. Then buy a 2023 $900-$950 call spread. If Tesla falls, it will be at a much slower rate than your existing position.
Long-dated out-of-the-money options fall at a much slower rate than stocks because they have immense time value. They demonstrate a downside “hockey stick” effect. Very roughly speaking and without doing any math, a 50% drop in the stock will deliver only a 25% drop in the options. However, if Tesla shares rise, you will still participate in the upside and get 95% of the gain.
It’s a classic “heads I win, tails you lose” set up.
This is what professional traders do automatically, without thinking about it as if it were second nature.
I just thought you’d like to know.
About Last Week
A second insurrection is in play for January 20 according to the FBI, with armed demonstrations planned in the capitols of all 50 states. Don’t plan on traveling that day. Public access to the capitol building has ceased for the foreseeable future. Washington is now an armed camp, with 25,000 National Guard called in. The FBI is attempting to arrest the ring leaders as fast as possible. Market will keep seeing this as a buying opportunity, the fires under the market are burning so hot.
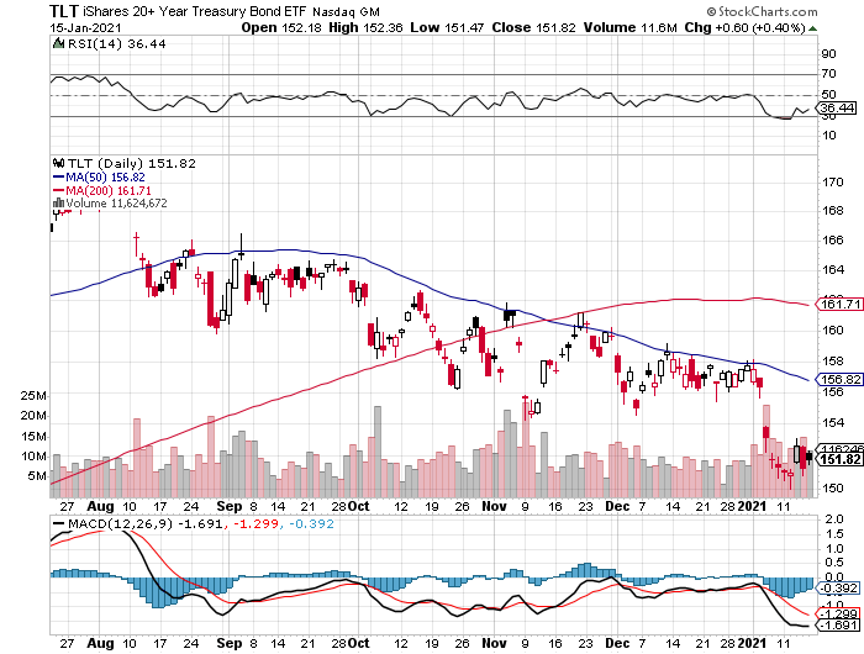
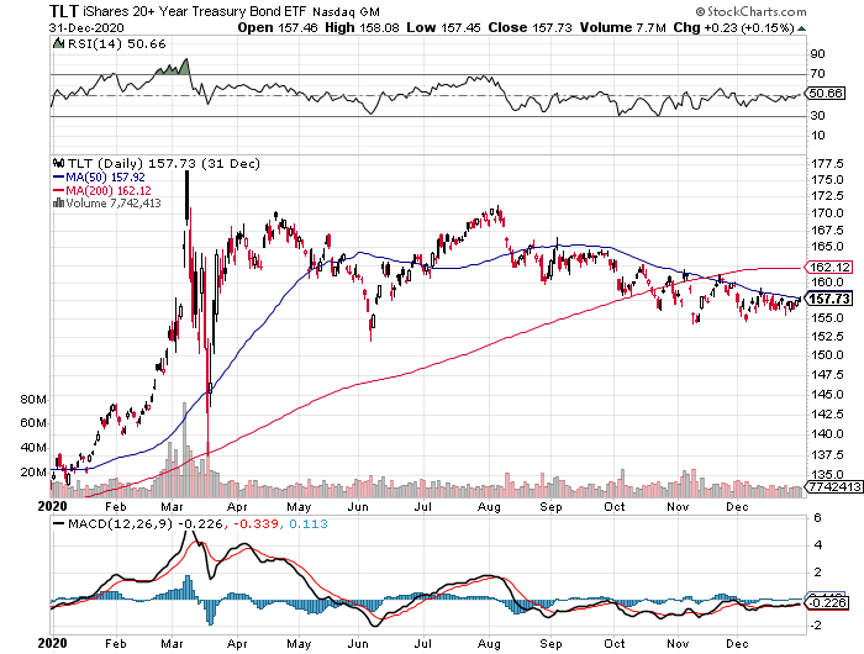
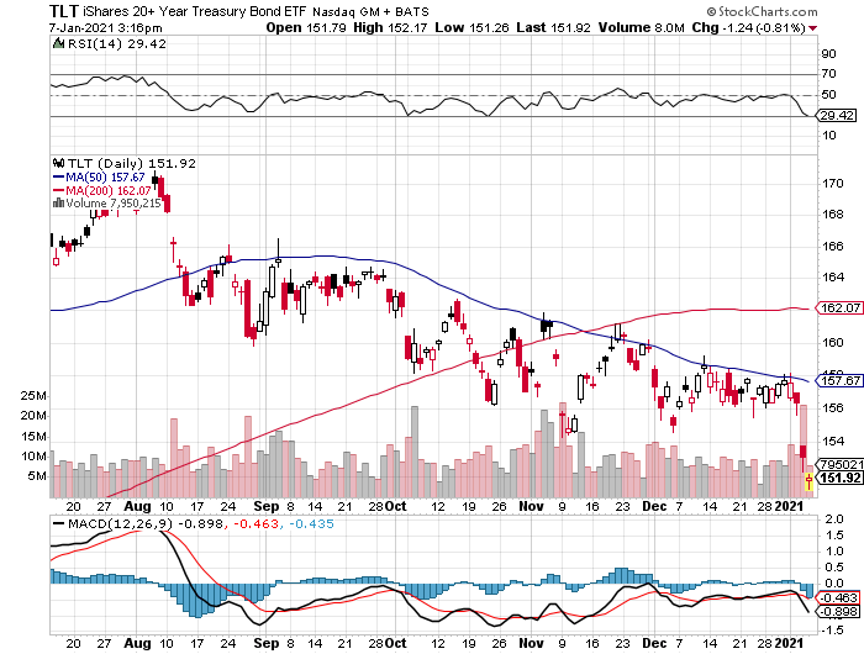
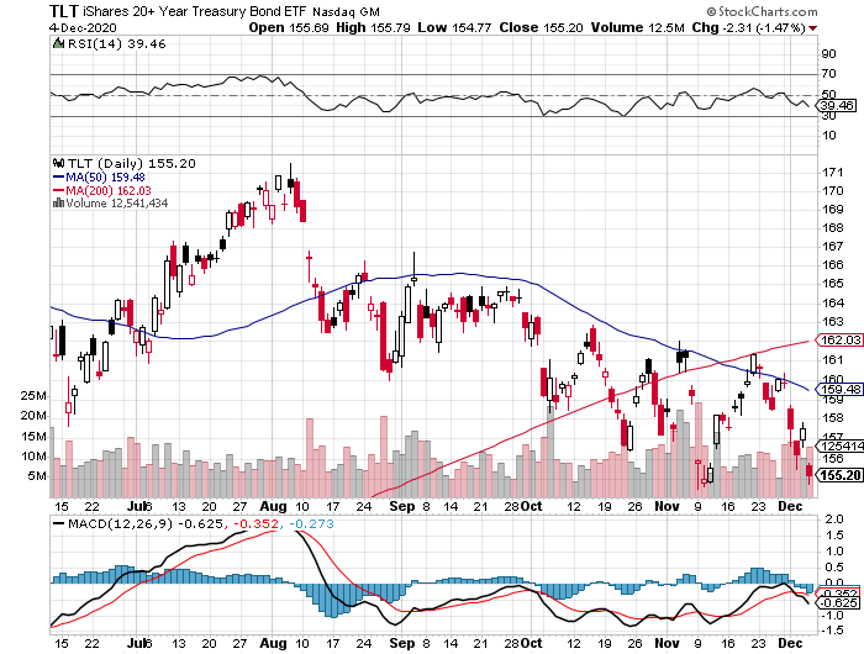
The US budget deficit soared to $573 billion in Q4, up 61% YOY. For the full calendar year, the deficit reached a mind-boggling $3.3 trillion, triple the previous year. Almost all the increase went to spending on pandemic related benefits. It’s another nail in the coffin for the bond market. Keep selling the (TLT), even on small rallies. This could be the trade of the century.
The US has 3 million fewer jobs than when Trump took office four years ago. It’s the worst performance since Herbert Hoover took office in 1928. That’s exactly what I predicted back in 2016. Up to March 2020, we also had a zero return in the stock market under Trump, which only started to improve when Biden took the lead in the primaries in May. In the meantime, the National Debt soared from $20 trillion to $28 trillion and it is still soaring. Over 100% of US growth during the Trump administration has been borrowed from the future on credit. It’s not a way to run a country.
The semiconductor shortage is slowing the auto industry, with Toyota, Ford, and Fiat cutting back production. It’s a global problem. Modern cars use more than 100 chips each and are becoming more apps than hardware. I’ve been predicting this for a year, and the problem will continue as it takes billions of dollars and years to ramp up new production. Buy the daylights out of (NVDA), (AMD), and (MU).
Technology is 2% of US employment but 27% of market capitalization and 38% of profits, says my old friend Jeffrey Gundlach of Double Line. Bitcoin is a bubble, inflation will be 3% by June, and bonds (TLT) are beyond terrible. Stocks are expensive but could run for a long time.
Weekly Jobless Claims delivered a horrific print, up 181,000 to 965,000, the worst since the spring. Covid-19 is clearly the reason. Stocks could care less and pushed on to new all-time highs, up eight days in a row. It really is a “Look Through” market.
No rate hike until 2% inflation for a year, said Fed Governor Clarida. It could be a long wait as indicated by the recent 0.4% report.
US air travel is down 61% in November YOY, and that includes the big Thanksgiving travel bump. A trend up will start later this year, but airlines will still emerge from the pandemic with tons of debt. Avoid.
Netflix is launching a movie a day, for all of 2021. It’s disrupting legacy Hollywood at Internet speed, which Covid-19 has brought to a screeching halt. The stock has seen a sideways correction since tech peaked in sideways. Buy at the bottom end of the recent range.
When we come out the other side of pandemic, we will be perfectly poised to launch into my new American Golden Age, or the next Roaring Twenties. With interest rates still at zero, oil cheap, there will be no reason not to. The Dow Average will rise by 400% to 120,000 or more in the coming decade. The American coming out the other side of the pandemic will be far more efficient and profitable than the old. Dow 120,000 here we come!
My Mad Hedge Global Trading Dispatch shot out of the gate with an immediate 6.25% profit for the first ten trading days of the year. That is net of a 4% loss on a Tesla short which I added one day too soon. I went pedal to the metal immediately, again going 100% invested with a 50% long/50% short market-neutral portfolio.
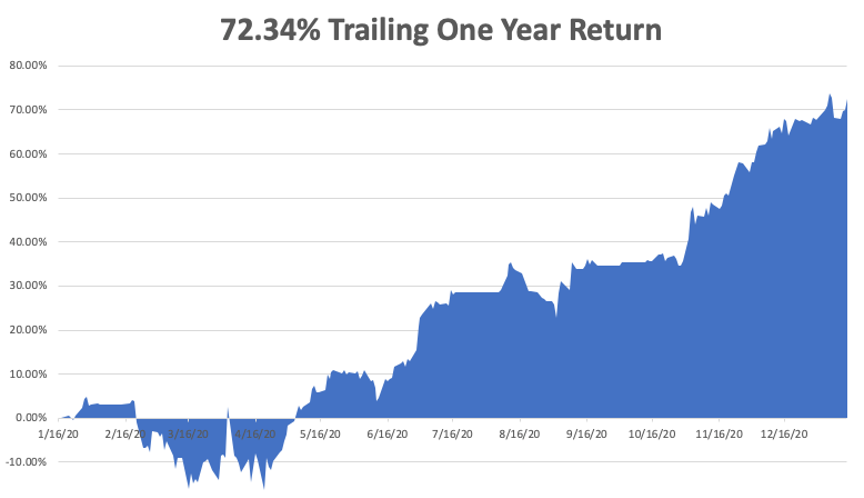
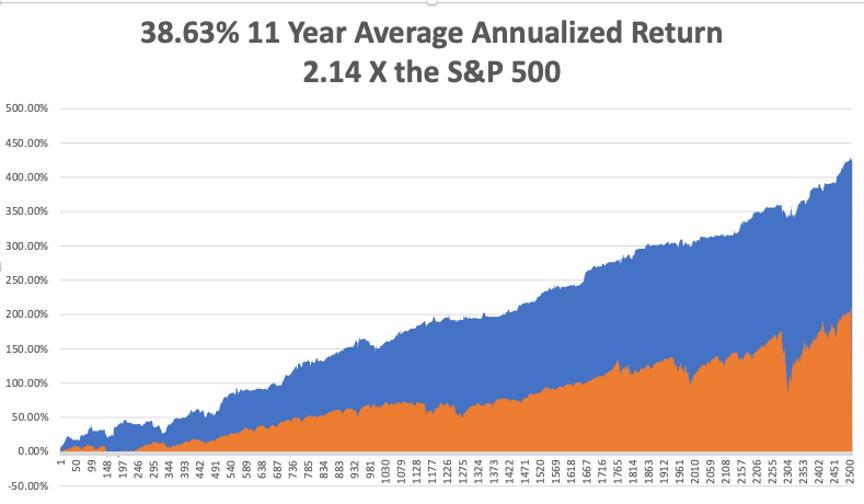
That brings my eleven-year total return to 428.80% double the S&P 500 over the same period. My 11-year average annualized return now stands at a nosebleed new high of 38.63%, a new high. My trailing one-year return exploded to 72.34%, the highest in the 13-year history of the Mad Hedge Fund Trader. We have earned 90% since the March low.
I did bail on my precious metals positions on (GOLD), (NEM), and (WPM) for small profits. The metals hate rising interest rates and competition from Bitcoin. They have effectively gone into a long bond, short Bitcoin position and I am not interested in either.
The coming week will be a slow one on the data front with Q4 earnings reports coming out daily.
We also need to keep an eye on the number of US Coronavirus cases at 24 million and deaths at 400,000, which you can find here. We are now running at a staggering 4,000 deaths a day.
When the market starts to focus on this, we may have a problem.
On Monday, January 18 at 11:00 AM EST, the US Markets will be closed for Martin Luther King Day.
On Tuesday, January 19 at 4:30 PM, Bank of America (BAC), Goldman Sachs (GS), and Netflix (NFLX) report.
On Wednesday, January 20 at 10:00 AM, we get the NAHB Housing Market Index. Morgan Stanley (MS) and Proctor and Gamble (PG) report.
On Thursday, January 21 at 8:30 AM, December Housing Starts are printed. Intel (INTC) and Union Pacific (UNP) report.
On Friday, January 22 at 10:00 AM, Existing Home Sales for December are out. Schlumberger (SLB) reports. At 2:00 PM, we learn the Baker-Hughes Rig Count.
As for me, I’m still waiting for orders on where to report for my Pfizer Covid-19 vaccination. In the meantime, since I will still be locked up for months to come, I have been viewing precious old pictures and videos from my past travel extravaganzas.
In 2019, I took my girls around the world via New Zealand, Sydney, Brisbane, Melbourne, Perth, Manila, New Delhi, Dubai, Cairo, Athens, Venice, Budapest, Brussels, Zermatt, and then back to San Francisco. We don’t do anything small in my family. Click here for the link to my favorite video of us arriving in Venice.
Stay healthy.
John Thomas
CEO & Publisher
The Diary of a Mad Hedge Fund Trader
Global Market Comments
January 12, 2021
Fiat Lux
Featured Trade:
(MAD HEDGE 2020 PERFORMANCE ANALYSIS),
(SPY), (TLT), (TBT), (TSLA), (GLD),
(SLV), (V), (AAPL), (VIX), (VXX)
(TESTIMONIAL)
When a Marine combat pilot returns from a mission, he gets debriefed by an intelligence officer to glean whatever information can be obtained and lessons learned.
I know. I used to be one.
Big hedge funds do the same.
I know, I used to run one.
Even the best managers will follow home runs with some real clangors. Every loss is a learning experience. If it isn’t, investors will flee and you won’t last long in this business. McDonald’s beckons.
By subscribing to the Mad Hedge Fund Trader, you get to learn from my own half-century of mistakes, misplaced hubris, arrogance, overconfidence, and sheer stupidity.
So, let’s take a look at 2020.
It really was a perfect year for me during the most adverse conditions imaginable, a pandemic, Great Depression, and presidential election. I made good money in January, went net short when the pandemic hit in February, and played the big bounce in technology stocks that followed.
Right at the March crash bottom, I sent out lists of 25 two-year option LEAPS (Long Term Equity Participation Securities). Many of these were up ten times in months. I then used a Biden election win as a springboard for a big run with domestic recovery stocks and financials.
One client turned $3 million into $40 million last year. He owes me a dinner and my choice on the wine list. (Hmmmmm. Lafitte Rothschild 1952 Cabernet Sauvignon with a shot of Old Rip Van Winkle bourbon as a chaser?). I usually get a few of these every year.
See, that’s all you have to do to bring in a big year. Piece of cake. It’s like falling off a log. But then I’ve been practicing for 50 years.
In the end, I managed to bring in a net return of 66.5% for all of 2020. That compares to a net return for the Dow Average of 5.7%.
My equity trading in general brought in 71.94% in profits, with 216 trade alerts, and were far and away my top performing asset class. This was the best year for trading equities since the 1999 Dotcom bubble top.
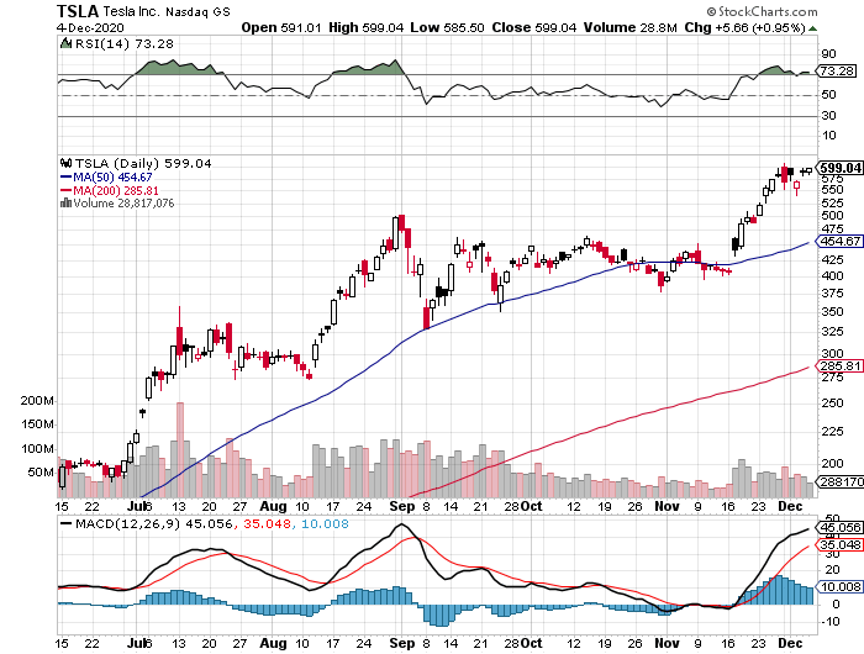
Of course, the best single trade of the year was with Tesla (TSLA), with 18 trades bringing in a 10.55%. I dipped in and out during the 10-fold increase from the March low to yearend.
Readers were virtually buried with an onslaught of inside research about the disruptive electric car company. It’s still true if you buy the stock, you get the car for free, as I have done three times.
Some 26 trades in Apple (AAPL) brought in a net 5.94%. It did get stopped out a few times, hence the lower return.
The second most profitable asset class of the year was in the bond market, with 58 trades producing a 31.16% profit. Virtually all of these trades were on the short side.
I sold short the United States Treasury Bond Fund from $180 all the way down to $154. I called it my “rich uncle” trade of the year, writing me a check every month and sometimes several a month. This is the trade that keeps on giving in 2021. Eventually, I see the (TLT) falling all the way to $80.
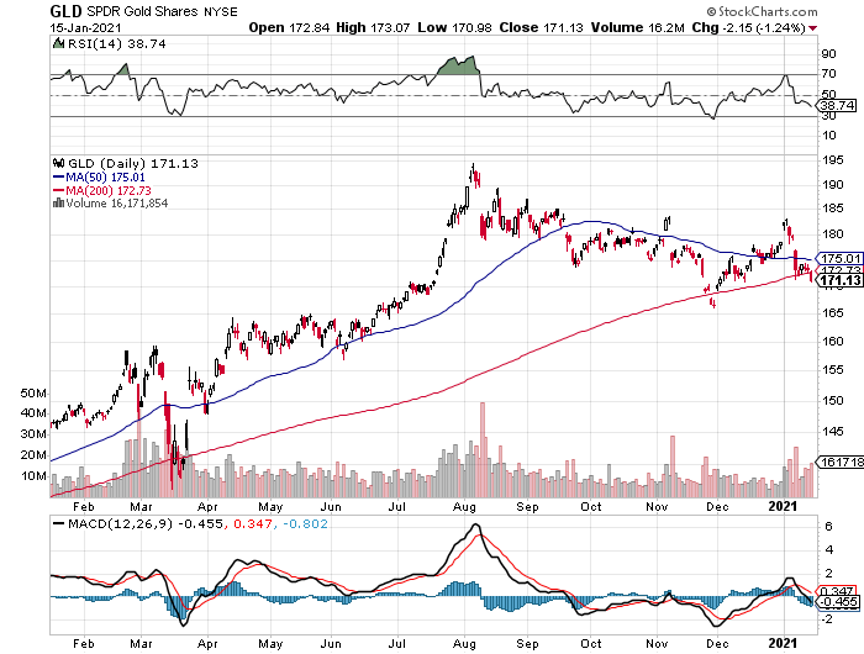
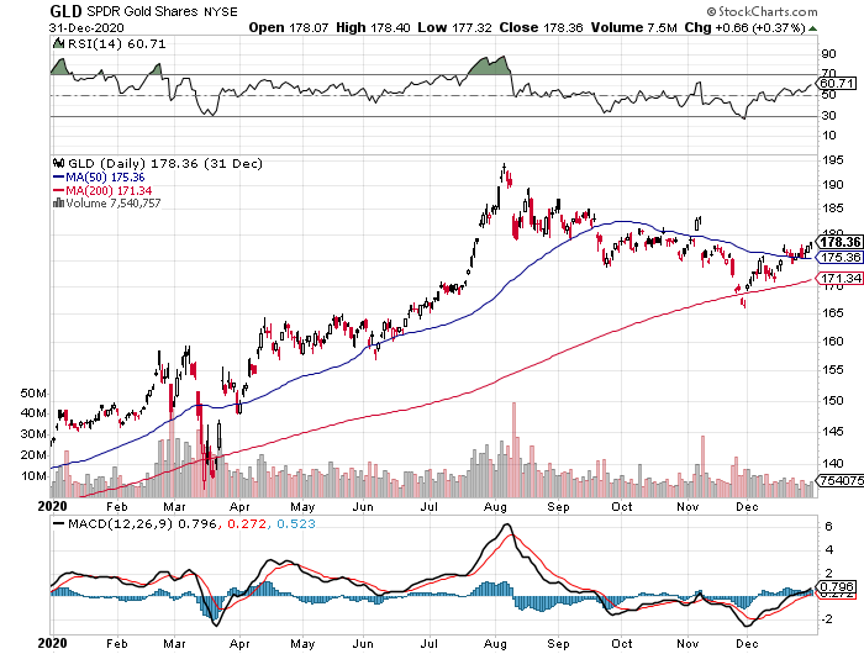
I did OK with gold (GLD), making 4.88% with eight trades in the SPDR Gold Shares ETF. Gold rose steadily until August and then fell for the rest of the year. I picked up another 1.77% on two silver trades (SLV).
It was not all a bed of roses.
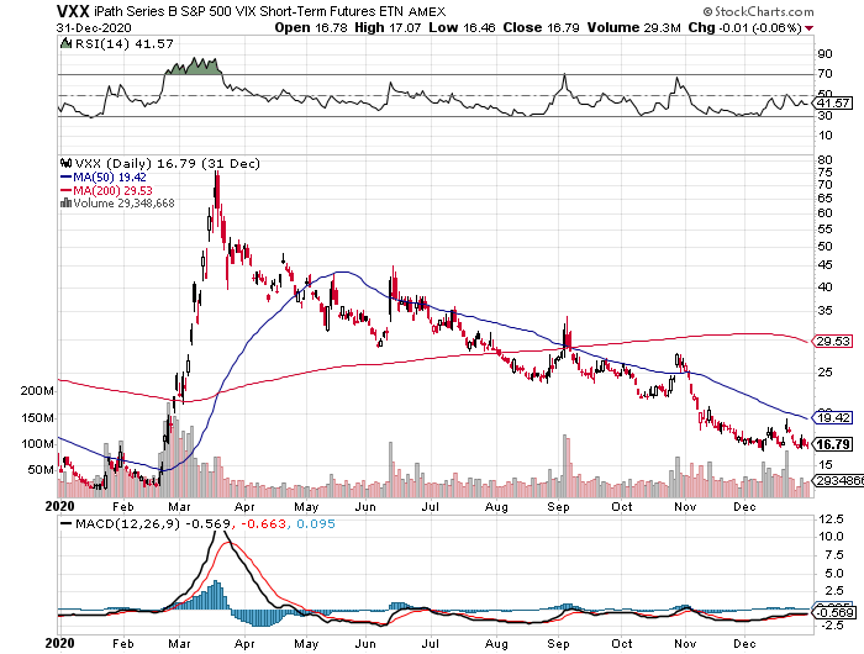
Easily my worst asset class of the year was with volatility, selling short the iPath Series B S&P 500 VIX Short Term Volatility ETN (VXX). I was dead right with the direction of the move, with the (VIX) falling from $80 to $20. But my timing was off, with time decay eating me up. I lost 7.29% on six trades.
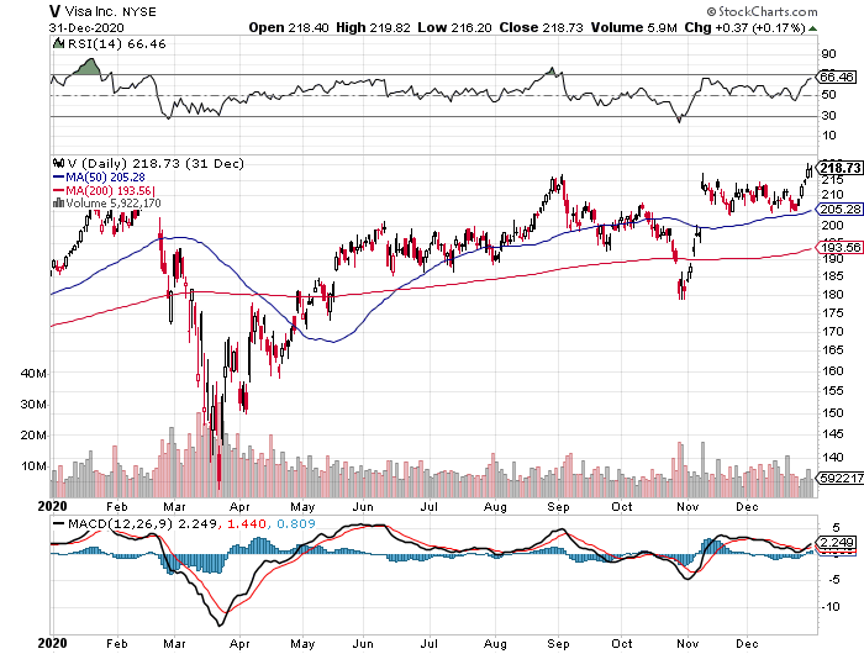
Two trades in credit card processor Visa (V) cost me 4.37%. I had a nice profit in hand. Then right before expiration, rumors of antitrust action from the administration emerged, a spate of bad economic data was printed, and an expensive acquisition took place.
I call this getting snakebit when unpredictable events come out of the blue to force you out of positions. Visa shares later rose by an impressive 22% in two months.
I lost another 0.99% on my one oil trade of the year with the United States Oil Fund (USO), buying when Texas tea was at negative -$5.00 and stopping out at negative $15.00. Oil eventually fell to negative -$37.00.
Go figure.
I didn’t offer any foreign exchange trades in 2020. I got the collapse of the US dollar absolutely right, but the moves were so small and so slow they could compete with what was going on in equities and bonds.
However, I played the weak dollar in other ways, with bullish calls in commodities and bearish ones in bonds. It always works.
Anyway, it’s a New Year and we work in the “You’re only as good as your last trade” business. 2021 looks better than ever, with a 5% profit straight out of the gate during the first five trading days.
It really is the perfect storm for equities, with $10 trillion about to hit the US economy, most of which will initially go into the stock market.
Good luck and good trading.
John Thomas
CEO & Publisher
The Diary of a Mad Hedge Fund Trader
Global Market Comments
January 8, 2021
Fiat Lux
Featured Trade:
(JANUARY 6 BIWEEKLY STRATEGY WEBINAR Q&A),
(TSLA), (SQM), (GLD), (SLV), (GOLD), (WPM), (TLT), (FCX), (IBB), (XOM), (UPS), (FDX), (ZM), (DOCU), (VZ), (T), (RTX), (UT), (NOC),
(FXE), (FXY), (FXA), (UUP)
Below please find subscribers’ Q&A for the January 6 Mad Hedge Fund Trader Global Strategy Webinar broadcast from Incline Village, NV.
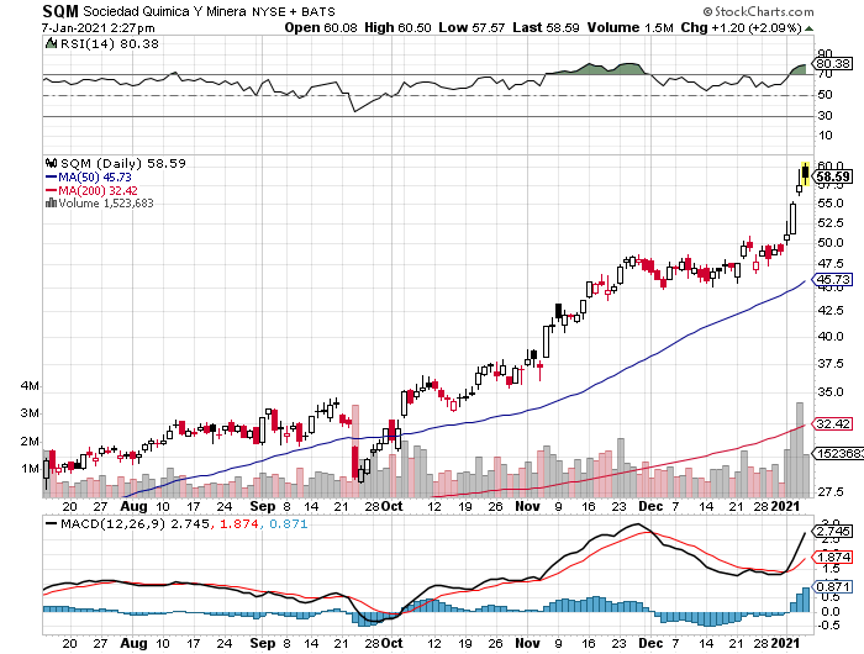
Q: Any thoughts on lithium now that Tesla (TSLA) is doing so well?
A: Lithium stocks like Sociedad Qimica Y Minera (SQM) have been hot because of their Tesla connection. The added value in lithium mining is minimal. It basically depends on the amount of toxic waste you’re allowed to dump to maintain profit margins—nowhere close to added value compared to Tesla. However, in a bubble, you can't underestimate the possibility that money will pour into any sector massively at any time, and the entire electric car sector has just exploded. Many of these ETFs or SPACs have gone up 10 times, so who knows how far that will go. Long term I expect Tesla to wildly outperform any lithium play you can find for me. I’m working on a new research piece that raises my long-term target from $2,500 to $10,000, or 12.5X from here, Tesla becomes a Dow stock, and Elon Musk becomes the richest man in the world.
Q: Won’t rising interest rates hurt gold (GLD)? Or are inflation and a weak dollar more important?
A: You nailed it. As long as the rate rise is slow and doesn't get above 1.25% or 1.50% on the ten-year, gold will continue to rally for fears of inflation. Also, if you get Bitcoin topping out at any time, you will have huge amounts of money pour out of Bitcoin into the precious metals. We saw that happen for a day on Monday. So that is your play on precious metals. Silver (SLV) will do even better.
Q: What are your thoughts on TIPS (Treasury Inflation Protected Securities) as a hedge?
A: TIPS has been a huge disappointment over the years because the rate of rise in inflation has been so slow that the TIPS really didn’t give you much of a profit opportunity. The time to own TIPS is when you think that a very large increase in inflation is imminent. That is when TIPS really takes off like a rocket, which is probably a couple of years off.
Q: Will Freeport McMoRan (FCX) continue to do well in this environment?
A: Absolutely, yes. We are in a secular decade-long commodity bull market. Any dip you get in Freeport you should buy. The last peak in the previous cycle ten years ago was $50, so there's another potential double in (FCX). I know people have been playing the LEAPS in the calendars since it was $4 a share in March and they have made absolute fortunes in the last 9 months.
Q: Is it a good time to take out a bear put debit spread in Tesla?
A: Actually, if you go way out of the money, something like a $1,000-$900 vertical bear put spread, with the 76% implied volatility in the options market one week out, you probably will make some pretty decent money. I bet you could get $1,500 from that. However, everyone who has gone to short Tesla has had their head handed to them. So, it's a high risk, high return trade. Good thought, and I will actually run the numbers on that. However, the last time I went short on Tesla, I got slaughtered.
Q: Any thoughts on why biotech (IBB) has been so volatile lately?
A: Fears about what the Biden government will do to regulate the healthcare and biotech industry is a negative; however, we’re entering a golden age for biotech invention and innovation which is extremely positive. I bet the positives outweigh the negatives in the long term.
Q: Oil is now over $50; is it a good time to buy Exxon Mobil (XOM)?
A: Absolutely not. It was a good time to buy when it was at $30 dollars and oil was at negative $37 in the futures market. Now is when you want to start thinking about shorting (XOM) because I think any rally in energy is short term in nature. If you’re a fast trader then you probably can make money going long and then short. But most of you aren't fast traders, you’re long-term investors, and I would avoid it. By the way, it’s actually now illegal for a large part of institutional America to touch energy stocks because of the ESG investing trend, and also because it’s the next American leather. It’s the next former Dow stock that’s about to completely disappear. I believe in the all-electric grid by 2030 and oil doesn't fit anywhere in that, unless they get into the windmill business or something.
Q: With Amazon buying 11 planes, should we be going short United Parcel Service (UPS) and FedEx (FDX)?
A: Absolutely not. The market is growing so fast as a result of an unprecedented economic recovery, it will grow enough to accommodate everyone. And we have already had huge performance in (UPS); we actually caught some of this in one of our trade alerts. So again, this is also a stay-at-home stock. These stocks benefited hugely when the entire US economy essentially went home to go to work.
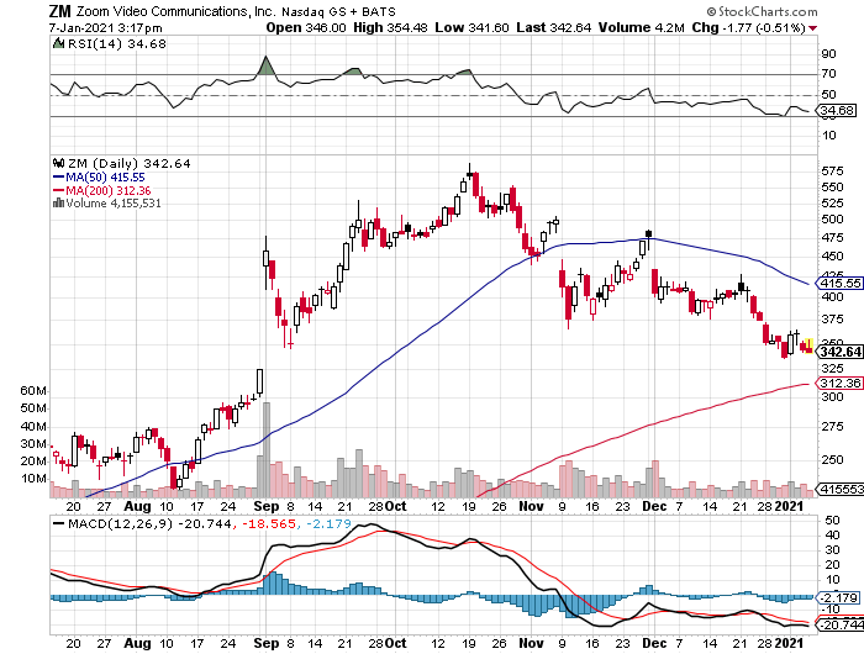
Q: Should we keep our stay-at-home stocks like DocuSign (DOCU), Zoom (ZM), and UPS (UPS)?
A: They are way overdue for profit-taking and we will probably see some of that; but long term, staying at home is a permanent fixture of the US economy now. Up to 30% of the people who were sent to work at home are never coming back. They like it, and companies are cutting their salaries and increasing their profits. So, stay at home is overdone for the short term, but I think they’ll keep going long term. You do have Zoom up 10 times in a year from when we recommended it, it’s up 20 times from its bottom, DocuSign is up like 600%. So way overdone, in bubble-type territory for all of these things.
Q: Are telecom stocks like Verizon (VZ) and AT&T (T) safe here?
A: Actually they are; they will benefit from any increase in infrastructure spending. They do have the 5G trend as a massive tailwind, increasing the demand for their services. They’re moving into streaming, among other things, and they had very high dividends. AT&T has a monster 7% dividend, so if that's what you’re looking for, we’re kind of at the bottom of the range on (T), so I would get involved there.
Q: Should we sell all our defense stocks with the Biden administration capping the defense budget?
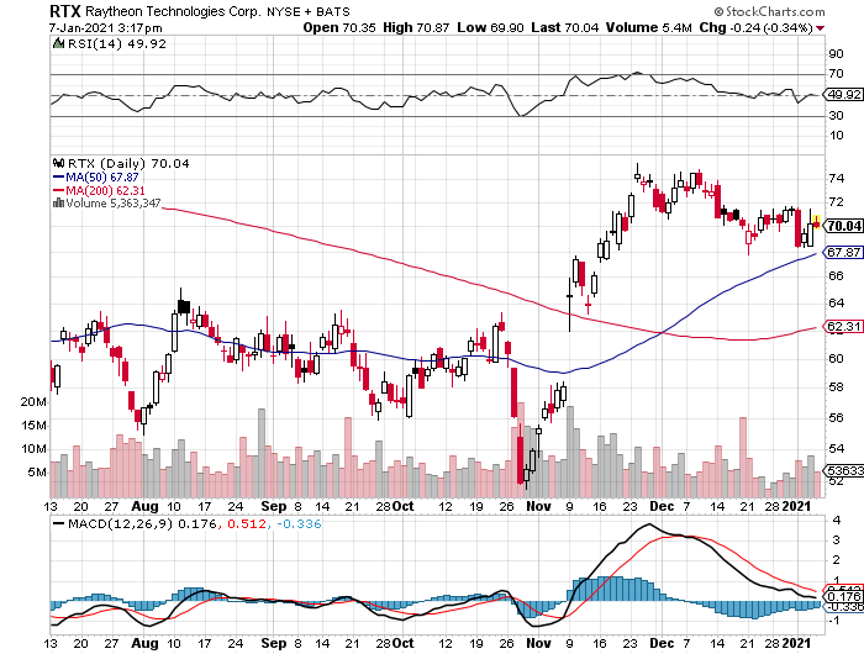
A: I probably would hold them for the long term—Biden won’t be president forever—but short term the action is just going to be elsewhere, and the stocks are already reflecting that. So, Raytheon (RTX), United Technologies (UT), and Northrop Grumman (NOC), all of those, you don’t really want to play here. Yes, they do have long term government contracts providing a guaranteed income stream, but the market is looking for more immediate profits, or profit growth like you have been getting in a lot of the domestic stocks. So, I expect a long sideways move in the defense sector for years. Time to become a pacifist.
Q: Is it safe to buy hotels like Marriott (MAR), Hyatt (H), and Hilton (HLT)?
A: Yes, unlike the airlines and cruise lines, which have massive amounts of debt, the hotels from a balance sheet point of view actually have come through this pretty well. I expect a decent recovery in the shares, probably a double. Remember you’re not going to see any return of business travel until at least 2022 or 2023, and that was the bread and butter for these big premium hotel chains. They will recover, but that will take a bit longer.
Q: How about online booking companies like Expedia (EXPE) and Booking Holdings Inc, owner of booking.com, Open Table, and Priceline (BKNG)?
A: Absolutely; these are all recovery stocks and being online companies, their overhead is minimal and easily adjustable. They essentially had to shut down when global travel stopped, but they don’t have massive debts like airlines and cruise lines. I actually have a research piece in the works telling you to buy the peripheral travel stocks like Expedia (EXPE), Booking Holdings (BKNG), Live Nation (LYV), Madison Square Garden (MSGE) and, indirectly, casinos (WYNN), (MGM) and Uber (UBER).
Q: What about Regeneron (REGN) long term?
A: They really need to invent a new drug to cure a new disease, or we have to cure COVID so all the non-COVID biotech stocks can get some attention. The problem for Regeneron is that when you cure a disease, you wipe out the market for that drug. That happened to Gilead Sciences (GILD) with hepatitis and it’s happening with Regeneron now with Remdesivir as the pandemic peaks out and goes away.
Q: What about Chinese stocks (FXI)?
A: Absolutely yes; I think China will outperform the US this year, especially now that the new Biden administration will no longer incite trade wars with China. And that is of course the biggest element of the emerging markets ETF (EEM).
Q: Will manufacturing jobs ever come back to the US?
A: Yes, when American workers are happy to work for $3/hour and dump unions, which is what they’re working for in China today. Better that America focuses on high added value creation like designing operating systems—new iPhones, computers, electric cars, and services like DocuSign, Zoom—new everything, and leave all the $3/hour work to the Chinese.
Q: What about long-term LEAPS?
A: The only thing I would do long term LEAPS in today would be gold (GOLD) and silver miners (WPM). They are just coming out of a 5-month correction and are looking to go to all-time highs.
Q: What about your long-term portfolio?
A: I should be doing my long-term portfolio update in 2 weeks, which is much deserved since we have had massive changes in the US economy and market since the last one 6 months ago.
Q: Do you have any suggestions for futures?
A: I suggest you go to your online broker and they will happily tell you how to do futures for free. We don’t do futures recommendations because only about 25% of our followers are in the futures market. What they do is take my trade alerts and use them for market timing in the futures market and these are the people who get 1,000% a year returns. Every year, we get several people who deliver those types of results.
Q: Will people go back to work in the office?
A: People mostly won’t go back to the office. The ones who do go back probably won't until the end of the summer, like August/September, when more than half the US population has the Covid-19 vaccination. By the way, getting a vaccine shot will become mandatory for working in an office, as it will in order to do anything going forward, including getting on any international flights.
Q: What is the best way to short the US dollar?
A: Buy the (FXE), the (FXY), the (FXA), or the (UUP) basket.
Q: Silver LEAP set up?
A: I would do something like a $32-$35 vertical bull call spread on options expiring in 2023, or as long as possible, and that increases the chance you’ll get a profit. You should be able to get a 500% profit on that LEAP if silver keeps going up.
Q: What about agricultural commodities?
A: Ah yes, I remember orange juice futures well, from Trading Places, where I also once made a killing myself. Something about frozen iguanas falling out of trees was the tip-off. We don’t cover the ags anymore, which I did for many years. They are basically going down 90% of the time because of the increasing profitability and efficiency of US farmers. Except for the rare weather disaster or an out of the blue crop disease, the ags are a loser’s game.
Q: Can we view these slides?
A: Yes, we load these up on the website within two hours. If you need help finding it just send an email or text to our ever loyal and faithful Filomena at support@madhedgefundtrader.com and she will direct you.
Q: Do you have concerns about Democrats regulating bitcoin?
A: Yes, I would say that is definitely a risk for Bitcoin. It is still a wild west right now and there are massive amounts of theft going on. It is a controlled market, with bitcoin miners able to increase the total number of points at any time on a whim.
Good Luck and Stay Healthy
John Thomas
CEO & Publisher
The Diary of a Mad Hedge Fund Trader
Global Market Comments
December 11, 2020
Fiat Lux
FEATURED TRADE:
(DECEMBER 9 BIWEEKLY STRATEGY WEBINAR Q&A),
(GLD), (FXA), (FXE), (FXC), (UUP), (FXB), (ABNB), (DASH), (TAN), (TLT), (TBT), (NZD), (DKNG), (SNOW), (AAPL), (CRSP), (RTX), (NOC)
Below please find subscribers’ Q&A for the December 9 Mad Hedge Fund Trader Global Strategy Webinar broadcast from Incline Village, NV with my guest and co-host Bill Davis.
Q: Is gold (GLD) about ready to turn around from here?
A: The gold bottom will be easy to call, and that’s when the Bitcoin top happens. In fact, we have a double top risk going on in Bitcoin right now, and we had a little bit of a rally in gold this week as a result. So, longer term you need actual inflation to show up to get gold any higher, and we may actually get that in a year or two.
Q: The US dollar (UUP) has been weak against most currencies including the Canadian dollar (FXC), but Canada has the same problems as the US, but worse regarding debt and so on. So why is the Canadian dollar going up against the US dollar?
A: Because it’s not the US dollar. Canada also has an additional problem in that they export 3.7 million barrels a day of oil to the US and the dollar value have been in freefall this year. Canada has the most expensive oil in the world. So, taking that out of the picture, the Canadian dollar still would be negative, and for that reason I've been recommending the Australian dollar (FXA) as my first foreign currency pick, looking for 1:1 over the next three years. Of the batch, the Canadian dollar is probably going to be the weakest, Australian dollar the strongest, and the Euro (FXE) somewhere in the middle. I don’t want to touch the British pound (FXB) as long as this Brexit mess is going on.
Q: Would you buy the IPO’s Airbnb (ABNB) and Dash (DASH)?
A: No on Dash. The entries to new competitors are low. Airbnb on the other hand is now the largest hotel in the world, and it just depends on what price it comes out at. If it comes out at a stupid price, like 50% over the IPO, I wouldn’t bother; but if you can get close to the IPO price, I would probably buy it for the long term. I think you would have another double if we got close to the IPO price, so that is worth doing. They have been absolutely brilliant in their management and the way they handled the pandemic; they basically captured all the hotel business because if you rent an apartment all by yourself, the COVID risk is much lower than if you go into a Hilton or another hotel. They also made a big push on local travel which was successful. They gave up long-distance travel, and they’re now trying to get you to explore your own area; and that worked beyond all expectations. Even I have rented some Airbnb’s out in the local area like in Carmel, Monterey, Mendocino, and so on and I came back disease-free.
Q: If the United States Treasury Bond Fund (TLT) goes to a 1.00% yield, what would that translate to in the (TBT) (2x short treasury ETF)?
A: My guess is probably about $18, which has been upside resistance for a long time, but it depends on how long it takes to get there. You have about a 3% a year cost of carry on the TBT that you don’t have in Treasuries.
Q: Should we buy China stocks when the current administration is so negative on China?
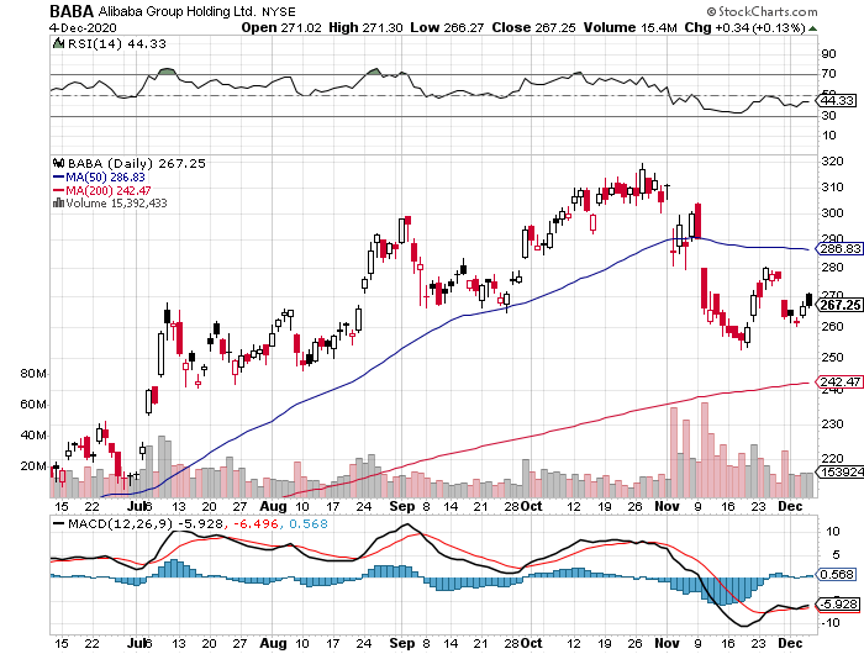
A: Yes, that’s when you buy them—when the current administration is negative on China; because when you get an administration that’s less negative on China, the Chinese stocks will all rocket. There’s an easy 20-30% in most of the headline Chinese stocks from here sometime in 2021. And I'm looking to add more Chinese stocks. I currently have Alibaba (BABA), and that’s working well. I want to pick up some more.
Q: What about the New Zealand currency ETF (NZD)?
A: It pretty much moves in sync with the Australian dollar, but it’s usually a few cents cheaper and more volatile.
Q: Legalized sports betting seems to be on the upswing. Where do you see DraftKings (DKNG) going?
A: I think it goes up. I think there’s going to be a recovery in all kinds of entertainment type activities. Draft Kings got a huge market share from the pandemic which they will probably keep.
Q: Do we use spreads when playing (FXA)?
A: Yes, you can probably do something like a $70-$72 here one month out and make some decent money.
Q: How do you feel about Snowflake (SNOW)?
A: I wanted to get into this from day one, but it doubled on the IPO, and then it doubled again. It’s one of the only technology stocks Warren Buffet has bought in the last several years besides Apple (AAPL). So, it’s just too popular right now, it’s hotter than hot. They have a dominant market share in their big data platform, so it’s a great place to be but it’s really expensive now.
Q: Do your options trade alerts have any risk of assignment?
A: Yes, they do, but when you get an assignment it’s a gift, because they’re taking you out of your maximum profit point, weeks before the expiration. All you do is tell your broker to use your long position to cover your short position, and you will get the 100% profit right then and there. I say this because the brokers always tell you to do the wrong thing when you get an assignment, such as going into the market to close out each leg separately. That is a huge mistake, and only makes money for the brokers. For more details, log in and search for “assignments” at www.madhedgefundtrader.com
Q: Congratulations on your great performance; what could derail your bullish prediction?
A: Well, we’ve already had a pandemic so obviously that’s not it, and then you have to run by your usual reasons for an out-of-the-blue crash; let’s say Donald Trump doesn't leave the presidency. That would be worth a few thousand points of downside. So would a major war. We could have both; we could have a major war before a disrupted inauguration. The president has essentially unlimited ability to go to war at any time, so there aren’t too many negatives on the near-term horizon, which is why everyone is super bullish.
Q: What’s your opinion on the solar area, stocks like First Solar (FSLR) and the Invesco Solar ETF (TAN)?
A: I’m bullish. Even though they're over 300% since March, we’re about to enter the golden age of solar. Biden wants to install 500,000 solar panels next year and provide the subsidies to accomplish that. This all looks extremely positive for solar. In California, a lot of people will go solar, because getting an independent power supply protects you from the power shut-offs that happen every time the wind picks up, in which response to wildfire danger. We had ten days of statewide power blackouts this year.
Q: What are your thoughts on lithium?
A: I’m not a big believer in lithium because there is no short supply. The key to producing lithium is finding countries with no environmental controls whatsoever because it’s a very polluting and messy process to mine. Better to let other countries mine your lithium cheap, refine it, and then send it to you in finished form.
Q: Since you love CRISPR (CRSP) at $130, what about shorting naked puts? The premiums are really high.
A: I never advocate shorting naked puts. Occasionally, I will at extreme market bottoms like we had in March, but even then, I do it only on a 1 for 1 basis, meaning don’t use any leverage or margin. Never short any more puts than you’re willing to buy the stock lower down. People regularly see the easy money, sell short too many puts, and then get a market correction and a total wipeout of their capital. And they won't have to do that liquidation themselves; their broker will do it for them. They’ll do a forced liquidation of your account and then close it because they don't want to be left holding the bag on any excess losses. You won’t find out until afterwards. So, I would not recommend shorting naked puts for the normal investor. If you want to be clever, just buy an in-the-money call spread, something like a $110-$120 out a couple of months. That's probably a far better risk reward than shorting a naked put. By the way, I came close to wiping out Solomon Brothers 30 years ago because my hedge fund was short too many Nikkei Puts. In the end, I made a fortune, but only after a few sleepless nights (remember that Mark?).
Q: What do you think about defense stock right now?
A: I’m avoiding defense stock because I don’t see any big increases in defense spending in the future administration, and that would include Raytheon (RTX), Northrop Grumman (NOC), and some of the other big defense stocks.
SEE YOU ALL IN 2021!
Good Luck and Stay Healthy.
John Thomas
CEO & Publisher
The Diary of a Mad Hedge Fund Trader
Global Market Comments
December 7, 2020
Fiat Lux
FEATURED TRADE:
(MARKET OUTLOOK FOR THE WEEK AHEAD, or A DICEY LANDING)
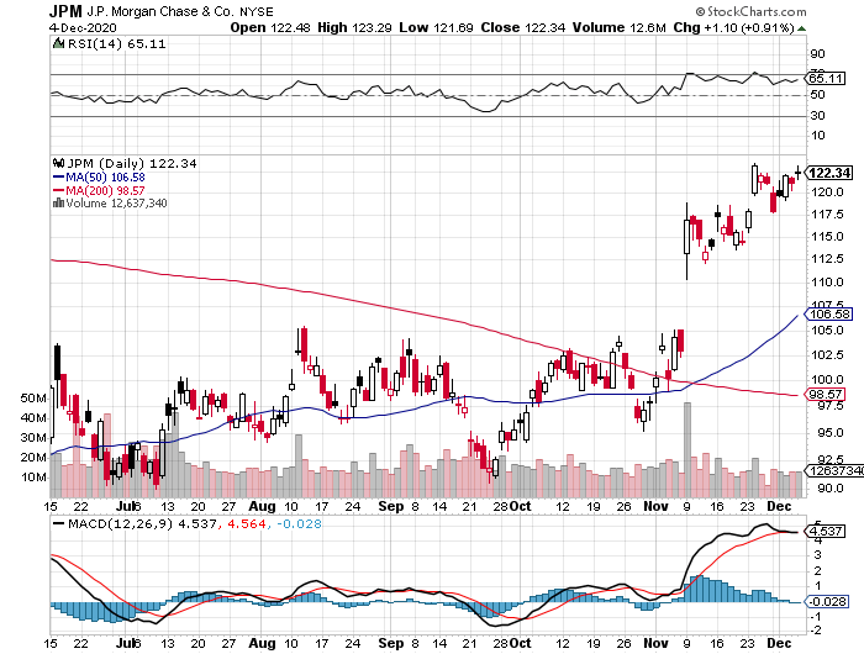
(SPY), (TLT), (AMZN), (TSLA), (CRM), (JPM), (CAT), (BABA),
(FCX), (GLD), (SLV), (UUP), (FXE), (FXA), (FXB), (FXY), (FXI), (EWZ), (THD), (EPU)
Landing my 1932 de Havilland Tiger Moth biplane can be dicey.
For a start, it has no brakes. That means I can only land on grass fields and hope my tail skid catches before I run out of landing strip. If it doesn’t, the plane will hit the end, nose over, and dump a fractured gas tank on top of me. Bathing in 30 gallons of 100 octane gasoline with sparks flying is definitely NOT a good long term health plan.
The stock market is starting to remind me of landing that Tiger Moth. On Friday, all four main stock indexes closed at all-time highs for the first time since pre-pandemic January. A record $115 billion poured into equity mutual funds in November. This has all been the result of multiple expansion, not newfound earnings.
Yet, stocks seem hell-bent on closing out 2020 at the highs.
And there is a major factor that the market is completely ignoring. What if the Democrats win the Senate in Georgia?
If so, Biden will have the weaponry to go bold. The economy goes from zero stimulus to maybe $6 trillion raining down upon it over the next six months. That will go crazy, possibly picking up another 10%, or 3,000 Dow points on top of the post-election 4,000 points we have seen so far.
That is definitely NOT in the market.
The other big decade-long trend that is only just starting is the weak US dollar. Lower interest rates for longer were reaffirmed by the appointment of my former economics professor Janet Yellen as Treasury Secretary.
A feeble dollar brings us a fading bond market, as half the buyers are foreigners. A sickened greenback also provides the launching pad for all non-dollar assets to take off like a rocket, including commodities (FCX), precious metals (GLD), (SLV), Bitcoin, and the currencies (UUP), (FXE), (FXA), (FXB), (FXY), and emerging stock markets like China (FXI), Brazil (EWZ), Thailand (THD), and Peru (EPU).
All of this is happening in the face of a US economy that is clearly falling apart. Weekly jobless claims for November came in at 245,000, compared to a robust 638,000 in October, taking the headline unemployment rate down to 6.9%. The real U6 unemployment rate stands at an eye-popping 12.0%, or 20 million.
Some 10.7 million remain jobless, 900,000 higher than in February. Transportation and Warehousing were up 140,000, Professional & Business Services by 60,000, and Health Care 46,000. Retail was down 35,000 as stores shut down at a record pace.
OPEC cuts a deal, adding 500,000 barrels a day to the global supply. The hopes are that a synchronized global recovery can take additional supply. Texas tea finally busts through a month's long $44 cap, the highest since March. Avoid energy. I’d rather buy more Tesla, the anti-energy.
Black Friday was a disaster, with in-store shopping down 52%. Long lines and 25% capacity restrictions kept the crowds at bay. If you don’t have an online presence, you’re dead. In the meantime, online spending surged by 26%.
Amazon (AMZN) hires 437,000 in 2020, probably the greatest hiring binge since WWII, and is continuing at the incredible rate of 3,000 a week. That takes its global workforce to 1.2 million. Most are $12 an hour warehouse and delivery positions. The company has been far and away the biggest beneficiary of the pandemic as the world rushed to online commerce.
Tesla’s (TSLA) full self-driving software may be out in two weeks, instead of the earlier indicated two years. The current version only works on freeways. The full street to street version could be worth $8,000 a car in upgrades. Another reason to go gaga over Tesla stock.
Goldman Sachs raised Tesla target to $780, the Musk increased market share to a growing market. No threat from General Motors yet, just talk. Volkswagen is on the distant horizon. In the meantime, Tesla super bear Jim Chanos announced he is finally cutting back his position. He finally came to the stunning conclusion that Tesla is not being valued as a car company. Go figure. Short interest in Tesla has plunged from a peak of 35% in March to 6% today. It’s learning the hard way.
The U.S. manufacturing sector pauses, activity in the U.S. manufacturing sector barely ticked up in November as production and new orders cratered, data from a survey compiled by the Institute for Supply Management showed on Tuesday. The ISM Manufacturing Report on Business PMI for November stood at 57.5, slipping from 59.3 in October.
Salesforce (CRM) overpays for workplace app Slack, knocking its stock down 9%. This is worth a buy the dip trade in the short-term and this is still a great tech company which is why the Mad Hedge Tech Letter sent out a tech alert on Salesforce on the dip.
Weekly Jobless Claims dive, with Americans applying for unemployment benefits falling last week to 712,000 down from 787,000 the week before. The weakness is unsurprising as we head into seasonal Christmas hiring.
The end of the tunnel for Boeing (BA) as they bring to an end an awful 2020. Irish-based airline Ryanair Holdings placed a large order for a set of brand new Boeing 737 MAX aircraft, giving the plane maker a shot in the arm as the single-aisle jet comes off an unprecedented 20-month grounding.
Ryanair, Europe’s low-cost carrier, has 135 Boeing 737 MAX jets on order and options to bring the total to 200 or more. Hopefully, they won’t crash this time around. My fingers are crossed.
Dollar Hits 2-1/2 Year Low. With global economies recovering, the next big-money move will be out of the greenback and into the Euro (FXE), the Aussie (FXA), the Looney (FXC), the Japanese yen (FXY), the British pound (FXB), and Bitcoin. Keeping interest rates lower for longer will accelerate the downtrend.
When we come out the other side of this pandemic, we will be perfectly poised to launch into my new American Golden Age, or the next Roaring Twenties. With interest rates still at zero, oil cheap, there will be no reason not to. The Dow Average will rise by 400% to 120,000 or more in the coming decade. The American coming out the other side of the pandemic will be far more efficient and profitable than the old. Dow 120,000 here we come!
My Global Trading Dispatch catapulted to another new all-time high. December is up 5.34%, taking my 2020 year-to-date up to a new high of 61.78%.
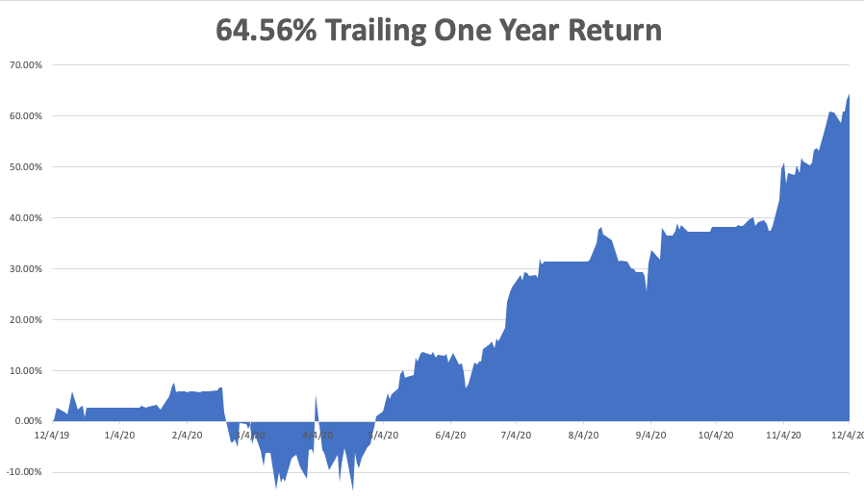
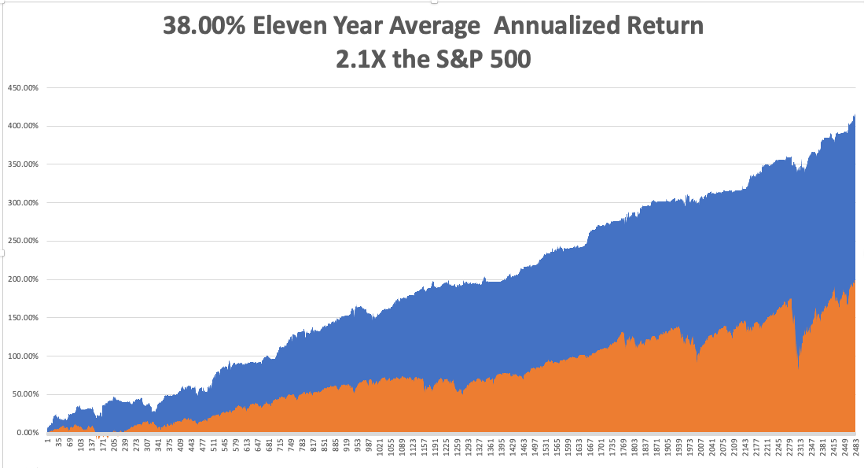
That brings my eleven-year total return to 417.69% or double the S&P 500 over the same period. My 11-year average annualized return now stands at a nosebleed new high of 38.00%. My trailing one-year return exploded to 64.56%. I’m running out of superlatives, so there!
I managed to catch the 50%, two-week Tesla melt-up with a 5X long position, which is always nice for performance.
The coming week will be a slow one on the data front. We also need to keep an eye on the number of US Coronavirus cases at 14.5 million and deaths at 285,000, which you can find here.
When the market starts to focus on this, we may have a problem.
On Monday, December 7 at 4:00 PM EST, US Consumer Credit is out.
On Tuesday, December 8 at 11:00 AM, the NFIB Business Optimism Index is published.
On Wednesday, December 9 at 8:00 AM, MBA Mortgage Applications for the previous week are released.
On Thursday, December 10 at 8:30 AM, the Weekly Jobless Claims are published. At 9:30 AM, US Core Inflation is printed.
On Friday, November 11, at 9:30 AM EST, the US Producer Price Index is announced. At 2:00 PM, we learn the Baker-Hughes Rig Count.
As for me, at least there is one positive outcome from the pandemic. Boy Scout Christmas tree sales are absolutely through the roof! We took delivery of 1,300 trees from Oregon for our annual fundraiser expected to sell them in two weeks. We cleared out our entire inventory in a mere six days!
We sold trees as fast as we could load them. With the scouts tying the knots, only one fell onto the freeway on the way home. An “all hands on deck” call has gone out to shift the inventory.
It turns out that tree sales are booming nationally. The $2 billion a year market places 21 million trees annually at an average price of $8 and are important fundraisers for many non-profit organizations. It seems that people just want something to feel good about this year.
Governor Gavin Newsome’s order to go into a one-month lockdown Sunday night inspired the greatest sales effort I have ever seen, and I worked on a Morgan Stanley sales desk! We shifted the last tree hours before the deadline, which was full of mud with broken branches and had clearly been run over by a truck at a well-deserved 50% discount.
I can’t wait until next year!
Stay healthy.
John Thomas
CEO & Publisher
The Diary of a Mad Hedge Fund Trader
Legal Disclaimer
There is a very high degree of risk involved in trading. Past results are not indicative of future returns. MadHedgeFundTrader.com and all individuals affiliated with this site assume no responsibilities for your trading and investment results. The indicators, strategies, columns, articles and all other features are for educational purposes only and should not be construed as investment advice. Information for futures trading observations are obtained from sources believed to be reliable, but we do not warrant its completeness or accuracy, or warrant any results from the use of the information. Your use of the trading observations is entirely at your own risk and it is your sole responsibility to evaluate the accuracy, completeness and usefulness of the information. You must assess the risk of any trade with your broker and make your own independent decisions regarding any securities mentioned herein. Affiliates of MadHedgeFundTrader.com may have a position or effect transactions in the securities described herein (or options thereon) and/or otherwise employ trading strategies that may be consistent or inconsistent with the provided strategies.

