Below please find the subscribers’ Q&A for the February 22 Mad Hedge Fund Trader Global Strategy Webinar broadcast from Silicon Valley in California.
Q: Will Russia use nuclear weapons on Ukraine?
A: No, they won’t. If you’re trying to take over a country, you don’t exactly want to drop atomic bombs on it first and render it useless. If they do, Ukraine will retaliate in kind with the nukes they have. Most of the nuclear weapons the old Soviet Union had were assembled in Ukraine and the machinery is still there. We know Ukraine has four nuclear power plants and hundreds of tons of fuel so they have uranium. You only need to increase the purity from 80% to 93% and then convert it to plutonium to get weapons-grade and you only need 20 pounds to make a small bomb. At the very least, they could build a dirty truck bomb and make Moscow uninhabitable for 100 years. If the Russians did explode a nuke, the fallout cloud would blow back on them the next day, China in three days, the US in 10 days, and back on Russia again in two weeks. If Ukraine doesn’t remember how to make nuclear weapons, they can just ask me. I do have “Nuclear Test Site” on my resume.
Q: What would be the impact on the markets of a government debt default?
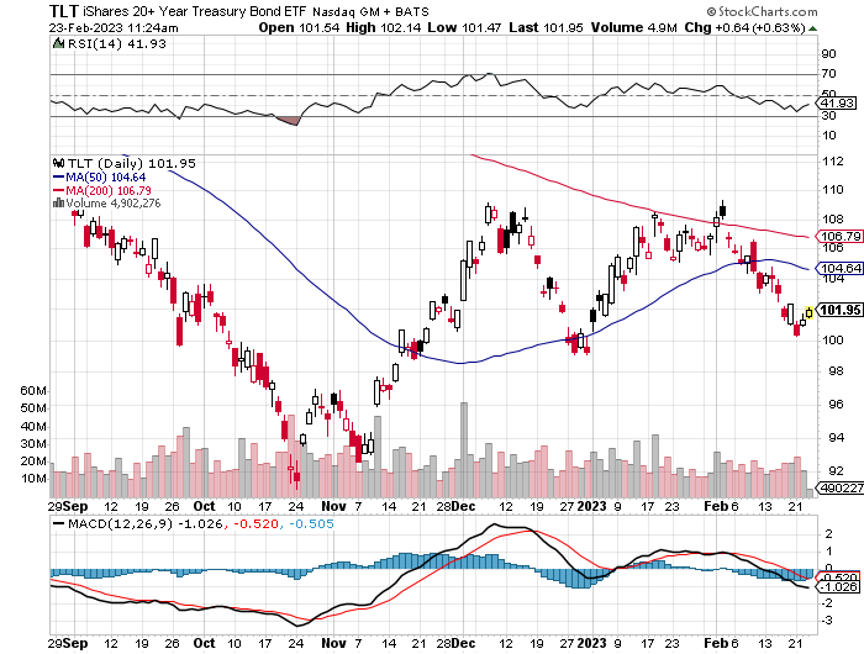
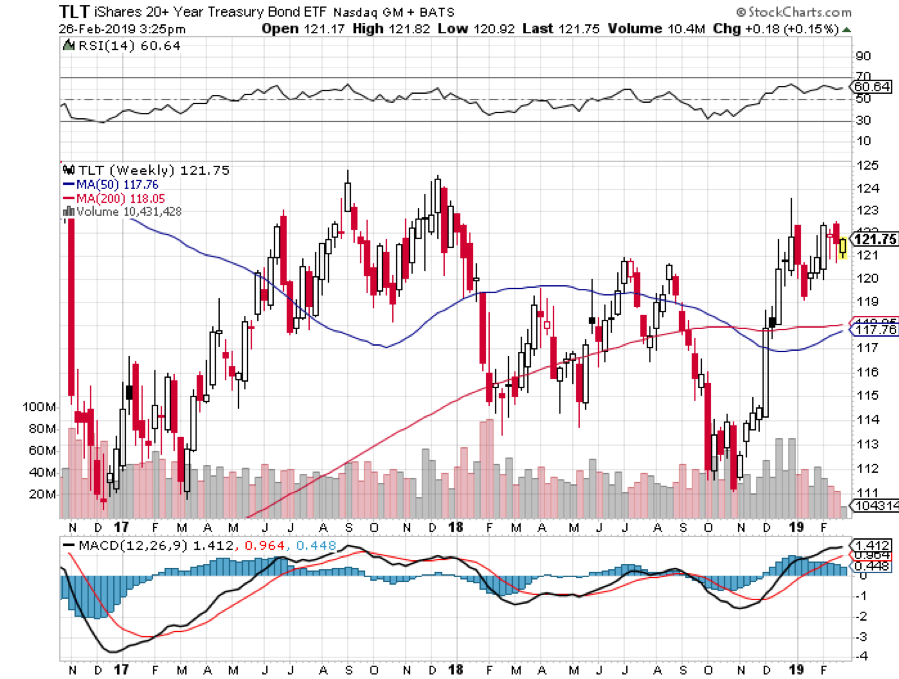
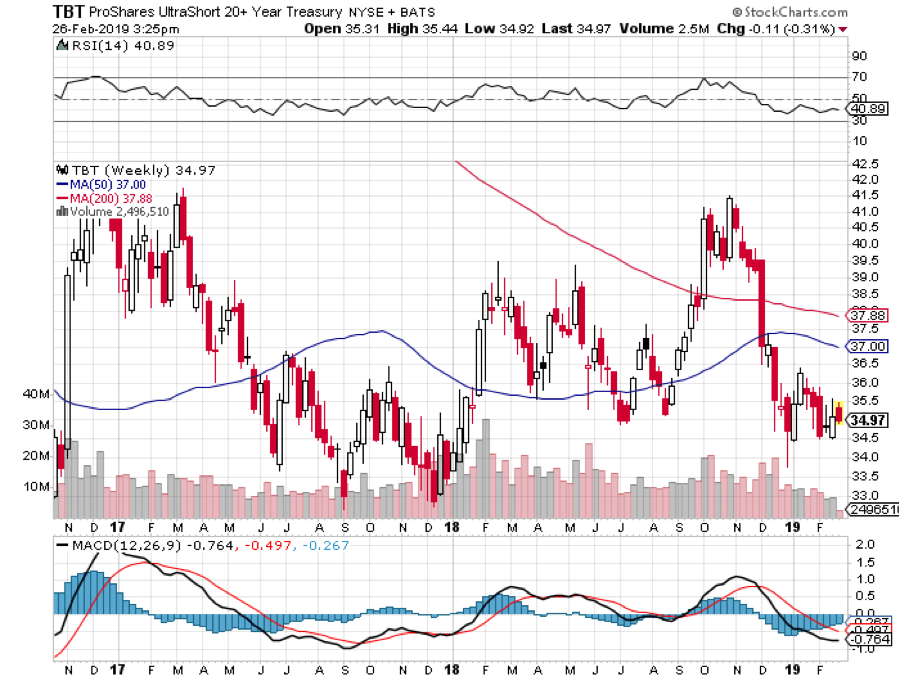
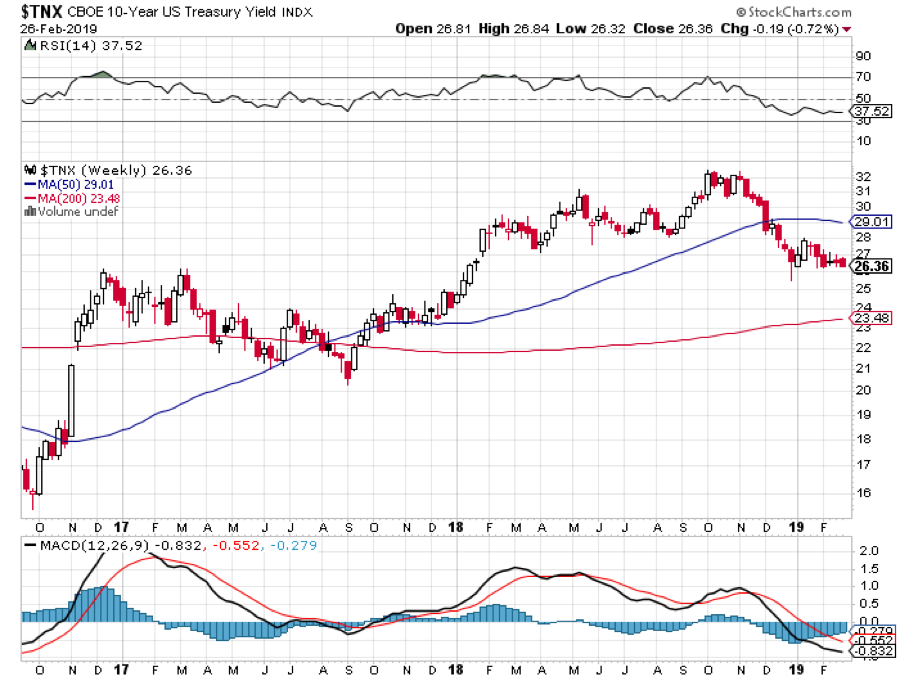
A: Bonds would collapse, causing interest rates to spike, and taking down stocks big time. Higher interest rates would crash the real estate market. You also can’t do real estate closings during a shutdown because Fannie Mae and Freddie Mac aren’t there to buy the debt. Commodities would fall sharply on recession fears. Even gold and silver do poorly on a massive liquidity squeeze. Government payments would cease, including Social Security, Medicare, and military salaries. Air traffic control would stop unless they are happy to work for free. The only place to hide is cash under your mattress since US Treasury bills and commercial banks will also be at risk. This is what the House Republicans are risking. It really depends on how long the shutdown lasts. Every time Georgia representative Marjorie Taylor Greene shouted “liar” at the State of the Union address you could see bond prices ticking down. She is one of the people who has to agree to a rise in the debt ceiling and she didn’t inspire a lot of confidence in bondholders. All that said, a $10 dip is a good place to buy the (TLT).
Q: Would you buy Boeing up here?
A: I loved Boeing at $100 and we did a could trades down there. At $220 not so much. It’s more than doubled off the October low and all the best-case scenarios have happened. The 737 MAX, which crashed twice due to an AI issue, got back in the air. The 787 Dreamliner is selling well. The company now has a two-year order backlog. And Air India followed up with the biggest aircraft order in history, some 450 planes over ten years. If Boeing dips $50 that would be another story because I think it hits a new all-time high at $450 in a couple of years. By the way, I took a 737 MAX on my flight back from Hawaii last weekend and the crew loved it. There are no screens on the seats. Instead, they broadcast the 800 greatest movies of all time on free WIFI.
Q: How do we know if your trade alert is for the stock, the ETF, or another underlying position?
A: Look at the ticker symbol—it always tells you exactly which security we are working in.
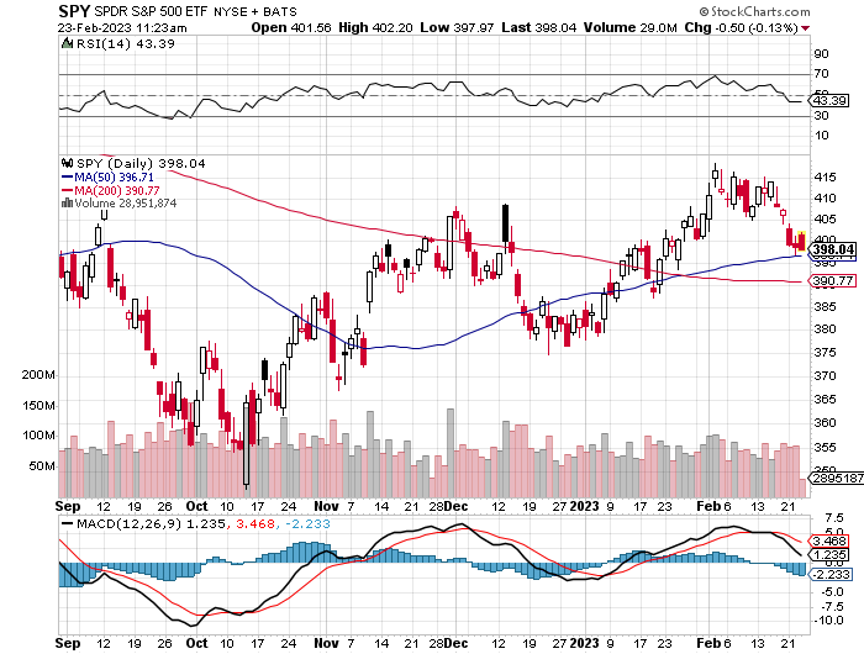
Q: With Bullard signaling a 50 basis-point rate hike, will the S&P (SPY) go down in the near term and how much?
A: Well Bullard is only one guy out of nine, so he doesn’t have the final say. It really depends on what Jay Powell wants. And if the data continues hot and inflation keeps rising, we will get a 50 basis point rise, and that should take the index down 10% from the recent high, or give up half of its recent year-to-date gains, so that’s a good rule of thumb. As long as we’re waiting for bad news, (which we won’t get until March 22) the markets will do nothing until then.
Q: What do you think about Crown Castle International (CCI), the cell tower company, taking a big hit with the bond market?
A: It pretty much moves in sync with the bond market, which has just dropped 10 points, so you probably want to be buying or doubling up on (CCI) right here, because it will be the first thing to recover once we see a negotiated increase in the debt ceiling which has to happen before the summer. The 5G buildout continues unabated.
Q: Would you recommend buying Tesla (TSLA) shares again?
A: Yes, but at least $50 lower, which we may get. Or at least $50 off the $217 top. I think Tesla goes to $1,000 sometime in the next couple of years and so does Elon Musk. All of the factors that could drive the stock that high are in progress. I know it’s happening over there, and that’s easily a $1,000 stock once their current breakthroughs go mass-market.
Q: Any interest in Iron Condors?
A: It is the same as Strangles, with more limited risk with four legs, a call spread and a put spread because you stop out your losses at much lower levels. But they are very trading-intensive, commission-intensive trades, and it’s really too much for most beginners to handle. However, if you’re a professional, you might consider doing iron condors on these positions. Iron Condors also max profits when nothing moves, and lately, no move is a pretty rare event. We’re going to get it for the next couple of months, but don’t count on that being a frequent trade.
Q: Any iShares 20 Plus Year Treasury Bond ETF (TLT) LEAPS to buy now?
A: Yes I've been kind of sitting on my hands waiting to see if this bottom here holds at 99 before I put out LEAPS, but we’re so close it really almost makes no difference. And if I were to do a LEAPS here it probably would be the $100-$105 one-year out. That might get you about a 100% profit in a year. That’s a very safe LEAPS, and I’ll get the numbers out when I get a chance.
Q: What’s your opinion on Home Depot (HD)?
A: I like it for the long term. Clearly, their disastrous earnings report shows that the economy for home repair is not as strong as we thought it was, so it may go lower first. I would hold off until we get a real capitulation selloff in those stocks.
Q: Are gold and silver possible candidates for LEAPS?
A: Yes, especially in view of the recent correction in these metals. And we did put these out last October at the market bottom. I probably will be updating that sometime in the next few weeks.
Q: How much longer will the Ukraine/Russia war last?
A: The general consensus among the military now is that this goes on for several more years, and both sides will just keep pouring troops into the meat grinder until they get exhausted.
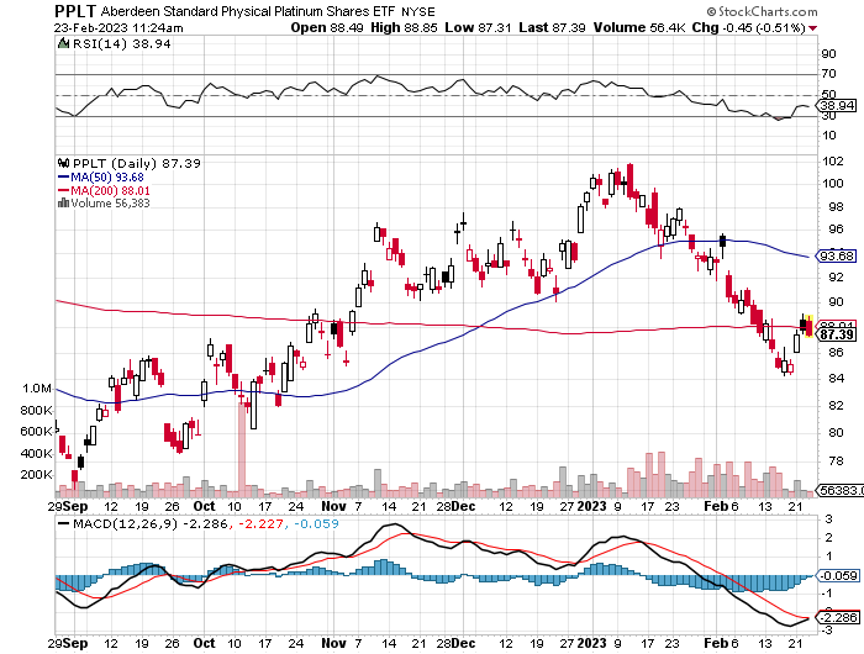
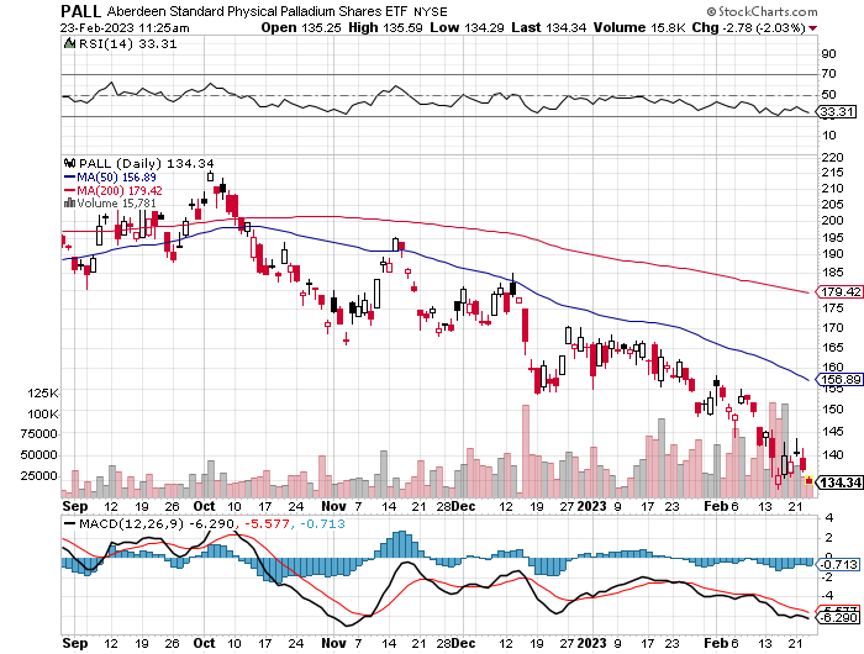
Q: Any way to play Platinum (PPLT) or Palladium (PALL)?
A: Yes, there are ETFs on each of them.
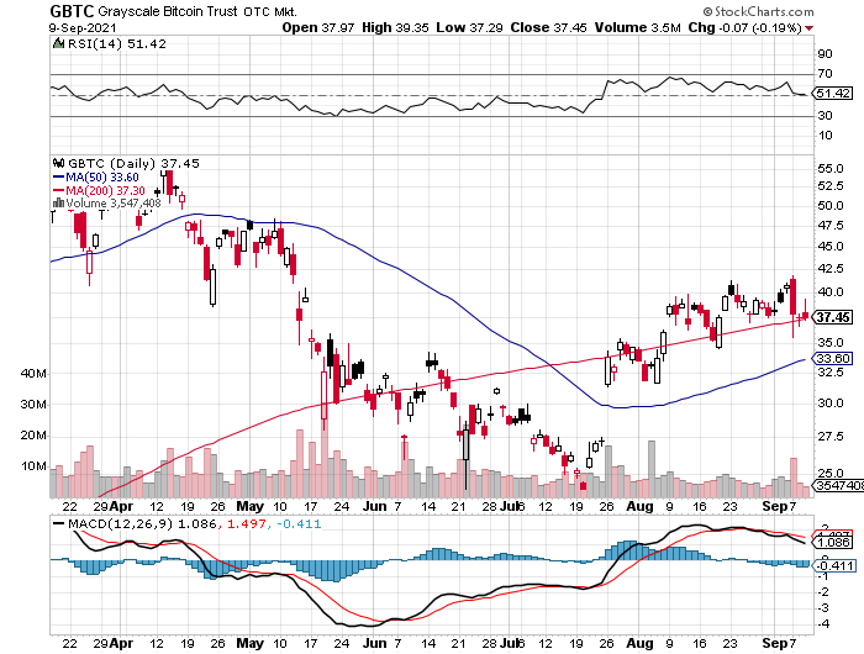
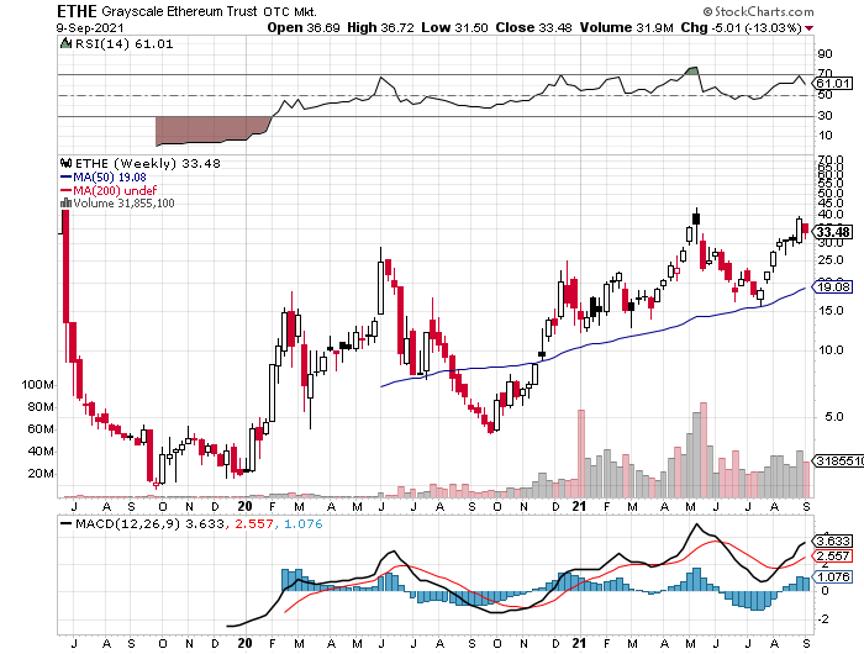
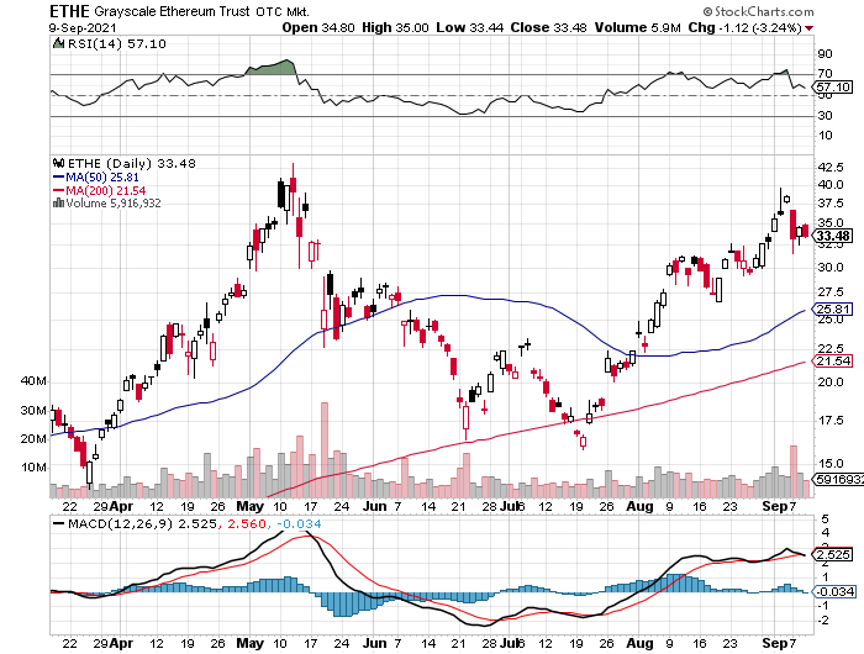
Q: Any thoughts on the crypto industry?
A: I have given up on the crypto industry because it has been shown that so many of these trading platforms were stealing from their customers. Once you lose the confidence of a customer on trust, you never get it back in the financial industry. Also, crypto was interesting a couple of years ago when it was going up and everything else in the world was too expensive, but now you have all the best stocks trading not far from multi-year lows, and that makes quality stocks much more attractive than a crypto where you really don't know what’s going to happen. Crypto could be another Nikkei, which after 32 years still hasn’t reached its old highs. That is unless it gets taken over by big banks like (JPM) and regains respectability that way.
Q: Any thoughts on investing in the AI trend?
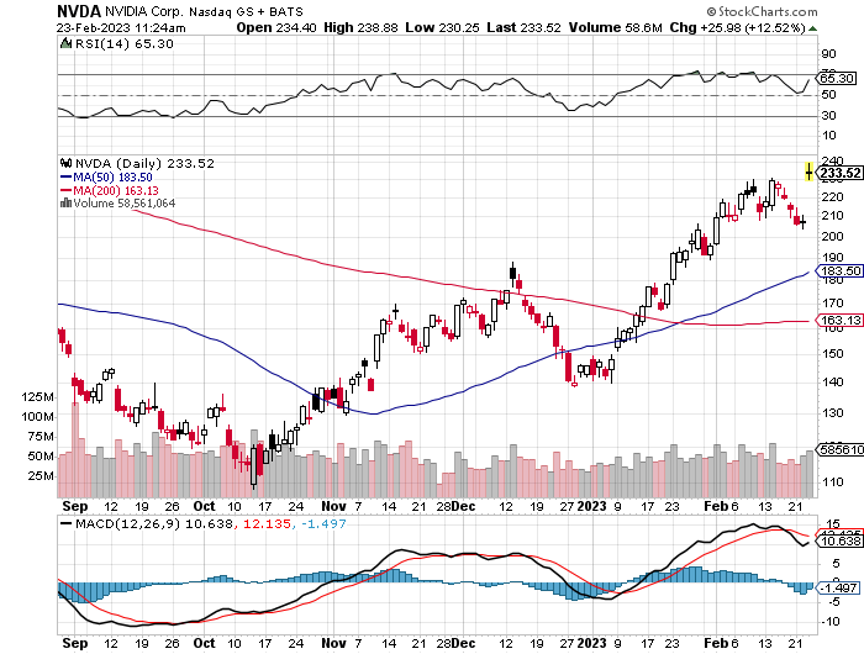
A: AI has suddenly become what crypto was 2 years ago, and what 3D printing was 15 years ago. It’s just the theme of the day, and something to promote. There are no pure AI plays. Basically, all companies have been using it for 10 or 15 years, it’s not a new thing. In fact, AI is already in every aspect of your life, you just might not know it yet. NVIDIA (NVDA) is probably the purest AI play out there whose chips everyone needs to execute AI. Beyond that, the biggest AI users are Apple (AAPL), Alphabet (GOOGL), Meta (META), and Amazon (AMZN). When Amazon makes ten more recommendations on books you might like or movies you might watch, that is AI.
To watch a replay of this webinar with all the charts, bells, whistles, and classic rock music, just log in to www.madhedgefundtrader.com, go to MY ACCOUNT, click on GLOBAL TRADING DISPATCH or TECHNOLOGY LETTER, then WEBINARS, and all the webinars from the last 12 years are there in all their glory.
Good Luck and Stay Healthy,
John Thomas
CEO & Publisher
The Diary of a Mad Hedge Fund Trader
With Medal of Honor Winner Colonel Mitchel Paige


