Below please find subscribers’ Q&A for the Mad Hedge Fund Trader August 22 Global Strategy Webinar with my guest and co-host Bill Davis of the Mad Day Trader.
As usual, every asset class long and short was covered. You are certainly an inquisitive lot, and keep those questions coming!
Q: How do you think the trade talks will resolve?
A: There will be no resolution this next round of trade talks. China has sent only their most hawkish negotiators who believe that China has done nothing wrong, so don’t expect results any time soon.
Also, because of the arrests in Washington, China is more inclined to just wait out Donald Trump, whether that’s 6 months or 6 1/2 years. They believe they have the upper hand now, sensing weakness in Washington, and in any case, many of the American requests are ridiculous.
Trade talks will likely overhang the market for the rest of this year and you don’t want to go running back into those China Tech plays, like Alibaba (BABA) and Baidu (BIDU) too soon. However, they are offering fantastic value at these levels.
Q: Will the Washington political storm bring down the market?
A: No, it won’t. Even in the case of impeachment, all that will happen is the market will stall and go sideways for a while until it’s over. The market went straight up during the Clinton impeachment, but that was during the tail end of the Dotcom Boom.
Q: Is Alibaba oversold here at 177?
A: Absolutely, it is a great buy. There is a double in this stock over the long term. But, be prepared for more volatility until the trade wars end, especially with China, which could be quite some time.
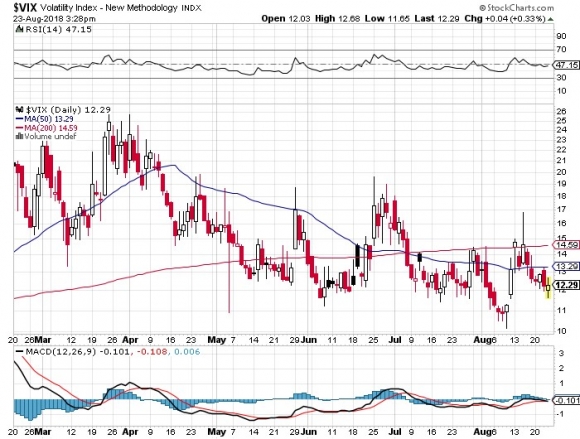
Q: What would you do with the Volatility Index (VIX) now?
A: Buy at 11 and buy more at 10. It’s a great hedge against your existing long portfolio. It’s at $12 right now.
Q: Are the emerging markets (EEM) a place to be again right now or do you see more carnage?
A: I see more carnage. As long as the dollar is strong, U.S. interest rates are rising, and we have trade wars, the worst victims of all of that are emerging markets as you can see in the charts. Anything emerging market, whether you’re looking at the stocks, bonds or currency, has been a disaster.
Q: Is it time to go short or neutral in the S&P 500 (SPY)?
A: Keep a minimal long just so you have some participation if the slow-motion melt-up continues, but that is it. I’m keeping risks to a minimum now. I only really have one position to prove that I’m not dead or retired. If it were up to me I’d be 100% cash right now.
Q: Would you buy Bitcoin here around $6,500?
A: No, I would not. There still is a 50/50 chance that Bitcoin goes to zero. It’s looking more and more like a Ponzi scheme every day. If we do break the $6,000 level again, look for $4,000 very quickly. Overall, there are too many better fish to fry.
Q: Is it time to buy gold (GLD) and gold miners (GDX)?
A: No, as long as the U.S. is raising interest rates, you don’t want to go anywhere near the precious metals. No yield plays do well in the current environment, and gold is part of that.
Q: What do you think about Lithium?
A: Lithium has been dragged down all year, just like the rest of the commodities. You would think that with rising electric car production around the world, and with Tesla building a second Gigafactory in Nevada, there would be a high demand for Lithium.
But, it turns out Lithium is not that rare; it’s actually one of the most common elements in the world. What is rare is cheap labor and the lack of environmental controls in the processing.
However, it’s not a terrible idea to buy a position in Sociedad Química y Minera (SQM), the major Chilean Lithium producer, but only if you have a nice long-term view, like well into next year. (SQM) was an old favorite of mine during the last commodity boom, when we caught a few doubles. (Check our research data base).
Q: How can the U.S. debt be resolved? Or can we continue on indefinitely with this level of debt?
A: Actually, we can go on indefinitely with this level of debt; what we can’t do is keep adding a trillion dollars a year, which the current federal budget is guaranteed to deliver. At some point the government will crowd out private borrowers, including you and me, out of the market, which will eventually cause the next recession.
Q: Time to rotate out of stocks?
A: Not yet; all we have to do is rotate out of one kind of stock into another, i.e. out of technology and into consumer staple and value stocks. We will still get that performance, but remember we are 9.5 years into what is probably a 10-year bull market.
So, keep the positions small, rotate when the sector changes, and you’ll still make money. But, let's face it the S&P 500 isn’t 600 anymore, it’s 2,800 and the pickings are going to get a lot slimmer from here on out. Watch the movie but stay close to the exit to escape the coming flash fire.
Q: What kind of time frame does Amazon (AMZN) double?
A: The only question is whether it happens now or on the other side of the next recession. We can assume five years for sure.
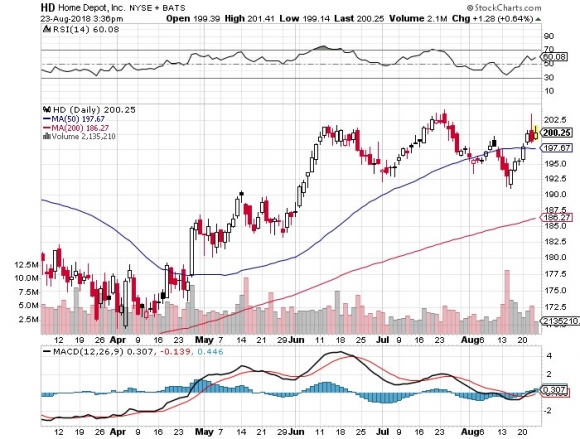
Q: More upside to Home Depot (HD)?
A: Absolutely, yes. The high home prices lead to increases in home remodeling, and now that Orchard Hardware has gone out of business, all that business has gone to Home Depot. Home Depot just went over $204 a couple days ago.
Q: Do you still like India (PIN)?
A: If you want to pick an emerging market to enter, that’s the one. It’s a Hedge Fund favorite and has the largest potential for growth.
Q: What about oil stocks (USO)?
A: You don’t want to touch them at all; they look terrible. Wait for Texas tea to fall to $60 at the very least.
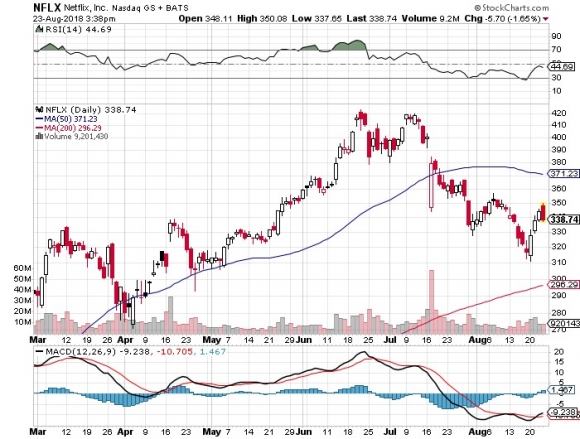
Q: What would you do with Netflix (NFLX)?
A: I would probably start scaling into buy right here. If you held a gun to my head, the one trade I would do now would be a deep in the money call spread in Netflix, now that they’ve had their $100 drop. And I can’t wait to see how the final season of House of Cards ends!
Q: If yields are going up, why are utilities doing so well?
A: Yields are going down right now, for the short term. We’ve backed off from 3.05% all the way to 2.81%; that’s why you’re getting this rally in the yield plays, but I think it will be a very short-lived event.
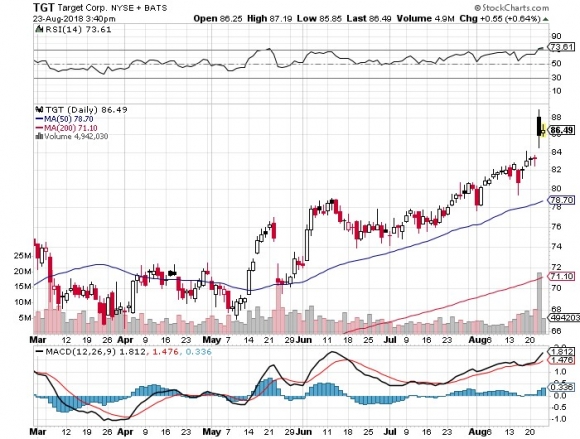
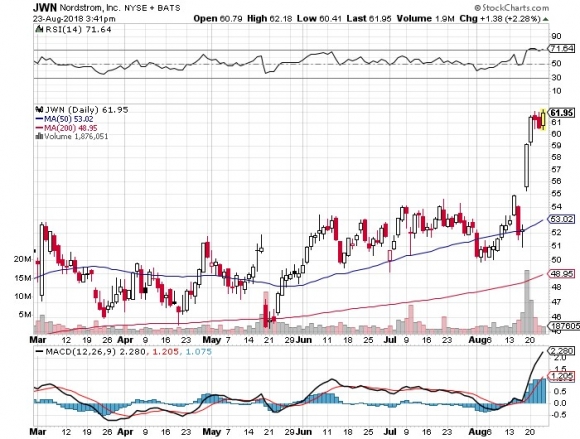
Q: Do you see retail stocks remaining strong from now through Christmas?
A: I don’t see this as part of the Christmas move going on right now; I think it’s a rotation into laggard plays, and it’s also very stock specific. Stocks like Nordstrom (JWN) and Target (TGT) are doing well, for instance, while others are getting slaughtered. I would be careful with which stocks you get into.
Good luck and good trading
John Thomas
CEO & Publisher
Diary of a Mad Hedge Fund Trader
For most of 2015, growth stocks far and away have been the outstanding performers in the US stock market.
Almost daily, I delighted in sending you trade alerts to buy winners, like Palo Alto Networks (PANW), Tesla (TSLA), and the Russell 2000 (IWM).
And so they delivered.
The reasons for their impressive gains were crystal clear.
The expectation all year was that the Federal Reserve would raise interest rates imminently. This gave us a perennially strong dollar (UUP).
Thus, one could only direct focus towards companies that were immune from plunging foreign currencies and falling international earnings.
It really was a year to ?Buy American?.
But a funny thing happened on the way to the bear market for bonds. It never showed up.
The final nail in the coffin was Fed governor Janet Yellen?s failure to move on September 17. She looked everywhere for inflation, but only found the chronically unemployed (the 10% U-6 discouraged worker jobless rate).
Not only did we NOT get the rate hike, the prospects are that WE MAY NOT SEE A SUBSTANTIAL INCREASE IN THE COST OF MONEY FOR YEARS!
At this point, the worst-case scenario is for the Fed to deliver only two 25-basis point rises over the next six months, AND THAT?S IT!
This reinforces my belief that the top of the coming interest rate cycle may only reach the bottom of past cycles, since deflation is so pernicious, and so structural.
All of a sudden, the bull case for the dollar, which has been driving our US stock selection all year, went wobbly at the knees.
Europe, Japan, and China are all now in between new quantitative easing and stimulus cycles, giving a decided bud to the Euro (FXE), the Yen (FXY), (YCS), the Yuan (CYB), the Aussie (FXA), and the Loonie (FXC).
New round of QE will come, but those could be months off.
Therefore, I am sensing a sea change in the market leadership. Rushing to the fore are the shares of companies that benefit from flat interest rates and a flagging greenback.
Those would be value stocks.
Value stocks are easy to find. Do any quantitative screen based on low price earnings multiples, low price to book value, and low price to cash flow, and you will find thousands of them. This is what the big boys do.
There is another reason to refocus on value stocks, but it is more psychological than analytical.
We are now into our sixth year in this bull market, one of the strongest in history. Portfolio managers are very wary of paying high multiples at market tops, as many did at the summit of the Dotcom bubble in 2000.
At least if they buy cheap share at market highs they have adequate job preserving explanations for their actions. There is also some inherent built in safety in increasing weightings in companies that haven?t appreciated very much.
I probably don?t know you personally (although I call about 1,000 of you a year), but I bet you don?t have 100 in-house analysts at hand to help you sift through the wheat and the chaff.
So let me do the heavy lifting for you. I?ll distill down the value play to a handful of high quality, high probability sectors.
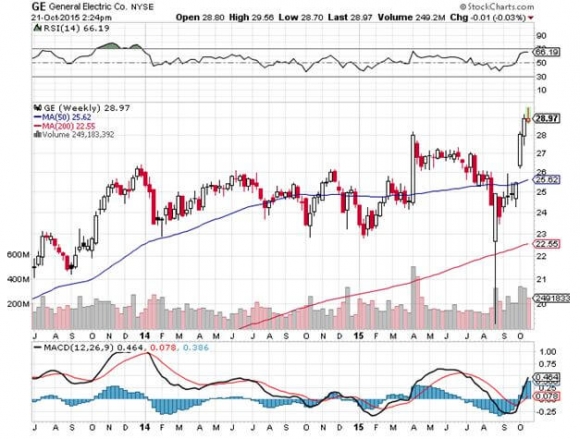
1) Industrials ? Remember those, the decidedly unsexy, heavy metal bashing companies that you have been ignoring for years? With global businesses and hefty borrowing for capital spending, they do very well in a flat interest rate environment. What?s my favorite industrial? The former hedge fund that made light bulbs, General Electric (GE). They make really cool jet engines and diesel electric locomotives too.
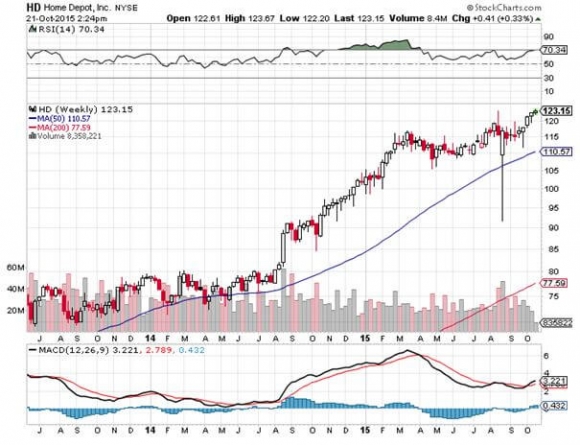
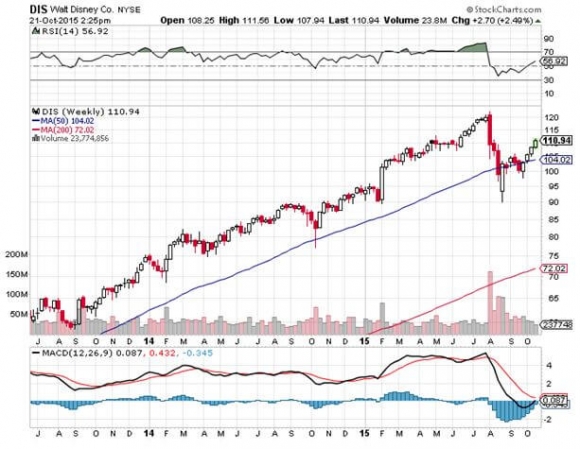
2) Consumer Discretionary ? Finally, people are spending their gas savings, now that they realize it is more than a temporary windfall. A housing market that is on fire is creating enormous demand for all the things owners stuff in their homes, both in new purchases and upgrades. Low rates will keep the 30-year mortgage under 4% for longer. You already know my best names here, Home Depot (HD), and Disney (DIS).
3) Old Technology ? Tired of paying 100 plus multiples for the latest non yielding cloud highflyer? Mature old technology stocks offer some of the cheapest valuations in the market. As, yes, they pay dividends now! I?ll go with Microsoft here (MSFT) as the action in the options market has suddenly seen a big spike.
And what about the biggest old tech stock of all, Apple (AAPL)? I think this will be a 2016 story, and investors reposition themselves to take advantage of the run up to the iPhone 7 launch in a year. But as the recent price action shows, some portfolio managers may not want to wait.
4) Financials ? Are not the first sector to leap to mind when looking for a low interest rate play. Overnight interest rates will remain depressed as far as the eye can see. However, rates at the long end, maturities of five years or more, are rising.
This steepening yield curve is where it really matters for banks, as it allows them to expand their profit margins. On top of that, bank valuations are at the bargain basement end of the market, with many still trading at below book value. Go for Citibank (C), Bank of America (BAC), and Goldman Sachs (GS).
New leadership from low-priced sectors could give us the rocket fuel for a melt up in the indexes into the end of 2015. It could take us right to the low end of my forecast yearend range for the S&P 500 I made on January 6 of 2,200-2,300 (click here for ?My 2015 Annual Asset Class Review?).
After five months of derisking, both institutions and hedge funds are underweight stocks and shy of exposure. As a result this underperforming year has ?chase? written all over it.
Keep your fingers crossed, but stranger things have happened.
It?s My Turn to Do the Heavy Lifting
https://www.madhedgefundtrader.com/wp-content/uploads/2015/10/John-Thomas1.jpg351357Mad Hedge Fund Traderhttps://madhedgefundtrader.com/wp-content/uploads/2019/05/cropped-mad-hedge-logo-transparent-192x192_f9578834168ba24df3eb53916a12c882.pngMad Hedge Fund Trader2015-10-22 01:06:102015-10-22 01:06:10Switching From Growth to Value
After yesterday?s 217 point swoon, the S&P 500 (SPX) has fallen 4.3% from its late May peak. It looks like the ?Sell in May? crowd is having the last laugh after all, of which I was one.
Is this a modest 5% correction in a continuing bull market? Or is it the beginning of a Harry Dent style crash to (SPX) 300 (click here for the interview on Hedge Fund Radio)? Let?s go to the videotape.
This was one of the most overbought stock markets in my career. I have to think back to the top of the dotcom boom in 2000 and the pinnacle of the Tokyo bubble in 1989 to recall similar levels of ebullience. In fact, two weeks ago we were at a real risk of a major melt up if we didn?t encounter some sort of pullback. So the modest selling we have seen so far has been welcome, even by the bulls.
There is still a reasonable chance the final decline will be nothing more than a pit stop on the way to new highs. Institutional weightings in equities are at a lowly 31%, compared to 50% 20 years ago. It seems that everyone in the world is overweight bonds (see yesterday?s piece on ?Welcome to the Sack of Rome?).
In recent weeks, the S&P 500 yield ratio has fallen behind that of the 10 year Treasury bond, at 2.10%, but only just. With a price/earnings multiple of 16, we are bang in the middle of a long time historic range of 10-22. Zero overnight interest rates argue that we should be at the top end of that range. The argument that the ?Buy the Dip? crowd is still lurking under the market is real, just a little further than the recent dips allowed.
So how much lower do we have to go? After the close, I enjoyed an in depth discussion with my old friend, Jim Parker, of Mad Day Trader fame about the possible permutations. The following is an itinerary of what your summer trading might look like, expressed in (SPX) terms:
6.2% - 1,605 was the Wednesday low, the 50 day moving average, and the downside of the most recent upward sloping channel on the chart below. This trifecta of support is many traders? first stop for a bounce.
5.4% - 1,590 is the first major downside Fibonacci level. We could see this as soon as the May nonfarm report payroll is announced on Friday.
6.0% - 1,580 is the old 13-year high. Markets always love to retrace to old breakout levels.
6.5% - 1,570 represents a give back of one third of the November-May 330 point rally.
8.3% - 1,540 is the double bottom off the April low.
11.1% - 1,493 is the 200-day moving average. This is the worst-case scenario. I doubt we?ll get there, unless the fundamentals change, which they always do.
Jim gave me a couple more cogent insights. The average big swing move is 100-110 points. The last 100-point move sprung off of the March nonfarm payroll report, which came out on April 5. Big swings also often start and finish around an options expiration, the next one of those is coming on June 21. So for the short term, 1580-1590 is looking good.
To confuse you even further, contemplate the concept that I refer to as the ?Lead Contract.? There is always a lead contract around, one on which all traders maintain a laser like focus, which leads every other financial product out there. It says ?Jump,? and we ask ?How High?? It is also always changing.
Right now, the Nikkei average (DXJ) is the lead contract. The Japanese yen ETF (FXY) is the close inverse. Every flight from risk during the past two weeks has been preceded by a falling Nikkei and a rising yen.
If you want to get a preview of each day?s US trading, stay up the night before and watch the action in Tokyo, as I often do.
You might even learn a word or two of Japanese, which will come in handy when ordering in the better New York sushi shops.
Looking for More Market Insights
https://www.madhedgefundtrader.com/wp-content/uploads/2013/06/Girl-with-Chopsticks.jpg403269Mad Hedge Fund Traderhttps://madhedgefundtrader.com/wp-content/uploads/2019/05/cropped-mad-hedge-logo-transparent-192x192_f9578834168ba24df3eb53916a12c882.pngMad Hedge Fund Trader2013-06-06 09:20:352013-06-06 09:20:35Where?s This Market Bottom?
Legal Disclaimer
There is a very high degree of risk involved in trading. Past results are not indicative of future returns. MadHedgeFundTrader.com and all individuals affiliated with this site assume no responsibilities for your trading and investment results. The indicators, strategies, columns, articles and all other features are for educational purposes only and should not be construed as investment advice. Information for futures trading observations are obtained from sources believed to be reliable, but we do not warrant its completeness or accuracy, or warrant any results from the use of the information. Your use of the trading observations is entirely at your own risk and it is your sole responsibility to evaluate the accuracy, completeness and usefulness of the information. You must assess the risk of any trade with your broker and make your own independent decisions regarding any securities mentioned herein. Affiliates of MadHedgeFundTrader.com may have a position or effect transactions in the securities described herein (or options thereon) and/or otherwise employ trading strategies that may be consistent or inconsistent with the provided strategies.