Global Market Comments
September 4, 2025
Fiat Lux
Featured Trade:
(THIS WILL BE YOUR BEST PERFORMING ASSET FOR THE NEXT 30 YEARS),
(IYR), (PHM), (LEN), (DHI), (TLT), (HYG), (MUB), (SPY)
Global Market Comments
September 4, 2025
Fiat Lux
Featured Trade:
(THIS WILL BE YOUR BEST PERFORMING ASSET FOR THE NEXT 30 YEARS),
(IYR), (PHM), (LEN), (DHI), (TLT), (HYG), (MUB), (SPY)

Lately, I have spent my free time trolling the worst slums of Oakland, CA.
No, I’m not trying to score a drug deal, hook up with some ladies of ill repute, or get myself killed.
I was looking for the best-performing investment for the next 30 years.
Yup, I was looking for new homes to buy.
As most of you know, I try to call all of my readers at least once a year and address their individual concerns.
Not only do I pick up some great information about regions, industries, businesses, and companies, but I also learn how to rapidly evolve the Diary of a Mad Hedge Fund Trader service to best suit my voracious, profit-seeking readers.
So when a gentleman asked me the other day to reveal to him the top-performing asset of the next 30 years, I didn’t hesitate: your home equity.
He was shocked.
I then went into the economics of the Oakland trade with him.
West Oakland was built as a working-class neighborhood in the late 1890s because it was a short hop on the ferry to San Francisco. Many structures still possess their original Victorian gingerbread designs and fittings.
Today, it is a 5-minute BART ride under the Bay to the San Francisco financial district.
A one three-bedroom, two-bath home I saw was purchased a year ago for $450,000, with a $50,000 down payment, and a 6.5% loan on the balance.
The investor quickly poured $50,000 into the property, with new paint, heating, hot water, windows, a kitchen, bathrooms, and flooring.
A year later, he listed it for sale at $650,000, and the agent said there was a bidding war on that would probably take the final price up to $700,000.
Excuse me, gentlemen, but that is a 400% return on a 50,000 investment in 12 months.
As Oakland rapidly gentrifies, the next buyer will probably see a doubling in the value of this home in the next five years.
Try doing that in the stock market.
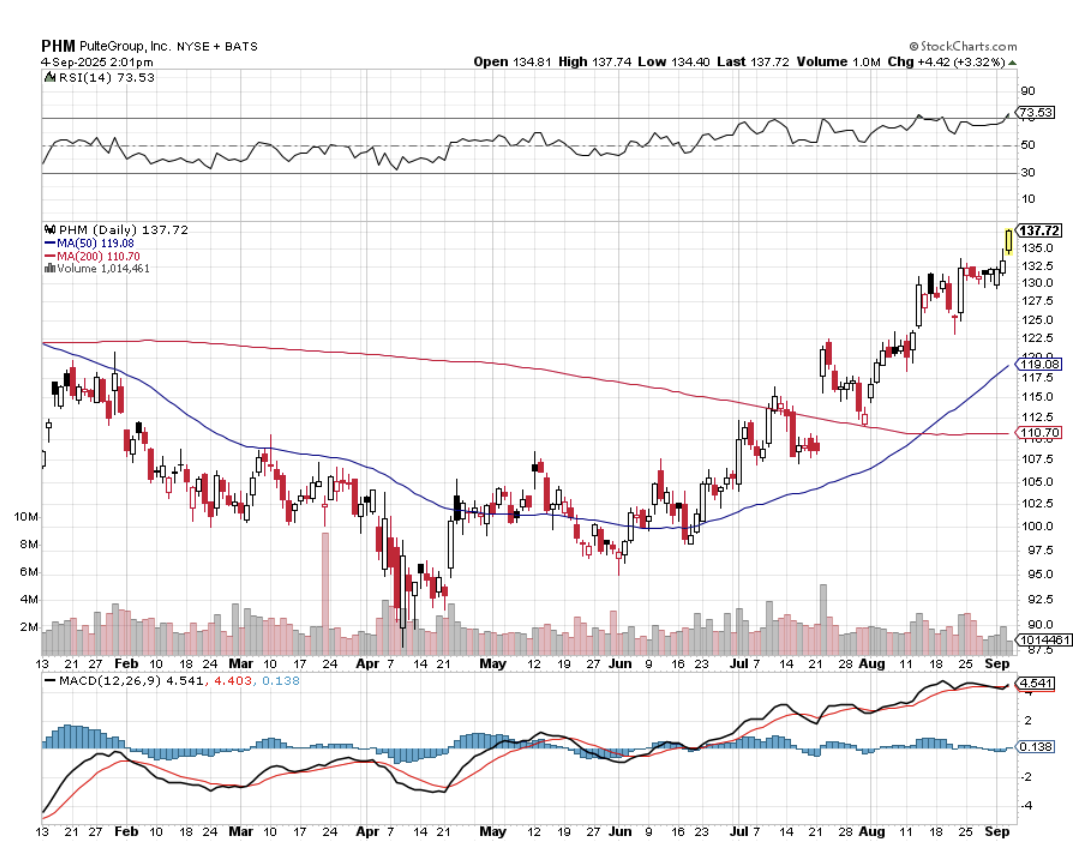
Needless to say, housing stocks like Lennar Homes (LEN), D.R. Horton (DHI), and Pulte Homes (PHM) need to be at the core of any long-term stock portfolio.
I then proceeded to list off to my amazed subscriber the many reasons why residential housing is just entering a Golden Age that will drive prices up tenfold, if not 100-fold, in the decades to come. After all, over the last 60 years, the value of my parents’ home in LA went up 100-fold and the equity 1,000-fold.
1) Demographics. The last decade started out as the hard decade for housing, when 80 million downsizing baby boomers unloaded their homes for greener pastures at retirement condos and assisted living facilities.
The 65 million Gen Xers who followed were not only far fewer in number, but earned much less, thanks to globalization and hyper-accelerating technology.
All of this conspired to bring us a real estate crash that bottomed out in 2011.
During the 2020s, the demographics math reverses.
That’s when 85 million millennials start chasing the homes owned by 65 million Gen Xers.
And as they age, this group will be earning a lot more disposable income, thanks to a labor shortage.
2) Population Growth
If you think it's crowded now, you haven’t seen anything yet.
Over the next 30 years, the US population is expected to soar from 335 million today to 450 million. California alone will rocket from 38 million to 50 million.
That means housing for 115 million new Americans will have to come from somewhere. It sets up a classic supply/demand squeeze.
That’s why megaprojects like the San Francisco to Los Angeles bullet train, which may seem wasteful and insane today, might be totally viable by the time they are finished.
3) They’re Not Building Them Anymore
Or at least not as much as they used to.
Total housing starts for 2024 were 1.55 million, a 3% decline from the 1.60 million total from 2023. Single-family starts in 2023 totaled 1.01 million, down 10.6% from the previous year. That means they are producing half of peak levels.
The home building industry has to more than triple production just to meet current demand.
Builders blame import taxes (tariffs) for materials like lumber (Canada) and drywall (Mexico), regulation, zoning, the availability of buildable land, lack of financing, and labor shortages.
The reality is that the companies that survived the 2008 crash are a much more conservative bunch than they used to be. They are looking for profits, not market share. They are targeting a specific return on capital for their business, probably 20% a year pretax.
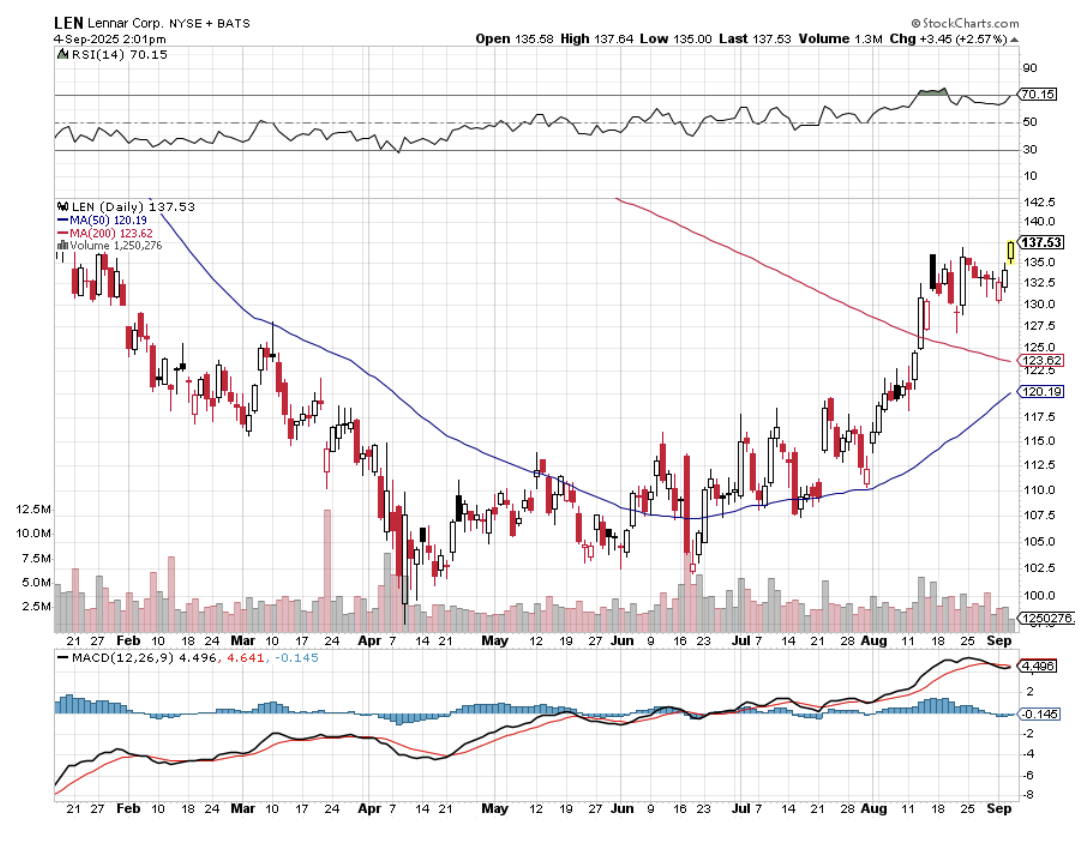
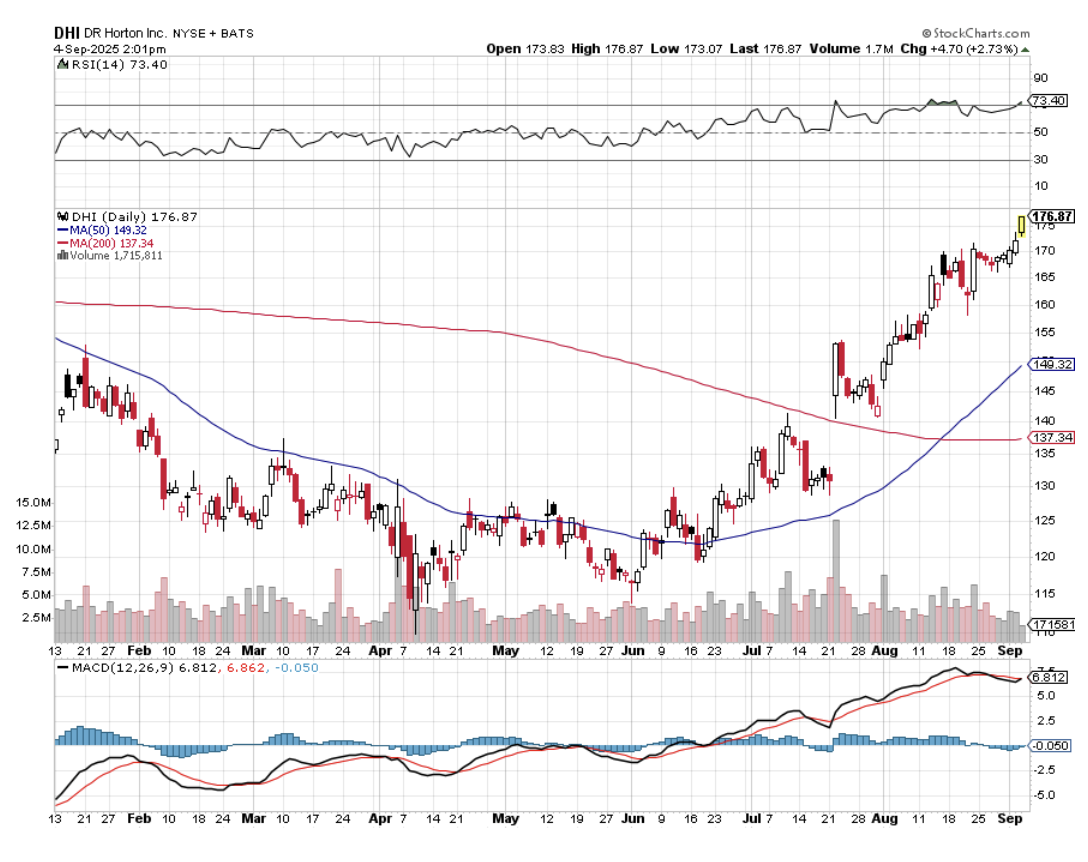
It is no accident that new homebuilders like Lennar (LEN), Pulte Homes (PHM) and (DHI) make a fortune when building into rising prices and restricted supply. Their share prices have been on an absolute tear lately, and that is with a heartbreaking 6.5% mortgage rate.
This strategy is creating a structural shortage of 10 million new homes in this decade alone.
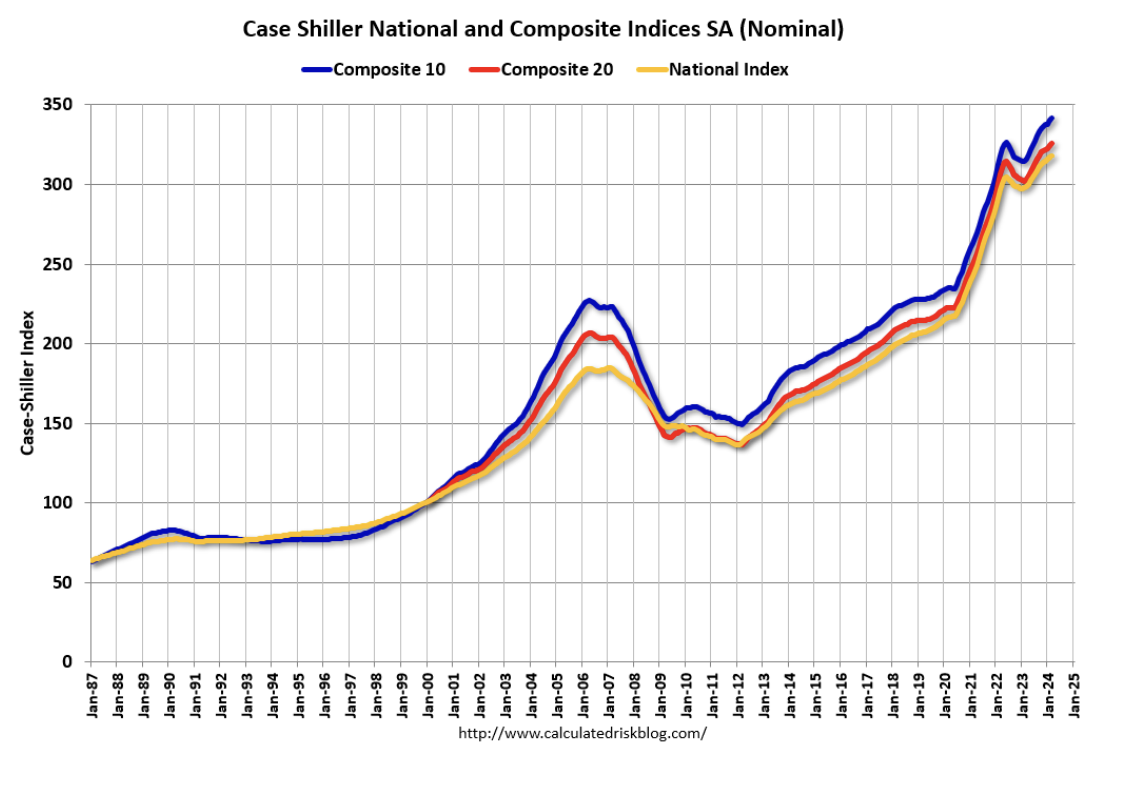
4) The Rear View Mirror
The Case Shiller CoreLogic National Home Price Index (see below) has started to fall after decades of increases. This will finally start to address affordability, one of the most daunting issues facing the market today.
Unless you have a new Internet start-up percolating in your garage, it is going to be very hard to beat your own home’s net return.
5) The Last Leverage Left
A typical down payment on a new home these days is 25%. That gives you leverage of 4:1. So in a market that is rising by 5.0% a year, your increase in home equity is really 20% a year.
Pay a higher interest rate, and down payments as low as 10% are possible, bringing your annual increase in home equity to an eye-popping 50%.
And if you qualify for an FHA loan up to $633,000, only a 3.5% deposit is required.
There are very few traders who can make this kind of return, even during the most spectacular runaway bull market. And to earn this money on your house, all you have to do is sleep in it at night.
6) The Tax Breaks are Great
The mortgage interest on loans up to $750,000 is deductible on your Form 1040, Schedule “A”, with a $40,000 limitation.
You can duck the capital gains entirely if the profit is less than $500,000, you’re married, and have lived in the house for 2 years or more.
Any gains above that are taxed at only a maximum 20% rate. These are the best tax breaks you can get anywhere without being a member of the 1%. Profits can also be deducted on the sale of a house if you buy another one at the equivalent value within 18 months.
7) There is No Overbuilding Anywhere
You know those forests of cranes that blighted the landscape in 2020? They are nowhere to be seen.
The other signs of excess speculation, liar’s loans, artificially high appraisals, and rapid flipping no longer exist. Much of this is now illegal, thanks to new regulations.
No bubble means no crash. Prices should just continue grinding upwards in a very boring, non-volatile way.
So the outlook is pretty rosy for individual homeownership for the foreseeable future.
Just don’t forget to sell by 2030 when the demographics reverse.
That's when the next round of trouble begins.

For Sale
Global Market Comments
September 20, 2024
Fiat Lux
Featured Trade:
(THIS WILL BE YOUR BEST PERFORMING ASSET FOR THE NEXT 30 YEARS),
(IYR), (PHM), (LEN), (DHI), (TLT), (HYG), (MUB), (SPY)
Global Market Comments
August 8, 2023
Fiat Lux
Featured Trades:
(THIS WILL BE YOUR BEST-PERFORMING ASSET FOR THE NEXT 30 YEARS),
(IYR), (PHM), (LEN), (DHI), (TLT), (HYG), (MUB), (SPY)
CLICK HERE to download today's position sheet.

Last week saw the sharpest move up in stock prices in seven years. Why doesn’t it feel like it? Maybe it’s because we are all recovering losses instead of posting new profits. The mind has a funny way of working like that.
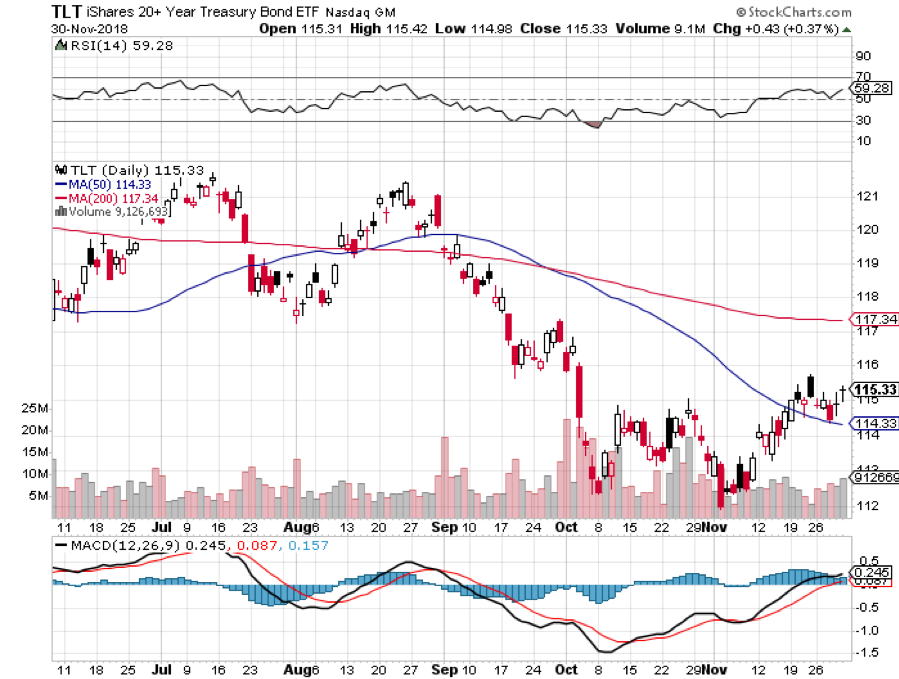
In fact, 2018 may go down as the year that EVERYTHING went down. Stocks (SPY), bonds (TLT), commodities (COPX), precious metals (GLD), foreign currencies (FXE), emerging markets (EEM), oil (USO), real estate (IYR), vintage cars, fine art, and even my neighbor’s beanie baby collection were all posting negative numbers as of a week ago.
In fact, Deutsche Bank tracks 100 global indexes and 88 of them were posting losses on the year. The normal average in any one year is 27. This is why hedge fund are having their worst year in history (except for this one). When your longs AND your shorts plunge in unison, there is nary a dime to be had. Even gold, the ultimate flight to safety asset has failed to perform.
Theoretically, this is supposed to be impossible. When stocks go down, bonds are supposed to go up and visa versa. So are emerging markets and all other hard assets.
This only happens in one set of circumstances and that is when global liquidity is shrinking. There is just not enough free cash around to support everything. So, the price of everything goes down.
The reason most of you don’t recognize this is that last time this happened was in 1980 when most of you were still a gleam in your father’s eye.
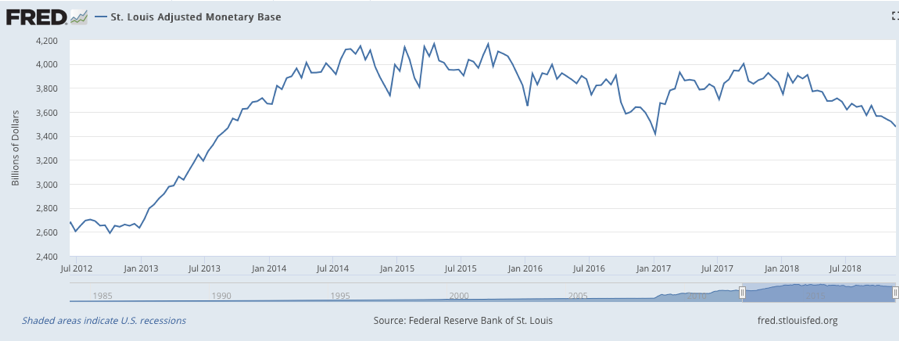
If you don’t believe me check, out the chart below from the Federal Reserve Bank of St. Louis. It shows that after peaking in July 2014, the Adjusted Monetary Base has been going nowhere and recently started to decline precipitously.
This was exactly three months before the Federal Reserve ended the aggressive, expansionary monetary policy known as quantitative easing.
The rot started in commodities and spread to precious metals, agricultural prices, bonds, and real estate. In October, it spread to global equities as well. Beanie babies were the last to go.
Want some bad news? Shrinking global liquidity, which is now accelerating, is a major reason why I have been calling for a recession and bear market in 2019 all year.
They say imitation is the sincerest form of flattery. Perhaps that is why 2019 recession calls are lately multiplying like rabbits. Nothing like closing the barn door after the horses have bolted. I wish you told me this in September.
Disturbing economic data is everywhere if only people looked. The S&P Case-Shiller Home Price Index rate of price rise hit an 18-month low at 5.5%. With housing in free fall nationally further serious price declines are to come. With mortgage rates up a full point in a year and affordability at a decade low, who’s surprised?
General Motors (GM) closed 3 plants and laid off 15,000 workers, as trade wars wreak havoc on old-line industries. It looks like Millennials would rather ride their scooters than buy new cars.
Weekly Jobless Claims soared 10,000, to 234,000, a new five-month high. Not what stock owners want to hear. THE JOBS MIRACLE IS FADING!
October New Home Sales were a complete disaster, down a stunning 8.9% and off 12% YOY. These are the worst numbers since the 2009 housing crash. I told you not to buy homebuilders! They can’t give them away now!
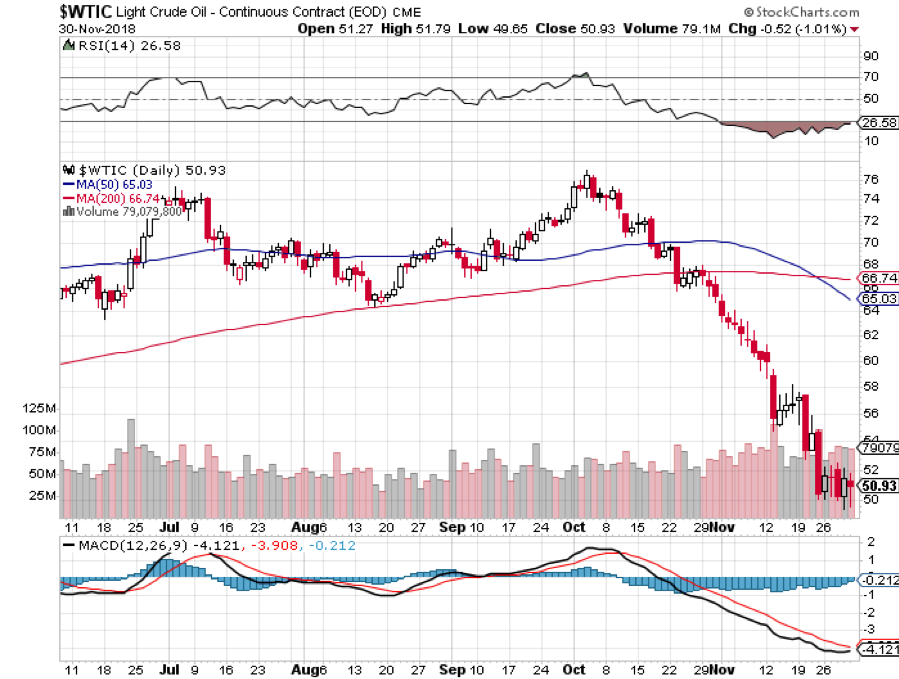
Oil plunged again, off 20% in November alone. Is this punishment for Saudi Arabia chopping up a journalist or is the world headed into recession?
It seems we don’t have quiet weeks anymore. Normally, sedentary Jay Powell ripped it up with a few choice words at the New York Economic Club.
By saying that we are close to a neutral rate, the Fed Governor implied that there will be one more rate rise in December and then NO MORE. Happy president. But the historical neutral range is 3.5%-4.5%, meaning there is room for 2-6 X 25 basis point rate hikes to keep the bond vigilantes at pay. Such a card! Thread that needle!
Cyber Monday sales hit a new all-time high, up to $7.3 billion, with Amazon (AMZN) taking far and away the largest share. The stock is now up $300 from its November $1,400 low.
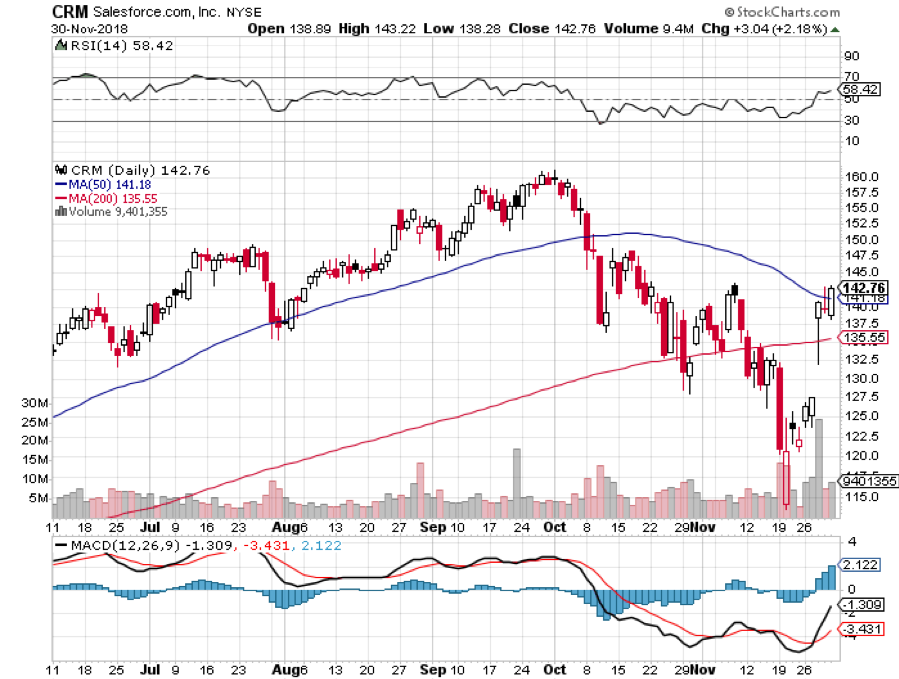
Salesforce, a Mad Hedge favorite, announced blockbuster earnings and was rewarded with a ballistic move upwards in the shorts. Fortunately, the Mad Hedge Technology Letter was long.
The Mad Hedge Alert Service managed to pull victory from the jaws of defeat in November with a last-minute comeback. Add October and November together and we limited out losses to 0.59% for the entire crash.
This was a period when NASDAQ fell a heart-stopping 17% and lead stocks fell as much as 60%. Most investors will take that all day long. I bet you will too. Down markets is when you define the quality of a trader, not up ones, when anyone can make a buck.
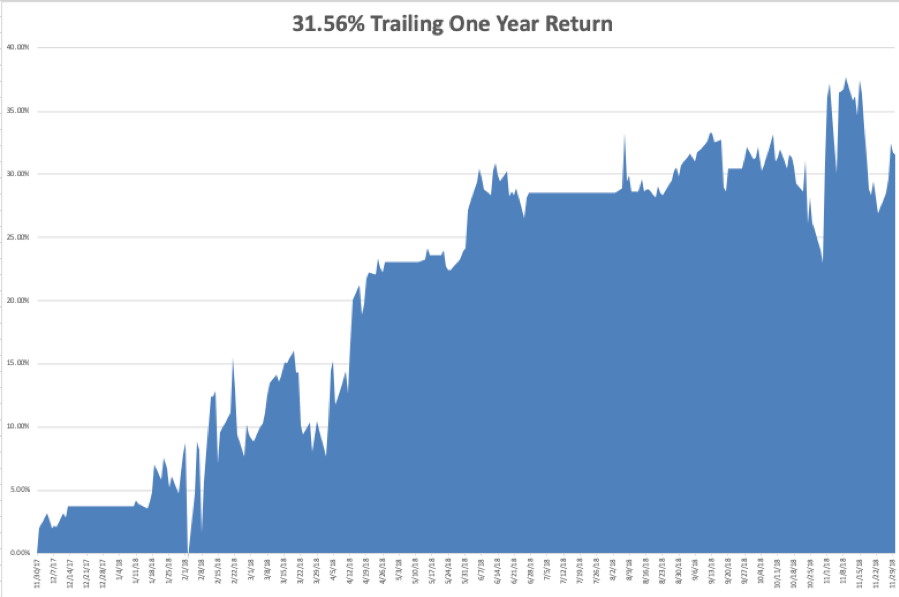
My year to date return recovered to +27.80%, boosting my trailing one-year return back up to 31.56%. November finished at a near-miraculous -1.83%. That second leg down in the NASDAQ really hurt and was a once in 18-year event. And this is against a Dow Average that is up a pitiful +2.9% so far in 2018.
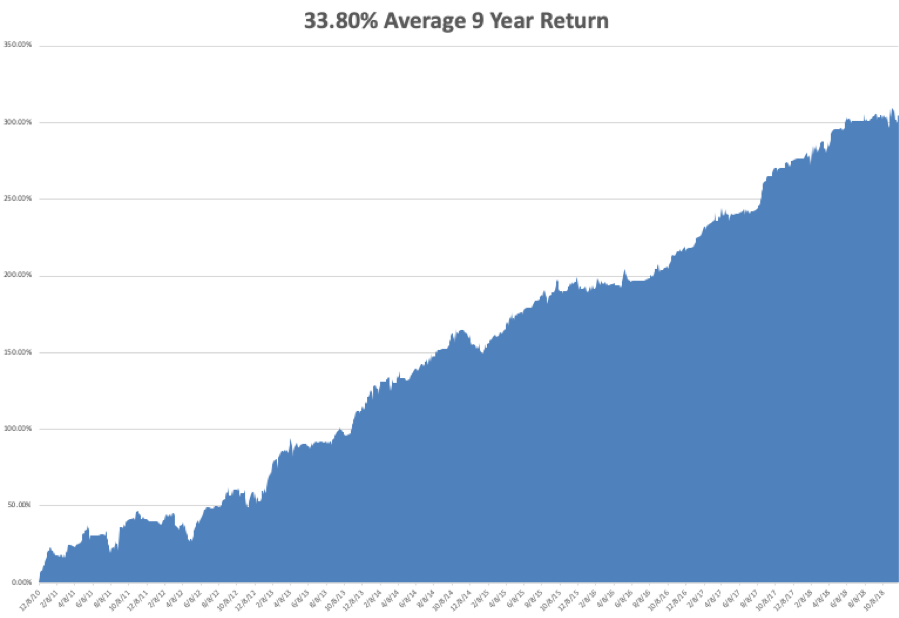
My nine-year return recovered to +304.27. The average annualized return revived to +33.80.
The upcoming week is all about jobs reports, and on Friday with the big one.
Monday, December 3 at 10:00 EST, the November ISM Manufacturing Index is published. All hell will break loose at the opening as the market discounts the outcome of the Buenos Aires G-20 Summit.
On Tuesday, December 4, November Auto Vehicle Sales are released.
On Wednesday, December 5 at 8:15 AM EST, the November ADP Private Employment Report is out.
At 10:30 AM EST the Energy Information Administration announces oil inventory figures with its Petroleum Status Report.
Thursday, December 6 at 8:30 AM EST, we get the usual Weekly Jobless Claims. At 10:00 AM we learned the November ISM Nonmanufacturing Index.
On Friday, December 7, at 8:30 AM EST, the November Nonfarm Payroll Report is printed.
The Baker-Hughes Rig Count follows at 1:00 PM. At some point, we will get an announcement from the G-20 Summit of advanced industrial nations.
As for me, I’ll be driving my brand new Tesla Model X P100D which I picked up from the factory yesterday. I’ll be zooming up and down the hills and dales of the mountains around San Francisco this weekend.
I’ll also be putting to test the “ludicrous mode” to see if it really can go from zero to 60 in 2.9 seconds and give passengers motion sickness. I will go well equipped with air sickness bags which I lifted off of my latest Virgin Atlantic flight.
Talley Ho!
Good luck and good trading.
John Thomas
CEO & Publisher
The Diary of a Mad Hedge Fund Trader