Below please find the subscribers’ Q&A for the January 11 Mad Hedge Fund Trader Global Strategy Webinar broadcast from Silicon Valley in California.
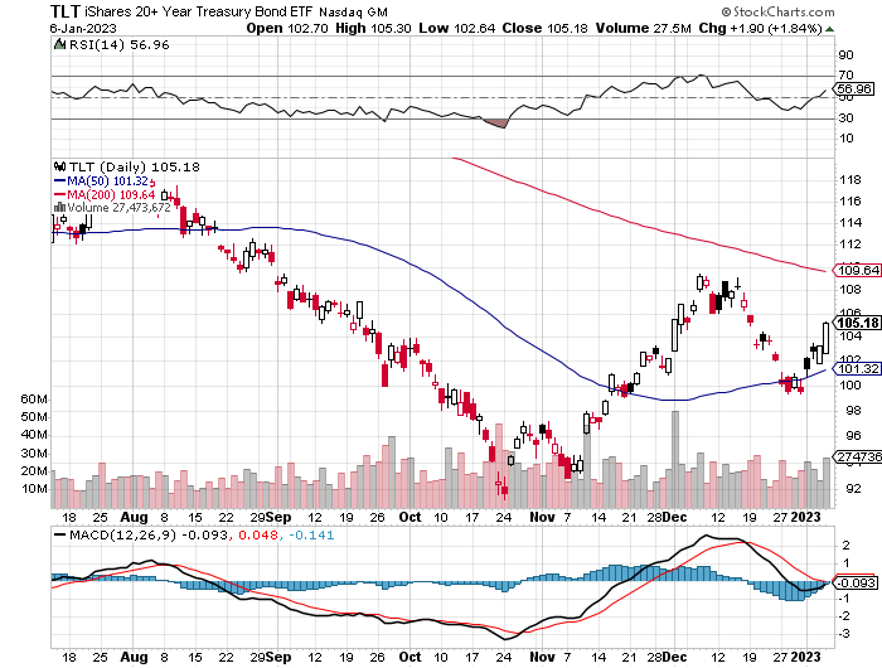
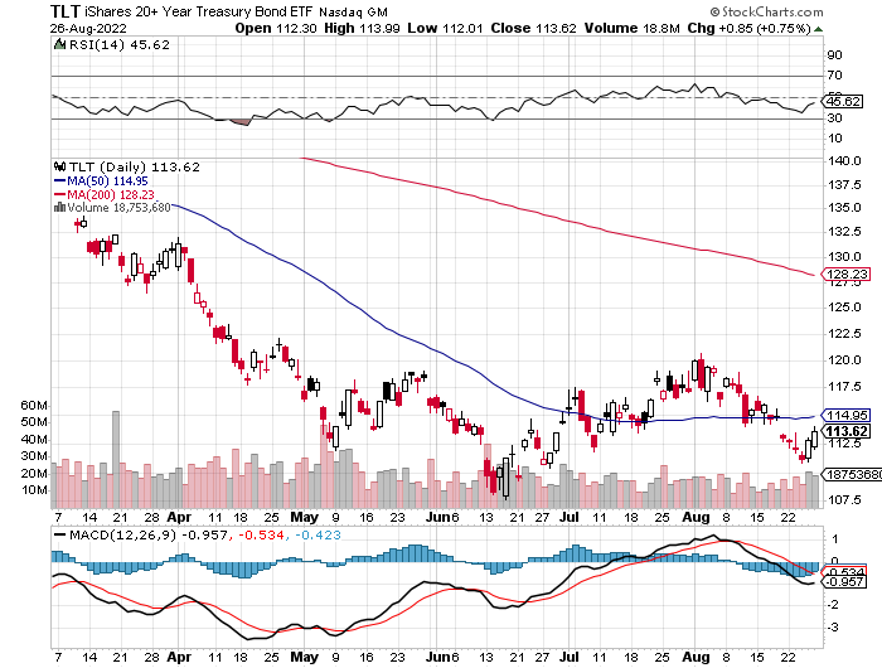
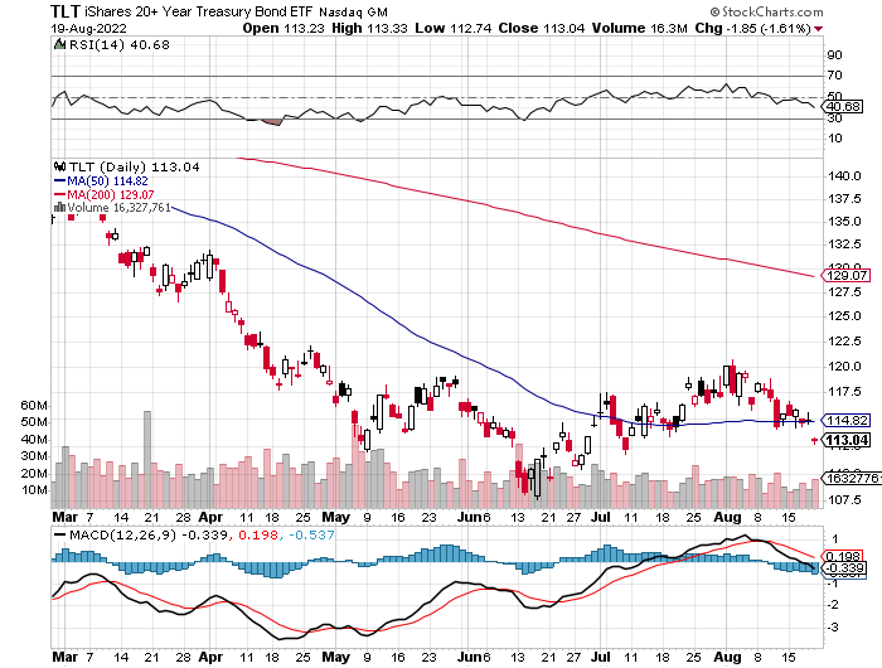
Q: In your trade alert you expected that the (TLT) might go up as much as 30% this year. But in your latest newsletter, you mentioned that the chaos in the US House of Representatives would greatly raise the risk of a default on US government debt by the summer and certainly cast a shadow over your 50% long bond position. Is it still a good idea to hold on to the (TLT) ETF over the next 2-6 months?
A: It is. The extremists who now control the House are not interested in governing or passing laws but gaining clicks, raising money, and increasing speaker’s fees. It may have converted (TLT) from a straight-up trade to a flat-line trade. We will still make the maximum profit on call spreads and LEAPS but with greater risk. But even chaos in the House can’t head off a recession, which the bond market seems intent on pricing in by going up. However, if you depend on government payments for any reason, be it Social Security, a government salary, a tax refund, or a payment for a contract, expect delays. The housing market also ceases because closings can’t take place during government shutdowns. Also, 30% of my bond longs expire in four trading days, and the remainder on February 17.
Q: Is it wise to sell the 2X ProShares Ultra Technology ETF (ROM) now or keep holding?
A: I think the (ROM), NASDAQ, and technology stocks in general may make several runs at the lows over the next six months but won’t fall much from here. A recession is priced in. Once we get through this, you’re looking at doubles and triples for the best names. So, the risk/reward overwhelmingly favors holding on to a one-year view.
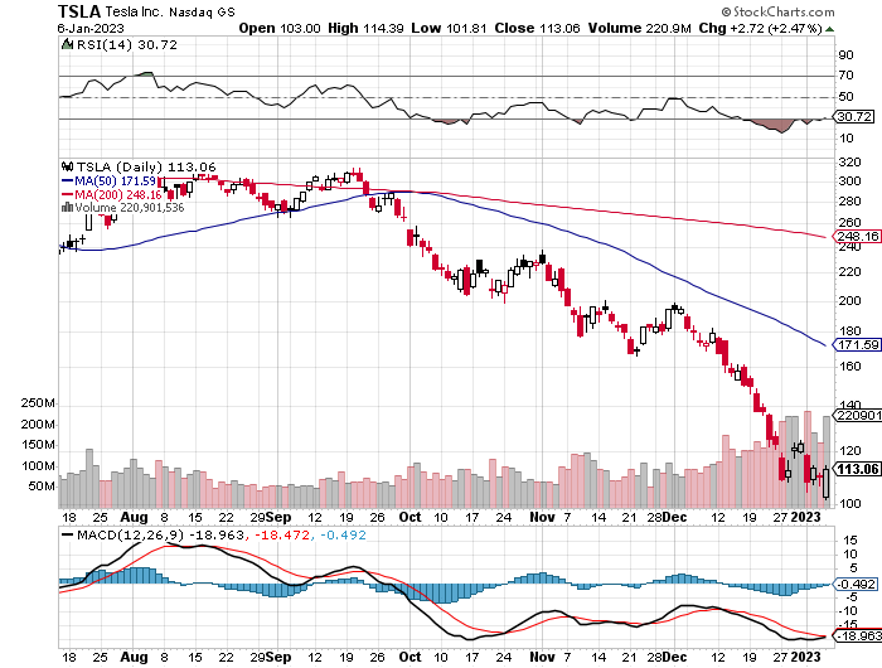
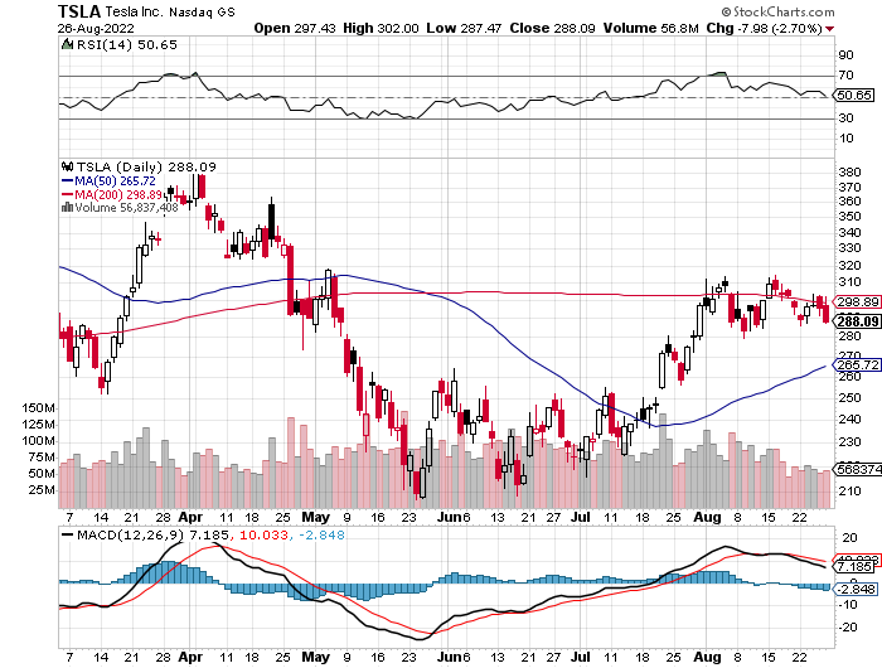
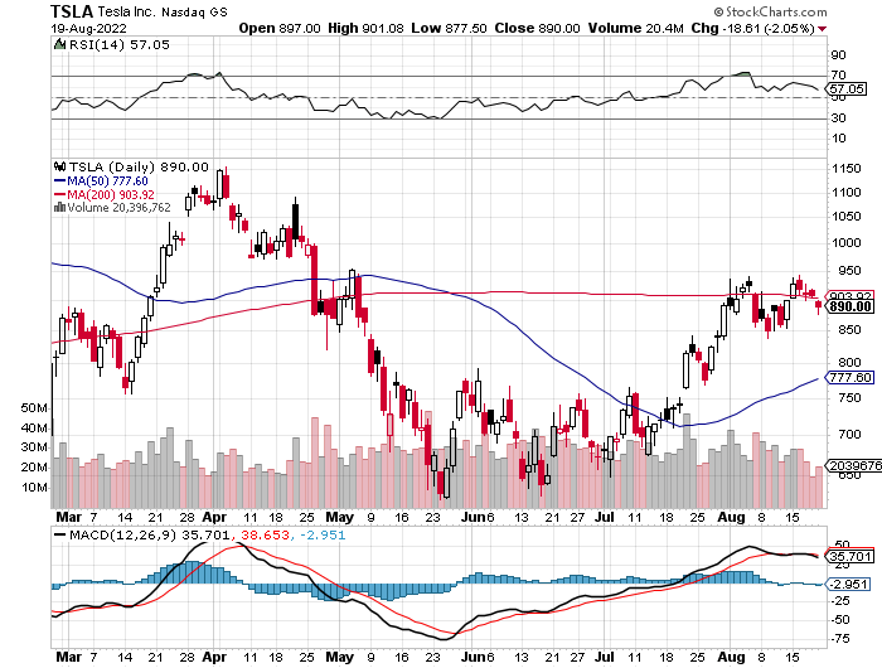
Q: would you buy Tesla (TSLA) here?
A: I would start scaling in. The bad news is about to dry up, like Twitter, the recession, the pandemic in China, and Elon Musk selling shares. Then we face an onslaught of good news, like the new Mexico factory announcement, the Cybertruck launch, solid state batteries, and annual production hitting 2 million. At this level, the shares are priced in multiple worst-case scenarios. It is selling at 10X 2025 earnings, half the market multiple. At the end of the day, Tesla has an unassailable 14-year start over the rest of the industry and is the only company in the world that makes money on EVs. There’s an easy 10X here on two-year LEAPS.
Q: I’m in the Freeport McMoRan (FCX) January 25 2-year LEAP approaching the upper end of the 42/45 range. If it crosses 45, do we close the position?
A: Sell half, take your profit. If you’re in the LEAP, my guess is you probably have a 500% profit here in only 3 months, which is not bad. And then you keep the remaining half because you’re then playing with the house's money, and Freeport has a shot of going all the way to $100 a share by the 2025 expiration, and that will get you your full 1,000% return on the position. It’s always nice to be in a position where it’s impossible to lose money on a trade, and that certainly is where you are now with your (FCX) LEAP and everybody else in the FCX LEAP in October also.
Q: As a member of the Florida Retirement System, I’m curious how Blackrock (BLK) and other firms are dealing with the Santos’ plan for their portfolios.
A: Having a state governor manage your portfolio and make your sector and stock picks is an absolutely terrible idea. I can’t imagine a worse possible outcome for your retirement funds. Florida is not the only state doing this—Louisiana and Texas are doing it too. The goal is to drive money out of alternative energy and back into the oil industry, and obviously, this is being financed by the oil industry, which is pissed off over their low multiples. Suffice it to say it’s not a good idea to move out of one of the fastest-growing industries in the market and move into an industry that’s going to zero in 10 years. If that’s their investment strategy, I wish they’d stick to politics and leave investing for true professionals to do.
Q: What do you think about cannabis stocks?
A: I’m a better user of the product than the stock. How about that? How hard is it to grow weed? At the end of the day, these are just pure marketing companies, and that value added is low. Plus, they have huge competition from the black market still selling ½ to ⅓ below market prices because they’re tax-free; the local taxes on these cannabis sales are enormous.
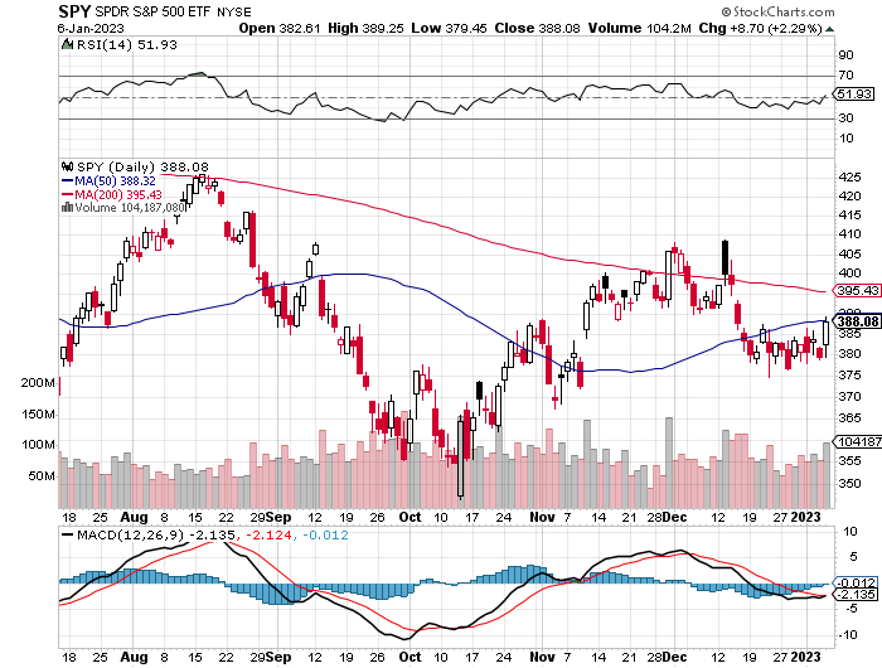
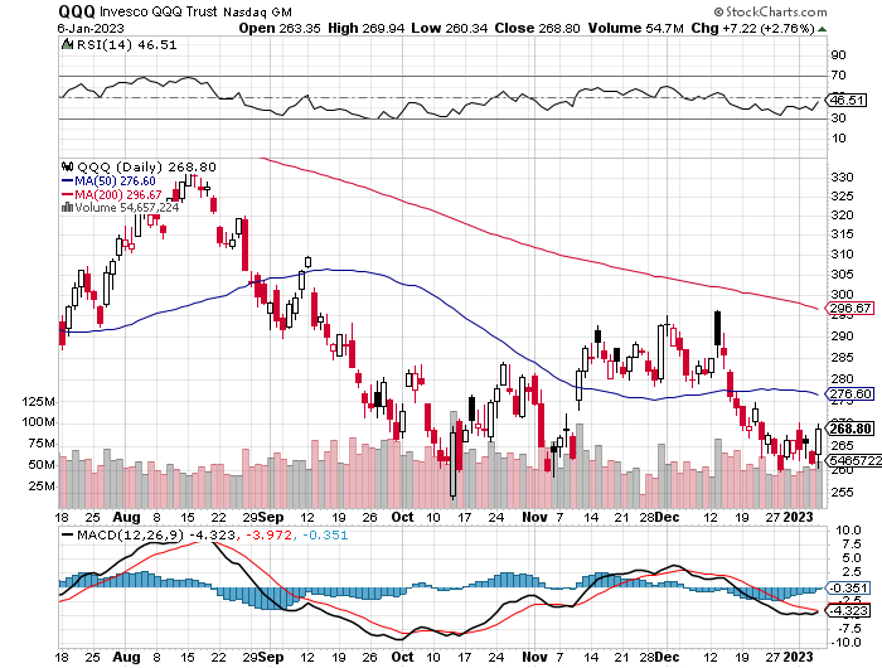
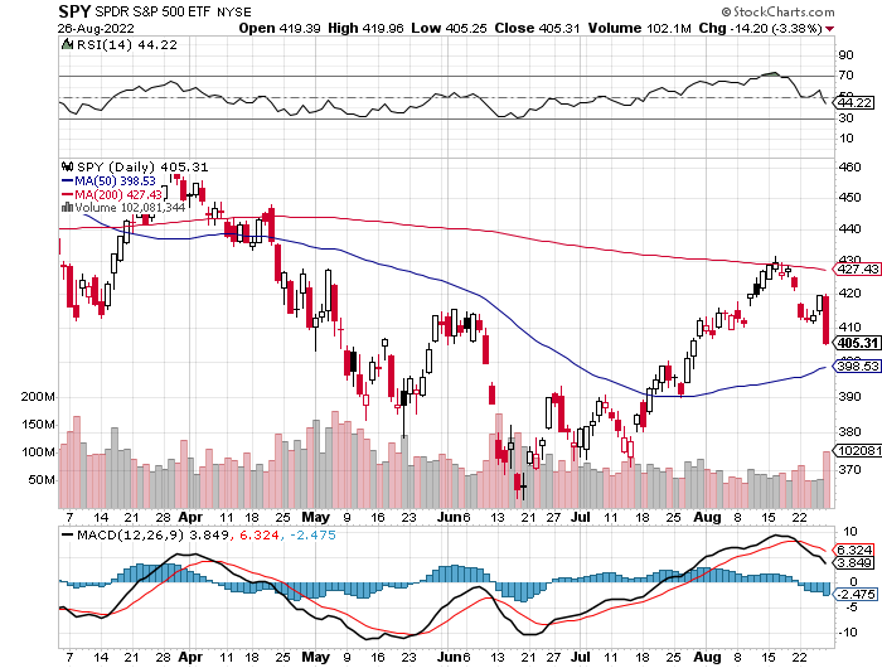
Q: Would you recommend selling a bear market rally when the S&P goes to 405?
A: The (QQQ) would be the better short, something like the $310-320 vertical bear put spread for February to bring in some free money. That’s what I'm planning to do if we get up that high, which we may not.
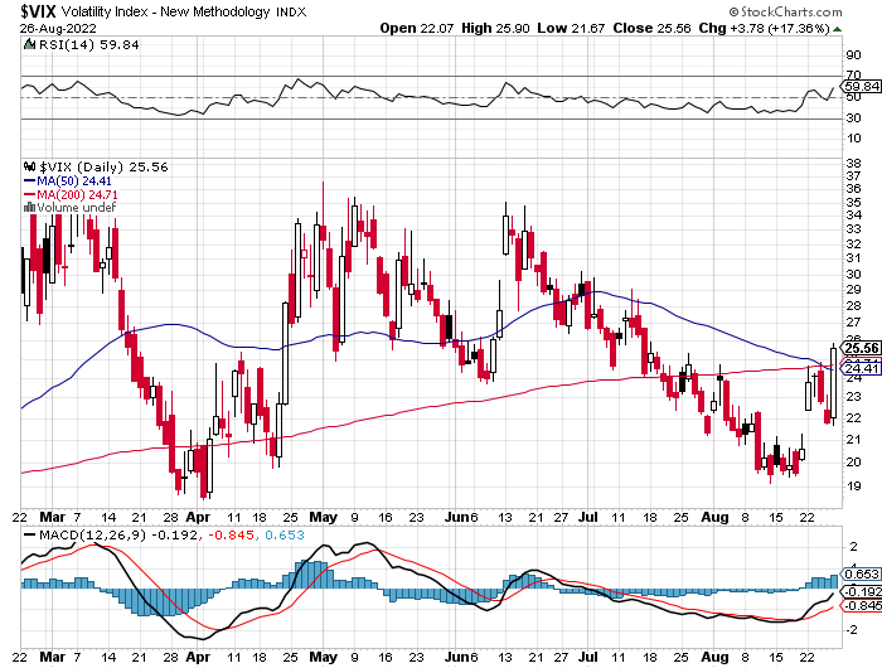
Q: How do you take advantage of a low CBOE Volatility Index (VIX)?
A: You don’t; there’s nothing to do here with the (VIX) at $22. My trades this year were not volatility trades—because we did them with low volatility, they were pure directional trades betting that the longs would go up and the shorts would go down and they all worked.
Q: Will Rivian (RIVN) survive?
A: Yes, they have two years of cash flow in the bank, and they’re boosting production. However, a high-growth, non-earning stock like Rivian is just out of favor right now. Will they come back into favor? Yes, probably in a year or so, but in the meantime, people are much happier buying Microsoft (MSFT) at a discount than Rivian.
Q: Do you ever buy butterfly spreads?
A: No, four-legged trades run up a lot of commissions, are hard to execute because you have 4 spreads, and have lower returns. They are also lower risk and for people who have no idea what the market is going to do. I don’t need the lower risk trades because I know what markets are going to do.
Q: Do you suggest any Microsoft (MSFT) LEAPS?
A: Yes, go out two years with LEAPS and go out about 50% on your strike prices. A 50% move here in Microsoft in two years is a complete no-brainer.
Q: With weakness in retail, rising inventories, and high consumer debt, will consumers dip into savings?
A: Yes they will, but that will predominantly happen at the bottom half of the economy—the part of the economy that has minimal to no savings. The upper half seems to be doing well—the middle class and of course, the wealthy— and are not cutting back their spending at all, which is why this seems to be a recession that may not actually show up. So, what can I say? The rich are doing great and everyone else is doing less than great, and stocks are reflecting that. Nothing new here.
Q: Would you hold off on tech LEAPS for a bigger selloff, or closer to April?
A: If we do get another big selloff and challenge the October lows, I’ll be pumping out those LEAPS as fast as I can write them; except then, a two-year LEAPS will have an April of 2025 expiration.
Q: I just signed up. What are the advantages of LEAPS?
A: A possible 10x return in 2 years with very low risk. I would suggest going to my website, logging in, and doing a search for LEAPS. There will be a piece there on how to execute a LEAPS, and the Concierge members can also find that piece by logging into their website.
Q: Best and worst sectors?
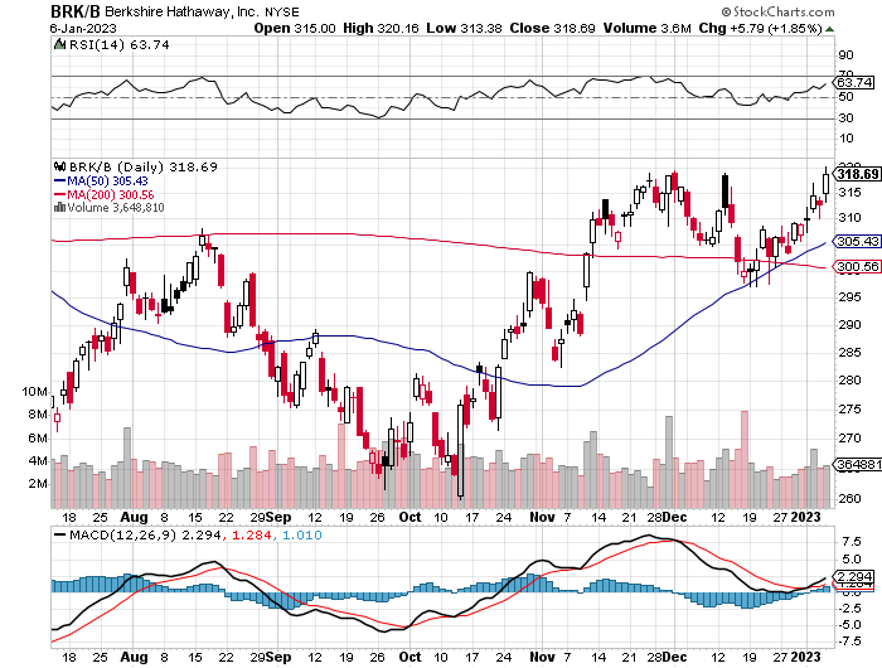
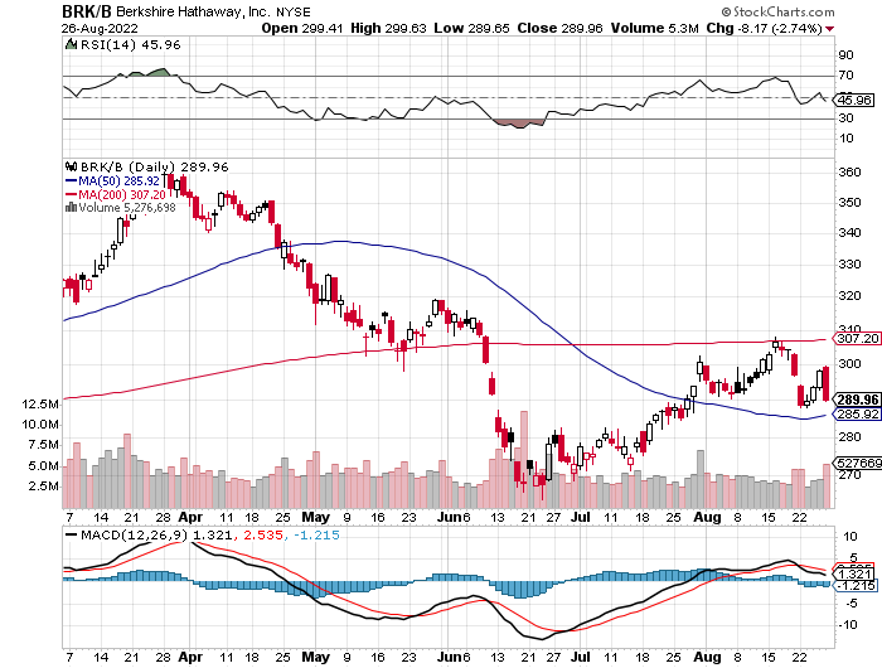
A: First half, already mentioned them. We like commodities, healthcare, financials, and Berkshire Hathaway (BRK/B) in the first half and tech in the second half.
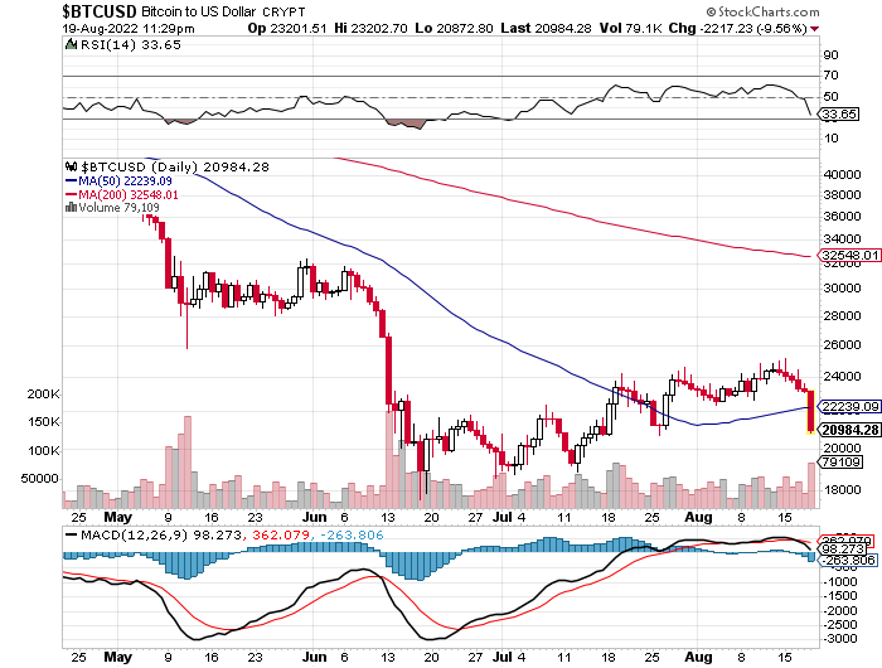
Q: Have we reached a low in cryptocurrencies?
A: Probably not, and I’ll tell you why I’ve given up on cryptos: I may not live long enough to see the bottom in crypto. It has Tokyo written all over it, and it took Tokyo 30 years to resume a bull market after it crashed in 1990. We’re still at the scandal stage where it turns out that the majority of these trading platforms were stealing money from customers. This is not a great inspiration for investing in that sector. When you have the best quality growth stocks down 80-90%; why bother with something that may not exist or may never recover in your lifetime? I’m out of the crypto business, but there are a wealth of crypto research sources still online and I’m sure they’d be more than happy to give you an opinion.
Q: Why have defense stocks like Raytheon (RTX) and Lockheed Martin (LMT) been weak recently?
A: A couple of reasons. #1 Just outright profit taking into the end of the year in one of the best-performing sectors. #2 The end of the war in Ukraine may not be that far off, and if that happens that could trigger a major round of selling in defense. We did get the three-day ceasefire over the Russian Orthodox New Year, that’s a possible hint, so that may be another reason.
Q: Political outlook on 2024?
A: It’s too early to make any calls, anything could happen; but if we get a repeat of the November election outcome, you could have Democrats retake control of both houses of congress—that’s where the betting money is going right now.
Q: Would you bottom fish in the United States Natural Gas Fund (UNG)?
A: No, I would not—I am avoiding energy like the plague. Remember the all-time low for natural gas is $0.95 per MM BTU, so we still could have a long way to go.
Q: Would you buy iShares China Large-Cap ETF (FXI) on a post-COVID breakout?
A: It looks like it’s already moved, so maybe kind of late on that. The problem is that in China, you don’t know what you are buying and the locals have a huge advantage in reading Beijing.
Q: What do you think about the Biden administration wanting to ban gas stoves?
A: That’s actually not a federal issue, it’s a state issue. California has already banned gas pipes for all new construction. It looks like New York will follow and that’s one-third of the US population. The goal is to replace them with electrical appliances which emit no carbon. I have a non-carbon house myself, I went down that path about 10 years ago, and it seems to be the only way to reduce carbon emissions—is to either price gasoline or oil out of the market, or to make it illegal, and they’re already making gasoline cars illegal, so gas and oil won’t be far behind. From 1900, we went from a hay powered economy to a gasoline-powered one in only 20 years so it should be doable.
Q: How can the push for all electric work well when we have so many shutdowns, much higher electricity cost, and cannot keep up with the demand already here?
A: Buy lots of copper for new local electric powerlines at the house level and buy lots of aluminum for the long-distance transmission lines. Global demand for both aluminum and copper has to triple to accommodate the grid buildout that is already planned. As far as hurricanes in Florida, there’s nothing you can do to stop those on a hundred-year view; I would move to higher ground, which is hard to do in Florida as the highest point in the state is only 345 feet and that’s a garbage dump.
Q: Can I get a copy of all these slides?
A: Yes, we post the PowerPoint on the website at www.madhedgefundtrader.com usually two hours after the production.
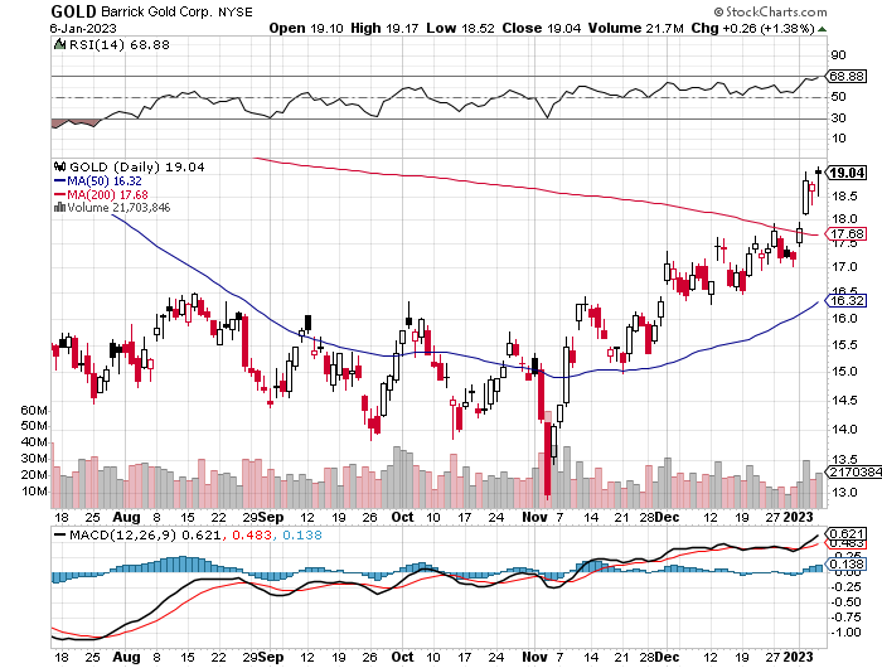
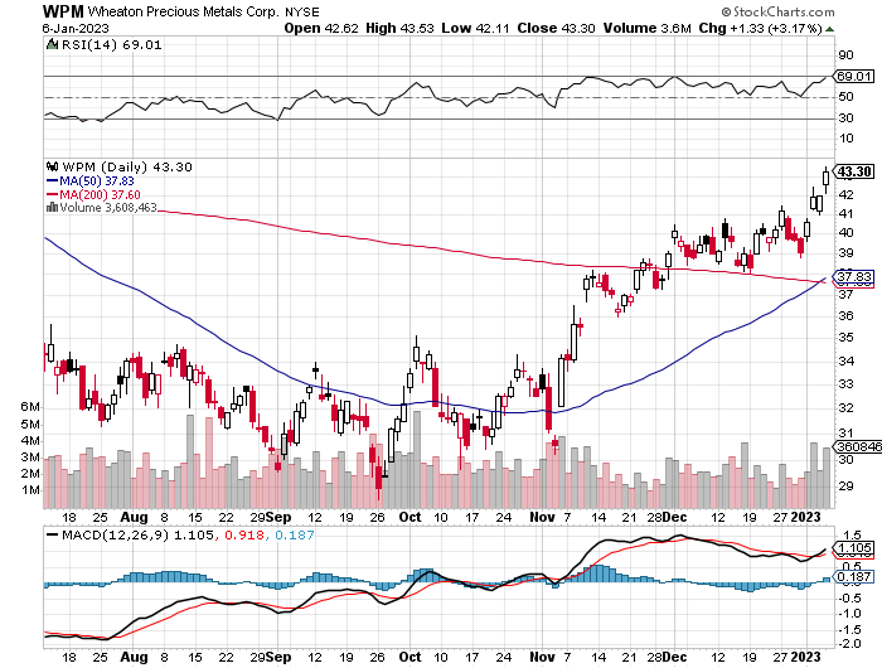
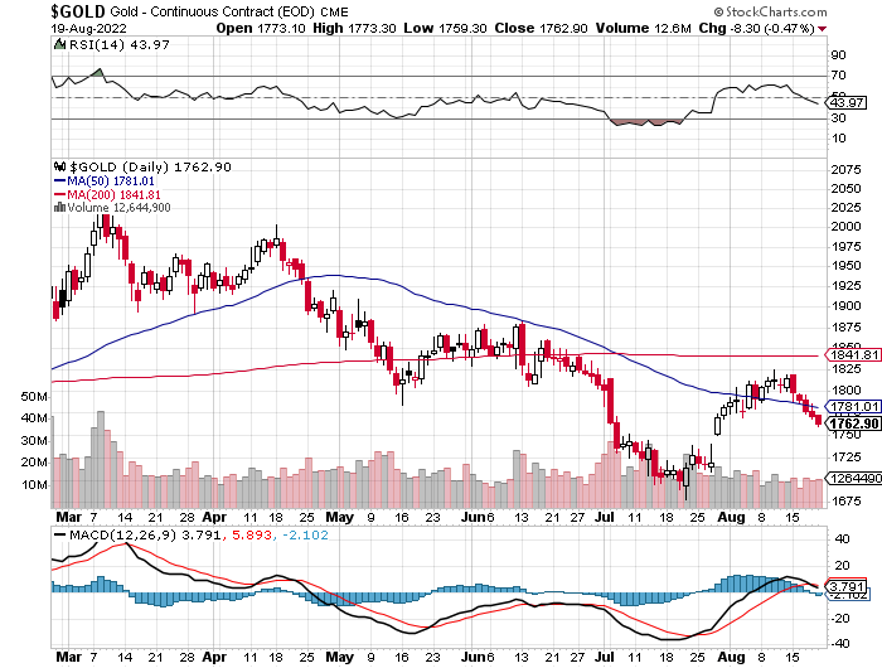
Q: Are you recommending buying precious metals right now (GLD), (GDX), (SLV), (and WPM) even after the upside breakout?
A: On upside breakouts, you buy the dips. A perfect dip would be a retest of the 200-day moving average. But we may not get that, since it seems to be everyone’s number-one choice right now. By the way, I haven’t been telling people to buy gold and LEAPS on all the gold plays since October—that’s where the big move has already been made.
To watch a replay of this webinar with all the charts, bells, whistles, and classic rock music, just log in to www.madhedgefundtrader.com, go to MY ACCOUNT, click on GLOBAL TRADING DISPATCH or TECHNOLOGY LETTER, then WEBINARS, and all the webinars from the last 12 years are there in all their glory.
Good Luck and Stay Healthy,
John Thomas
CEO & Publisher
The Diary of a Mad Hedge Fund Trader
CLICK HERE to download today's position sheet.
With the Israeli Army in Jerusalem in 1979


