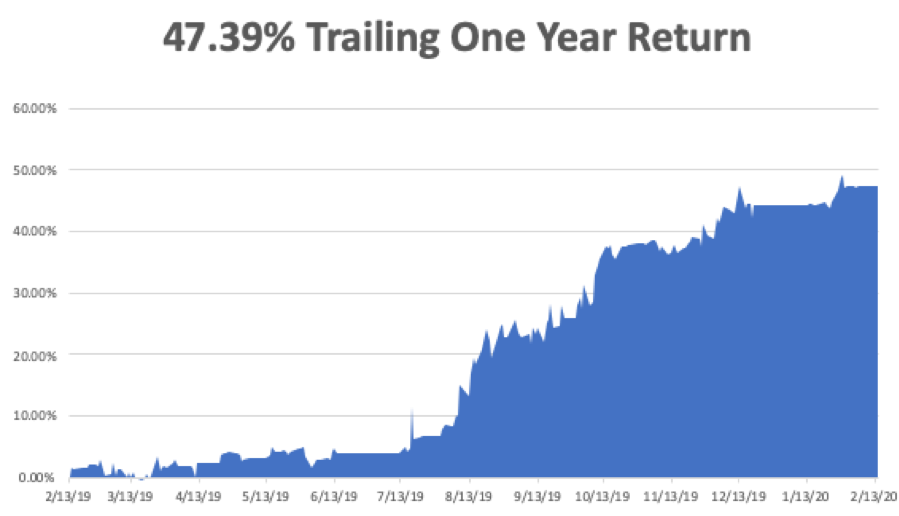
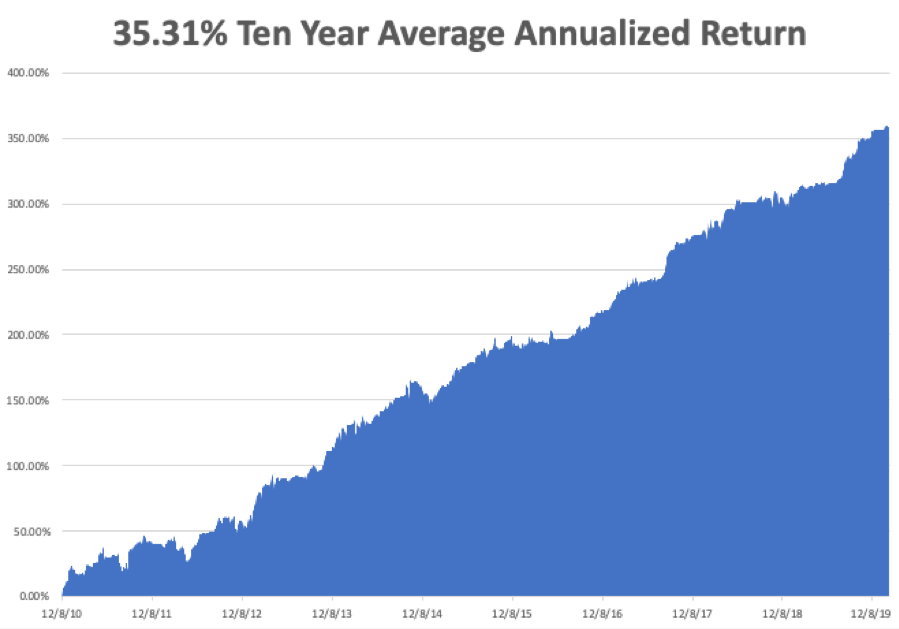
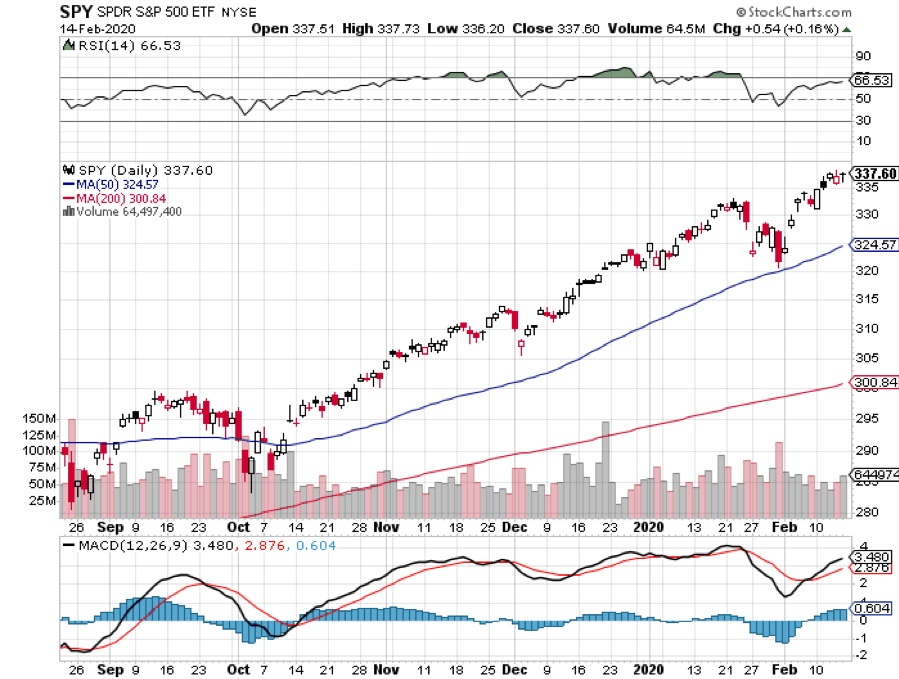
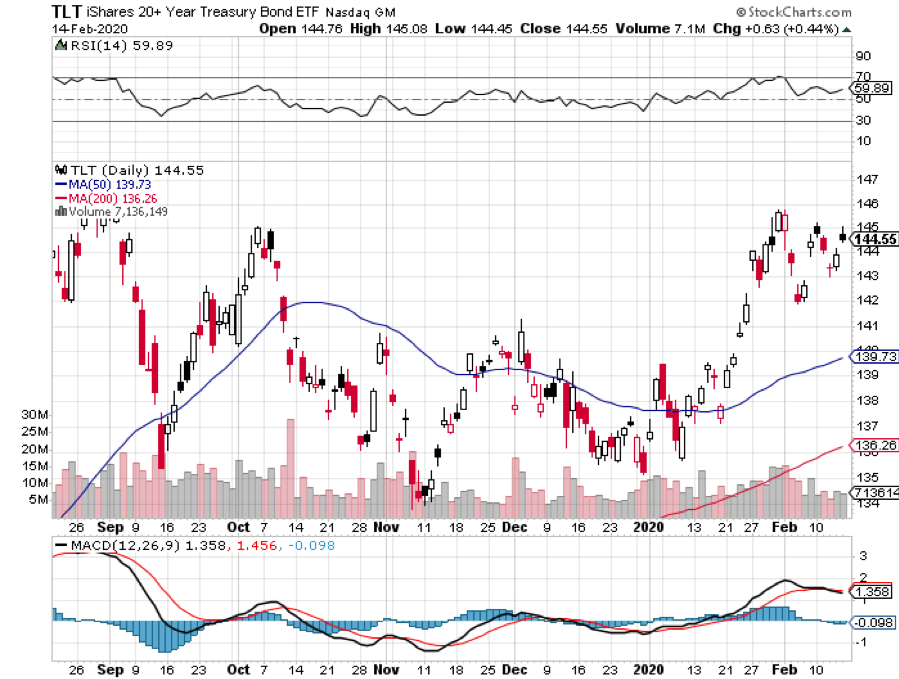
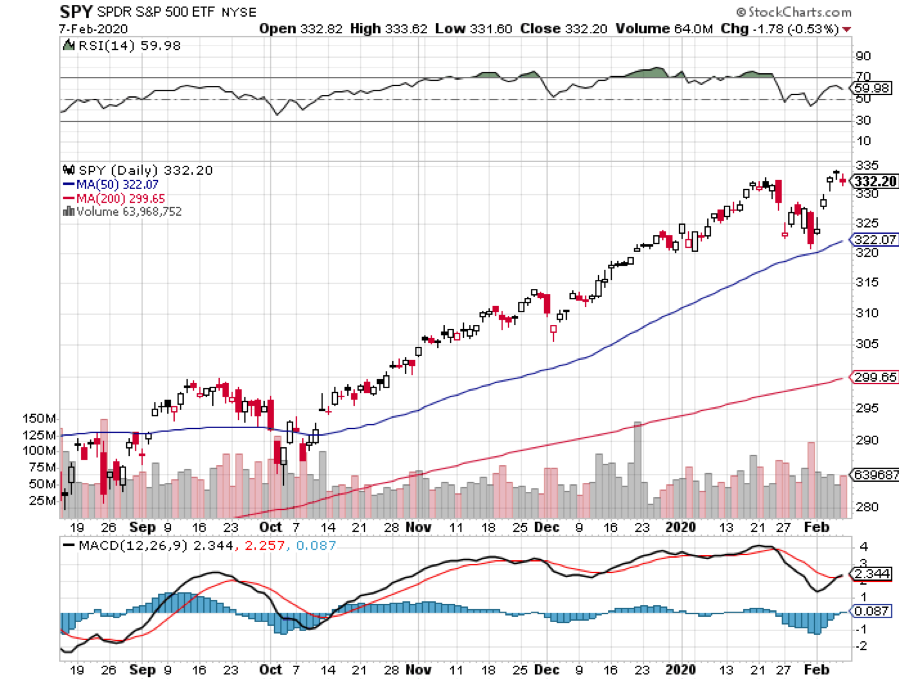
Bad China data?.Russia threatens the Ukraine?.more bad China data?.maneuvers at the Russia-Crimea border. The bull has been punched out with a market that was down every day last week, China and Russia both taking turns thrashing investors, like tag team wrestlers. When will it end?
The canaries in the coal mine will be found in the charts below. This is where you will first hear the all-clear signal, when it is safe to return with an aggressive ?RISK ON? posture.
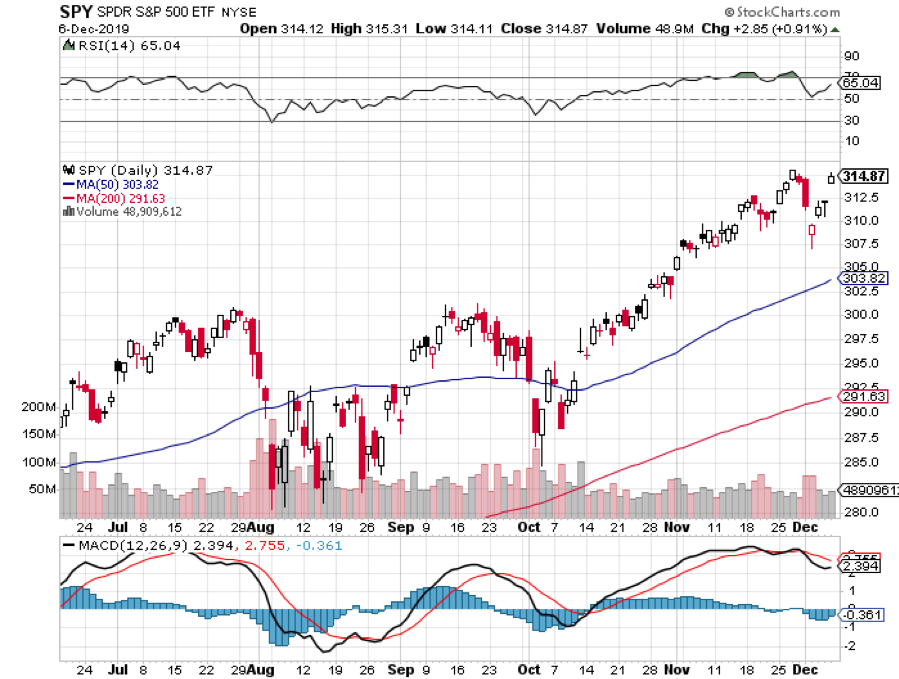
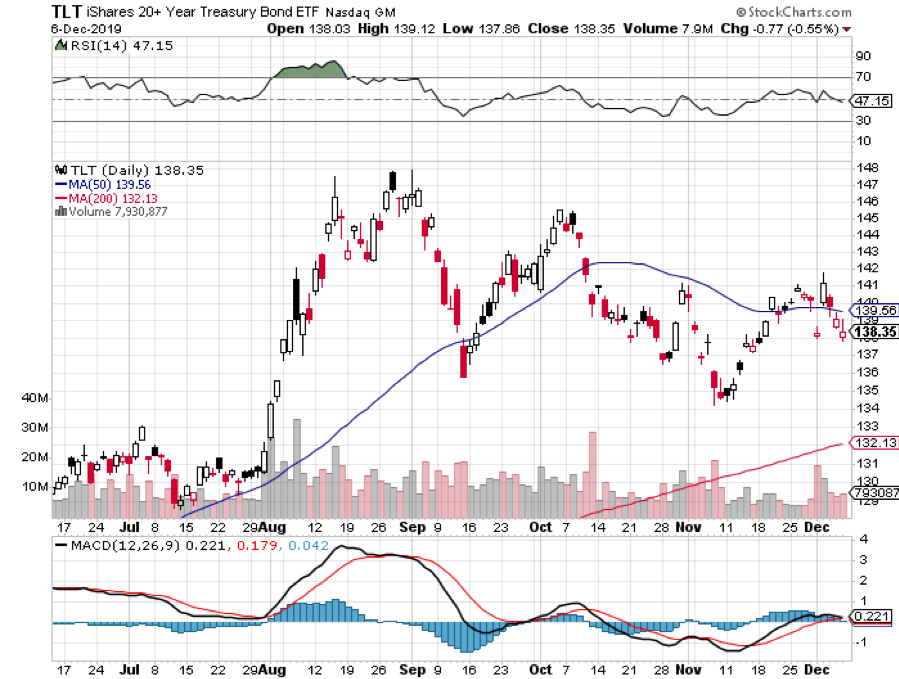
As always, watch the bond market. If the current rally in the (TLT) fails anywhere short of $110, it?s a sign that traders are fleeing the safety of the Treasury bond market and are happy to return to riskier assets, like equities. That equates to a ten year Treasury bond yield of just over 2.50%. A breakout of prices above this, and yields below suggest that more trouble is coming.
Keep close tabs on the Chinese Yuan (CYB). After an unrelenting five-year appreciation, it started a swan dive two weeks ago. That is when a banking crises in the Middle Kingdom started picking up steam. This prompted currency traders to unload Chinese renminbi for more stable dollars. The collapse of copper mirrors this. New signs of life in the Yuan and copper will hint that trouble there is over for now.
The Japanese yen is another big one to monitor. Most hedge funds borrow yen and sell them to finance long positions around the world. This is why the yen has been perennially week for the past two years. But when they dump these positions and hide under their beds, the reverse happens.
They buy back their yen shorts, pushing it up. That?s why the latest round of jitters has the Japanese currency probing four-month highs. If the yen fails here, it?s because investors are going back into the market for other assets.
Of course, the Russian stock market (RSX) is a no brainer to watch. Thanks to the antics of Vladimir Putin, it is down 28% so far in 2014, making it the world?s worst performing market this year. Invading your neighbors and threatening to incite WWIII is not good for your equities. I doubt he cares, but emerging market investors do.
Gold (GLD) is certainly earning its pay as a flight to safety instrument. It has been flying like a bat out of hell all year and is now testing major resistance. If the barbarous relic suddenly loses its luster, the memo will go out to buy paper assets once more.
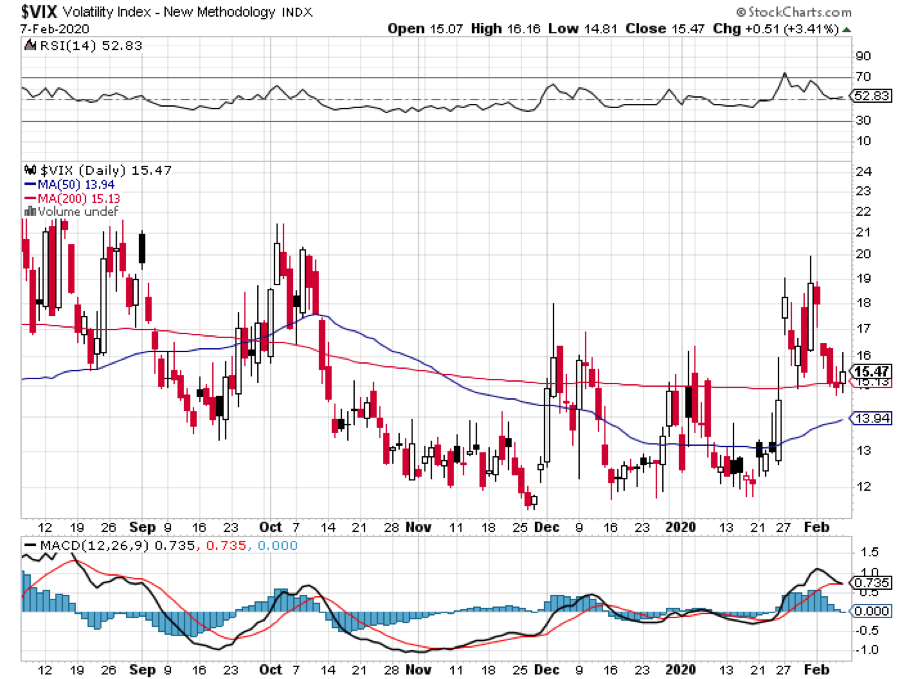
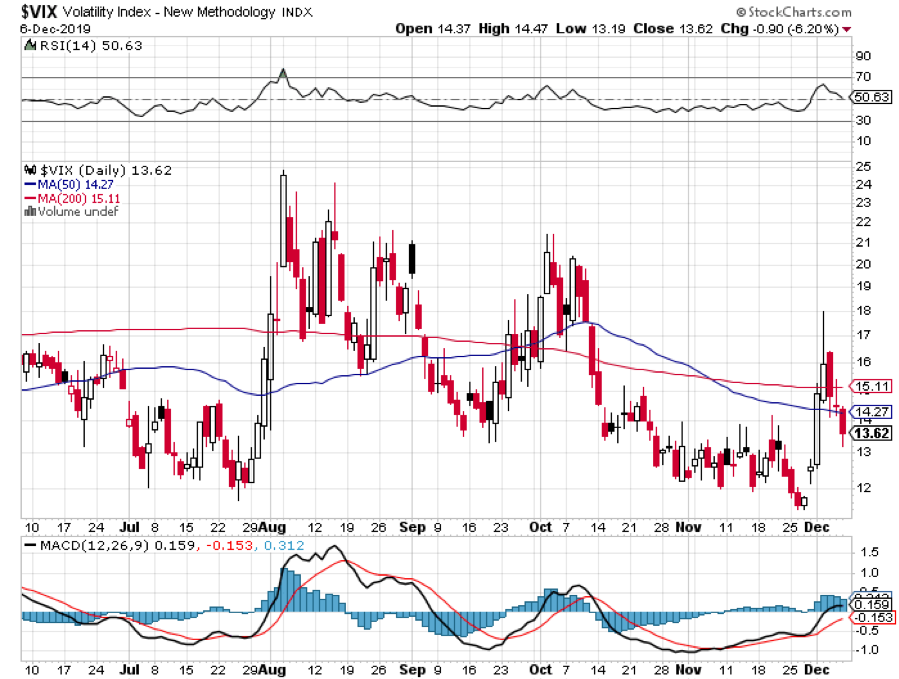
Finally, keep the chart for the Volatility Index (VIX) planted on the top of your screen. Recent tops have been around the $21 level, only $3 higher than the current level. When cooler heads prevail, the (VIX) will collapse once again. Puts on the (VXX) are the way to play this move.
The interesting thing about these charts is that they are all moving to the extreme edges of multi month ranges. So we could be one more flush away from the end of this move.
That?s unless Russia really does invade Crimea in force. Then all bets are off.
https://www.madhedgefundtrader.com/wp-content/uploads/2014/03/Atomic-Bomb.jpg334447Mad Hedge Fund Traderhttps://madhedgefundtrader.com/wp-content/uploads/2019/05/cropped-mad-hedge-logo-transparent-192x192_f9578834168ba24df3eb53916a12c882.pngMad Hedge Fund Trader2014-03-17 01:04:512014-03-17 01:04:51Charts to Watch For an End to the Crisis
I believe that we are on the verge of seeing major reversals across all asset classes. Get this one right, and you will make a fortune. Screw it up, and you will soon be looking for your next job on Craig?s List.
I understand that there is a desperate need for code writers in the cloud.
As always, I am taking my cue from the bond market. The great anomaly in the financial markets during February was the big divergence between the stock and bond markets.
While it was off to the races for stocks, the S&P 500 rocketing an impressive 7%, bonds didn?t believe it for a nanosecond.
If you had asked any global strategist a month ago where the ten year Treasury yield would be if the (SPX) posted a new all time high at 1,865, to a man they would have said 3.05%. Instead, bonds closed the week at a parsimonious 2.65%.
Something is desperately wrong with this picture.
If it were just bonds blowing a raspberry at this stock rally, I wouldn?t be so concerned. However, both the Euro (FXE) and the Japanese yen (FXY), (YCS) moved from strength to strength. They should be falling in a real bull market for stocks.
Precious metals have also been calling foul. If shares were the new risk free investment, why did gold pop by 9% last month? Better yet, why is silver up a sparkling 18%?
The gold producers have done even better. When Barrick Gold (ABX) soars by 26% in s single month, you?ve got to be worried about the stock market.
So here?s what happens next. With an assist from the Russian takeover of the Ukraine (wasn?t it so polite of them to wait a full week after the Sochi Olympics ended?), bonds take a run at the highs for prices and the low for yields, in the mid 2.50%?s.
This is why Mad Day Trader, Jim Parker, shot out a quick, opportunistic long play in the (TLT) last week. There, they will fail once again, as we are now in the early stages of a multi decade bear market.
This will prompt stocks (SPX) to give up a third to a half of the recent rally, taking it to the bottom of an ascending channel at 1,800 (see below). Volatility (VXX) will spike from the current $12 handle back up to $20. This is why I bought the (SPY) $189 - $192 bear put spread on Thursday, which expires on March 21.
When the bond rally gives up the ghost, shares will resume their 2014 surge. Avoid emerging markets (EEM), because another dump in the bond market knocks the stuffing out of them one more time.
What will the currencies do? This will be the starting gun for great short plays on the yen, which returns to a ten-year bear market, and the Euro, which is just tweaking a three-year high.
In the meantime, the dollar basket ETF (UUP) launches into a multi month rally after putting in a double bottom. I shouldn?t need to draw lurid drawings for you on how to trade this.
As for gold? Sorry in advance to the hard money crowd, the inflationistas, and conspiracy theorists (who cares if Germany wants its gold reserves back from the Federal Reserve?). I think the 2014 rally in the barbarous relic dies a sudden, horrible death, and goes back to retest the $1,200 low one more time, possibly breaking it.
This scenario opens up great entry points across virtually all of the many asset classes that I track. When it?s time to strap on a position, I?ll shoot out Trade Alerts as fast as the speed of electricity permits (186,000 miles per second, or 300 meters per second in Europe).
Yes, I think we will finally get a real 10% correction in stocks going into the summer. But you better be nimble to trade it. My experience tells me that too many of you are selling at market bottoms, not buying.
https://www.madhedgefundtrader.com/wp-content/uploads/2014/03/John-Thomas-Snorkel.jpg340447Mad Hedge Fund Traderhttps://madhedgefundtrader.com/wp-content/uploads/2019/05/cropped-mad-hedge-logo-transparent-192x192_f9578834168ba24df3eb53916a12c882.pngMad Hedge Fund Trader2014-03-03 01:05:232014-03-03 01:05:23All Asset Class Risk Reversal at Hand
Let me give you my thinking here. I am a long-term bull, expecting the S&P 500 to be up 10% or more to over 2,000 by yearend, and possibly 20,000 by 2030. But yearend is a long time off (even though every year seems to go by faster). We have just had a massive 11 point pop in the (SPY) during my two week trip to Australia. So a period of digestion is called for.
My (BAC) $15-$16 bull call spread is now naked long, so a little bit of downside protection is justified. Keep in mind that this is only a partial hedge, not a full one. But the additional potential profit from this SPDR S&P 500 March, 2014 $189-$192 bear put spread does lower the breakeven price of the (BAC) position by a respectable 46 cents.
The present dynamics of the market favor this trade. All of the action is now in speculative, momentum driven names like Tesla (TSLA), Netflix (NFLX), Facebook (FB), Priceline (PCLN), and Yelp (YELP), which are not even in the (SPY) index. The big leadership names, like financials (XLF) and energy (XLE) are pretty much dead in the water. As long as this is the case, don?t expect any big moves in the (SPY).
And with a short dated March 21 expiration, we only have 15 trading days where we need to be right on this.
As a rule of thumb, don?t chase this spread trade if the price has already moved more than 2% by the time you get the Trade Alert. Just put in a limit order and if it gets done, great. If not, wait for the next Trade Alert. There will be plenty of fish in the sea.
The best execution can be had by placing your bid for the entire spread in the middle market and waiting for the trade to come to you. The middle market is the halfway point between the bid and the offered prices that you see on your screen with your online broker.
The difference between the bid and the offer on these deep in-the-money spread trades can be enormous. Don?t execute the legs individually or you will end up losing much of your profit. Keep in mind that these are ballpark prices only. Spread pricing can be very volatile especially on expiration months farther out.
https://www.madhedgefundtrader.com/wp-content/uploads/2012/07/monks.jpg186183Mad Hedge Fund Traderhttps://madhedgefundtrader.com/wp-content/uploads/2019/05/cropped-mad-hedge-logo-transparent-192x192_f9578834168ba24df3eb53916a12c882.pngMad Hedge Fund Trader2014-02-28 01:04:312014-02-28 01:04:31Why I?m Selling Short the Market
Bank of America (BAC) certainly was the chief whipping boy of the financial crisis. Since 2008, it has paid out more than $50 billion in fines and lawsuit settlements for every transgression under the sun.
After getting a bail out from the US Treasury, it was forced to cut its dividend payment to a token one cent. Do any Google search on the company and you are inundated with a flood of bad news.
All that is now ancient history. The entire banking industry is now moving into the sweet spot in the economic cycle. This is because rising interest rates mean that they will be able to charge more for leans, while their cost of funds (deposits and equity) remains low. This rising spread falls straight to the bottom line.
With the 30 year bull market in bonds now at an end, substantially higher rates in the near future are now included in virtually every economic forecast out there. Since the beginning of 2014 the ten-year Treasury yield has rocketed from 3.05% to as high as 2.58%, pummeling bank shares.
What happens next? They go from 2.58% back up to 3.05%, then a lot more. Bank shares will ride on the back of this bull.
The jungle telegraph is now ringing with the prospect of a dividend hike by the company, from a penny to five cents. The implications of such a move are broad.
For a start, the company would have to get the permission of the Federal Reserve to do so. If it pulls this off, it is only because of renewed confidence by the government in the improved financial condition of the country. After several capital raises and the liquidation of the wreckage of the 2008 crash, US banks are now the healthiest in history, with balance sheets of bedrock stability.
If (BAC) can get this first dividend hike through, more will follow. To get the dividend yield on the shares up to industry standard of 2.5%, the company really needs to raise its dividend to 40 cents. If certainly has the cash flow to do this. In 2013, (BAC) reported net income of $11.4 billion, more than four times to amount needed to cover such a payout.
Needless to say, this is all great news for the share price. The prospective return of increasing amounts of capital to shareholders should suck in new and wider classes of shareholders. It won?t be just about hedge fund punters anymore.
Take a look at the charts below, and it is clear that such a move is setting up. (BAC) is reaching the end of a classic triangle formation, which traditionally resolves itself to the upside. You can find more dry powder in the chart for the Financials Select Sector SPDR ETF (XLF), which clearly rejected a complete breakdown at long term trend support in early February.
Finally, take a gander at the chart for the S&P 500. New life from the financials will be the adrenaline shot this market needs to break it out of its current low volume sideways consolidation, taking it to new highs.
This is why I popped out the trade alert to buy the (BAC) March $15-$16 call spread on Monday. Thanks to the denial of service attack on our email provider, AWeber Communications, it has taken me until now to get this update out.
It is all another reason to sign up for the Mad Hedge Fund Trader?s text alert service, which readers around the world received within an incredible ten seconds of the original issue of the Trade Alert. I saw it work its magic when I was in Australia, and it is a sight to behold.
https://www.madhedgefundtrader.com/wp-content/uploads/2014/02/Bank-of-America.jpg287521Mad Hedge Fund Traderhttps://madhedgefundtrader.com/wp-content/uploads/2019/05/cropped-mad-hedge-logo-transparent-192x192_f9578834168ba24df3eb53916a12c882.pngMad Hedge Fund Trader2014-02-27 09:30:472014-02-27 09:30:47Dividend Hike Could Send Bank of America Flying
For the last couple of nights, I have left my iPhone logged into the Argentina peso market, one of several troubled currencies igniting the emerging market contagion. Whenever the peso losses another handle to the US dollar, an alarm goes off. That gives me a head start on how American markets will behave the next day.
I have not been getting a lot of sleep lately. My poor phone has recently been sounding off like a winning slot machine at a Las Vegas casino.
Take a look at the long-term chart for the peso, and it?s clear that some traders have not gotten any sleep for five years, when the peso cratered 50% against the greenback. An imploding currency, soaring national debt, and sliding economy promise to send it lower.
Incompetent leadership doesn?t help either. You know that things are bad when your ships get seized by creditors when they land at foreign ports.
When I wrote my all asset class forecast for 2014, there was only one thing I knew for sure: this year would be harder than last. That has been my best prediction for 2014 so far.
The guaranteed shorts, those for the Japanese yen (FXY) and the Treasury bond market (TLT), have been rocketing to the upside since the opening bell rang on January 2. The no brainer longs, like financials (XLF) and consumer discretionaries (XLY), have been plummeting.
The heart wrenching 4.3% correction we saw for the S&P 500 (SPY), and the 5% hit for the Dow average this month, the worst weekly draw down in two years, has predictably brought the Armageddon crowd out of the closet once again. All of a sudden, a 10% correction best case, and Dow 3,000 worst case, are on the table once again. Do they have a leg to stand on?
Not really.
To achieve these big numbers on the downside, your really need a global systemic financial crisis. There isn?t one remotely on the horizon. Yes, there are difficulties in Argentina, the Ukraine, and Turkey. But they are locally confined.
Together, these countries account for less than 1% of global GDP. If they disappeared completely, they would barely make a blip in world GDP. They certainly are not important enough to panic you into emptying your ATM at the local mall on your next lunch break.
You also need excessive leverage. But that has been banned by prime brokers since the 2008 crash. An aggressive long today is 20% net long, not 200% as in the bad old days of yore. Nothing systemic there.
Sure, we aren?t getting the juice that we used to from the Federal Reserve. It is likely that they will further reduce the taper from $75 billion to $65 billion of bond buying per month at their 1:00 PM Wednesday press release.
If there were a one in a million chance that this would trigger a real market meltdown, my friend, Fed governor Janet Yellen, would run that release through the shredder as fast as you could say ?Go Bears?, sending markets flying.
Others are accusing a looming financial crisis in China as another culprit. Yes, the economic data has been soggy of late, to be sure. However, that is just the continuation of a four year old trend. You can safely forget about that one.
No country in history ever suffered a financial crisis with $4 trillion in foreign exchange reserves on hand, including over $1 trillion in US Treasury bonds close to all time highs in value. In fact many of the emerging markets said to be in trouble also boast large reserves, the product of running massive trade surpluses with a hyper consuming West for the past decade.
So if we can?t blame emerging markets or the taper for the downside, then what is causing the January swoon? You can blame it all on the hedge funds.
I have seen this time and again. Whenever too many people crowd into one end of a canoe, it rolls over. When the majority of funds have identical positions, they are guaranteed to fail. That is why we have had a looking glass market performance since the beginning of this year.
Except that this time we got a turbocharger. The peaking of concentration in the most popular trades perfectly coincided with the big New Year reallocation trade, taking prices to greater extremes. Much of the selling you are seeing down here is from latecomers who bought stock only three weeks ago and are now puking them out.
Of course, I saw all of this coming a country mile off. This is why I cut my net long from 100% 10 days ago to only 10%. It is why I am maintaining a year to date performance of +5.13%, compared to a Dow that is down -5%. It is one of my best gains relative to the index over a short period ever.
The same is true of my colleague, Mad Day Trader, Jim Parker. He is almost all in cash and is also well up on the year. He stuck his toe in the water with a small position in some calls on the (TBT) last week, but it got bit off by a shark almost immediately. So he quickly stopped out, as is his way. Of course, we have been comparing notes and sharing input throughout the selling. It appears that great minds think alike.
Jim?s proprietary in-house analysis predicts that the (SPX) will bottom out just above 1,730, the market close on the November 15 options expiration. If correct, that would give us a total start to finish correction of only 6.7%, which is in line with every other correction for the past two years. But the bottoming process could last a few weeks, and provide several more gut churning dumps. Fasten your seat belt.
When will this end? Watch for the parallel confirming cross market trends. The Treasury bond market is a big one, which appears to be peaking already, right at its 200 day moving average and the top of a six month trading range.? Announcement of the next taper could spark the selloff we need there. The Japanese yen is also important. A top here could signal a return to the carry trade and ?RISK ON?.
Since Emerging markets were the instigator of the crisis, look there as well for the first signs of a turnaround. Scrutinize the chart below, and you gain some heart.? It shows that we are a scant 70 cents from setting up a potential multiyear triple bottom at $37, and worst-case $36.
More specifically, you want to see Turkey (TUR), another instigator of this crisis, recoil from $39. Expect it to bounce hard there, as long as the world is really not ending.
Then it will be off to the races once more. I?ll be keeping my powder dry until then. Watch this space.
https://www.madhedgefundtrader.com/wp-content/uploads/2014/01/Gunpowder-barrel.jpg382381Mad Hedge Fund Traderhttps://madhedgefundtrader.com/wp-content/uploads/2019/05/cropped-mad-hedge-logo-transparent-192x192_f9578834168ba24df3eb53916a12c882.pngMad Hedge Fund Trader2014-01-28 09:25:562014-01-28 09:25:56What the Markets Will Do from Here
I can?t believe how fast the year has gone by. It seems like only yesterday that I was riding the transcontinental railroad from Chicago to San Francisco, writing my 2013 All Asset Class Review. Now 2014 is at our doorstep.
As usual, the market has got it all wrong. There is not going to be a taper by the Federal Reserve next week. If there is, it will be only $5-$10 billion, which means that $70-$75 billion a month in Fed bond buying continues. Either way it is a win-win.
However, managers are eternally loath to trade against an unknown, hence the weakness we are seeing this week. I think that we have entered another one of those sideways corrections that has been a hallmark of the market all year, and that there is a reasonable chance that we saw the low of the entire move down this morning at 1,780 in the S&P 500.
That sets up a dead, range trading market into the Fed decision next Wednesday afternoon. Once their Solomon like choice is out, it will be off to the races for the markets once again, probably all the way until 2014.
However, we are heading in the Christmas holidays, when volume and volatility shrivel to a shadow of its former selves, with daily ranges often falling within 50 Dow points. So it is important to have a large short volatility element to your portfolio.
That way, you will make money on every flat day, of which there should be many. That?s why I have 70% of my current model-trading portfolio invested in call spreads.
My current holding in the (SPY) has me profitable at all points above $175.68. If we move below that, any losses should be more than offset by profits thrown off by the rest of the portfolio. The same is true for my call spread in the financial ETF (XLF).
The Japanese yen is clearly in free fall, probing new lows almost every day. That should take the (FXY) to $95, and explains my triple weight 30% holding in the area. Bonds (TLT) just can?t get a break, failing to rally over $105 for the third time. Lower levels beckon, making my bear put spread look pretty good, my second one this month.
With a dramatically weakening yen, you have to add to Japanese equities, which will benefit hugely. That?s why I doubled up on my position in Masayoshi Son?s Softbank (SFTBY) this morning. The day they announce the Ailibaba IPO, probably early next year, these shares should be up 10%-20%.
To summarize, this portfolio is perfectly set up for the following: ?A sideways move for four more trading days, then an upside breakout after the Fed decision, then going to sleep inside a slow grind up over Christmas and New Years.
The grand finale should come on January 2, the first trading day of 2014, when I expect the value of the portfolio to pop a full 5% or more. This will be delivered by a massive new wave of capital into the markets, which for calendar and legal reasons couldn?t be invested until this day.
What will they buy? Everything that worked last year. After all, that?s why these managers were hired. Why not start the New Year with a bang, and then spend the rest of the year trading against that profit.
https://www.madhedgefundtrader.com/wp-content/uploads/2013/01/Zephyr.jpg342451Mad Hedge Fund Traderhttps://madhedgefundtrader.com/wp-content/uploads/2019/05/cropped-mad-hedge-logo-transparent-192x192_f9578834168ba24df3eb53916a12c882.pngMad Hedge Fund Trader2013-12-13 01:05:282013-12-13 01:05:28My Market Take for the Rest of 2014
Those who lived through the cataclysmic ?flash crash? that occurred precisely at 2:45 pm EST on May 6, 2010, have been dreading a replay ever since. Their worst nightmares may soon be realized.
That is when the Dow Index (INDU) dropped a gob smacking 650 points in minutes, wiping out nearly $1 trillion in market capitalization. On that day, some ETF?s saw intraday declines of an eye popping 75% before recovering. A flurry of litigation ensued where many sought to break trades as much as 99% down from the last indication, some successfully.
The true reasons for the crash are still a matter of contentious debate. Many see a smoking gun in the hands of the high frequency traders who account for so much of the daily trading volume. But I happen to know that many of these guys pulled the plugs on their machines and went flat as soon as the big move started.
I think that it was the obvious result of too many people following similar models in markets with declining liquidity. The ease of instant execution through the Internet was another contributing factor. It also could be a symptom of no growth economies and lost decades in the stock market. The increasing short-term orientation of many money managers also played a hand.
Mathematicians who follow chaos theory and ?long tail events? known as ?black swans? argue that the flash crash was not only inevitable, it was predictable. They are also saying that the next one could be far worse.
Since then we have suffered several mini flash crashes. These include the recent $200 collapse in gold, a $5 plunge in silver, a five-cent gyration in the Euro, and a ten-cent gap in the Swiss franc. Notice that these ?flash? events only happen on the downside, and that we don?t have flash melt ups.
In many respects, traders and portfolio managers dodged a bullet on that fateful day. What if it had happened going into the close? Then assets would have been marked to market less $1 trillion, and the Asian openings that followed hours later would have been horrific. This could have triggered a series of rolling flash crashes around the world from time zone to time zone that would have caused several trillion more in losses. Those losses eventually did happen, but they were spread over several more months at a liquidation rate that could be absorbed by the markets.
Regulators claim that they have reduced the risks of a flash crash through the enforcement of daily trading limits across a broader range of financial instruments. I am not so sure. During a real panic, preventing people from unloading risk is almost an impossible feat. I know because I have lived through many of them.
In the meantime, the S&P 500 continues its inexorable rise well above the exact point at which the last flash crash started, at 1,160. We are now 55% above that last flash point. Avoid, like the plague, shorting leveraged naked puts on anything. It is the best way to wipe out your entire equity that I know of.
Like me, you are probably too old to start life over again with a job at McDonald?s, and they probably would take you anyway.
https://www.madhedgefundtrader.com/wp-content/uploads/2013/11/You-Tube.jpg396507Mad Hedge Fund Traderhttps://madhedgefundtrader.com/wp-content/uploads/2019/05/cropped-mad-hedge-logo-transparent-192x192_f9578834168ba24df3eb53916a12c882.pngMad Hedge Fund Trader2013-11-21 11:45:492013-11-21 11:45:49The Flash Crash Risk is Rising
I often use my own profit and loss statement as a leading market indicator. Whenever I am blessed with a windfall profit, it is frequently time to sell. On those rare occasions when I take a big hit, it is invariably time to buy.
This is one of those times.
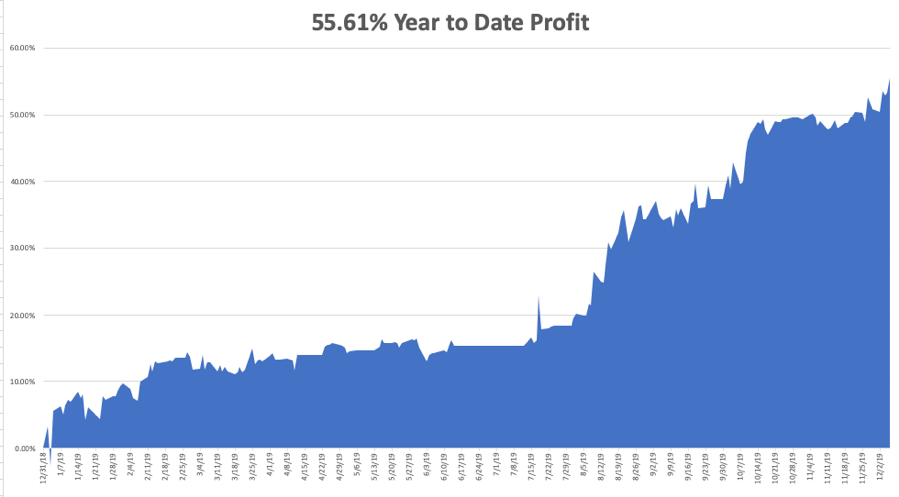
Since November 1, the Trade Alert service of the Mad Hedge Fund Trader has earned a white-hot 12.12%, taking my year to date return up to 56.62%. The last 19 consecutive Trade Alerts have been profitable.
Performance bursts like this occur, not because I have suddenly gotten a lot smarter. If anything, my advanced age assures that I am headed in the opposite direction on that front. It is far more likely that upward spikes in my P&L happen because the market is getting overheated, at least for the short term.
So I think that it is time to take my foot off the accelerator, cut back and neutralize my model trading portfolio, and sit down and smell the turkey. In any case, with 43 Trade Alerts going out this month, I am running the risk of overtrading.
It is very impressive to see how fast the options markets are crushing implied volatility. This means the market doesn?t think much is going to happen over the next few weeks. The stock market has been up for the last seven weeks in a row, a rare event. Portfolio managers are bathing in once unimagined riches and have visions of bonus checks dancing in their eyes.
This is all a nice set up for 3%-4% Thanksgiving mini correction. The market is now wildly overbought on a short-term basis, and I can?t be the only one exhausted from the sheer volume and intensity of the recent market action.
That is why I knocked out two short positions today in the form of the SPDR S&P 500 (SPY) December, 2013 $183-$186 bear put spread and a the Russell 2000 iShares (IWM) December $113-$116 bear put spread. It?s not a huge bearish bet, just a modest one. And these both take advantage of the fact that market volatility will probably die a slow death going into the holidays.
I am going to hang on to my other long positions, since they are so far in the money that the safety cushion to my breakeven point is large.
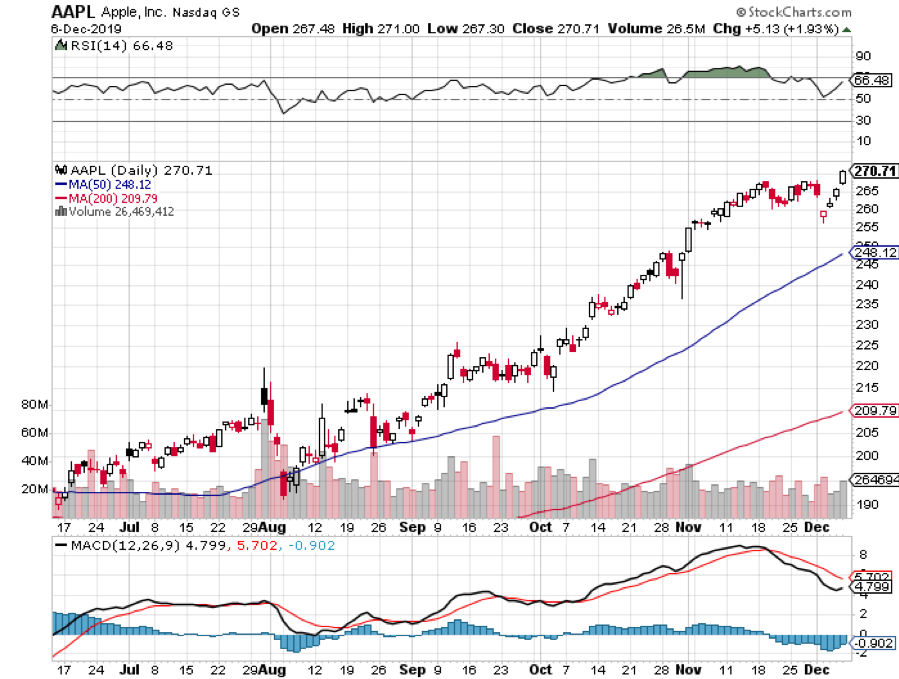
Apple (AAPL) is moving into its peak earnings period. Citibank (C) is surfing the wave of money pouring into long neglected financials. Ditto for the Industrials ETF (XLI). The Japanese yen (FXY) will probably break to new lows for the year in coming weeks, so I am looking to add on any strength. Bonds (TLT) are trading like the life has been sucked out of them, so the short side is the correct posture there.
Whatever pause in the market action we get will be a brief one. Take a look at the chart below put together by my friends at Business Insider. Despite all the bubble talk by the clueless media, we are in fact still at the bottom of the range for the S&P 500 forward 12-month PE ratios for the past 15 years.
Assume that corporate earnings rise 10% a year for the next four years. Then assume that earnings multiples also rise by 10% a year, taking us back up to the 22 times found at the top of the 15 year multiple range. That gets the (SPX) up to 3,732 by the end of 2017, a near double from today?s 1,790.
Not only has 2013 been a great year, so will 2014, 2015, 2016, and 2017. We are in the midst of a new Golden Age of equity investment.
https://www.madhedgefundtrader.com/wp-content/uploads/2013/11/Bathtub-Girl-Money.jpg259575Mad Hedge Fund Traderhttps://madhedgefundtrader.com/wp-content/uploads/2019/05/cropped-mad-hedge-logo-transparent-192x192_f9578834168ba24df3eb53916a12c882.pngMad Hedge Fund Trader2013-11-20 01:05:282013-11-20 01:05:28The Market Takes a Break
Today, many followers of the Mad Hedge Fund Trader?sTrade Alert service have up to eight November option spreads expiring at their maximum potential profit.
My strategy of taking advantage of the short November expiration calendar and betting that the markets stay in narrow ranges turned out to be wildly successful. At this stage I am batting eight for eight. If these all work, then I will have issued 15 consecutive profitable Trade Alerts since October, something most hedge fund managers would die for at this time of the year.
I have already taken profits on five of my November positions, but judging from the email traffic, many of you are hanging on to the bitter end and have asked me how to handle these.
It?s really easy. You don?t have to do anything. Nada, Squat.
Trading in the underlying ceases today, Friday, November 15 at 4:00 PM EST. The contracts legally expire on Saturday night, November 16. The cash profit is then credited to your account on Monday, November 18, the margin freed up, and the position disappears into thin air.
Only the (SPY) November 2013 $180-$183 bear put spread is giving us a run for our money. As I write this, the (SPY) is trading at$179.27, and we are a mere 73 cents in the money on the $180 puts that we are short.
If the (SPY) closes on Friday over $180, then you will be short 100 shares for every contract of the November $180 puts that you are short. Your long position in the November, $183 puts expired on Friday, so you will be naked short. This is not a position you want to have.
It is always best to cover this at the opening on Monday morning to limit your losses and keep your risk from running away. You may also not have sufficient margin to run a naked short, so If you don?t liquidate, your broker will, probably at a worse price.
Don?t try to trade a leveraged short (SPY) position in a bull market. It?s probably beyond your pay grade, and I doubt you?ll sleep at night.
I?m betting that the (SPY) will close on Friday below $180, so I am hanging on to my position. With only one single day to expiration, it is a coin toss what will happen. But with the markets this sluggish, if I am wrong, it will only be by pennies. Quite honestly, being up 56% on the year I don?t mind taking a gamble here.
I know all of this sounds very complicated to the beginners among you. Don?t worry, this all becomes second nature after you?ve done the first few thousand of these.
If you have any doubts, call your broker and they will tell you what to do, especially the part about you needing to do a thousand more trades.? Here, an ounce of prevention is worth a pound of cure. Then it?s on to the next trade.
In the meantime, take your winnings and plan your winter Caribbean holiday with your significant other. Or plan a ski vacation at Incline Village in Nevada. They?ve already had two nice dumps of snow. If you do, drop me a line and I?ll take you out for coffee at Starbucks.
https://www.madhedgefundtrader.com/wp-content/uploads/2013/11/Expiring-TA-Nov.-Opt..jpg772555Mad Hedge Fund Traderhttps://madhedgefundtrader.com/wp-content/uploads/2019/05/cropped-mad-hedge-logo-transparent-192x192_f9578834168ba24df3eb53916a12c882.pngMad Hedge Fund Trader2013-11-15 01:05:072013-11-15 01:05:07Watching the Cash Roll In
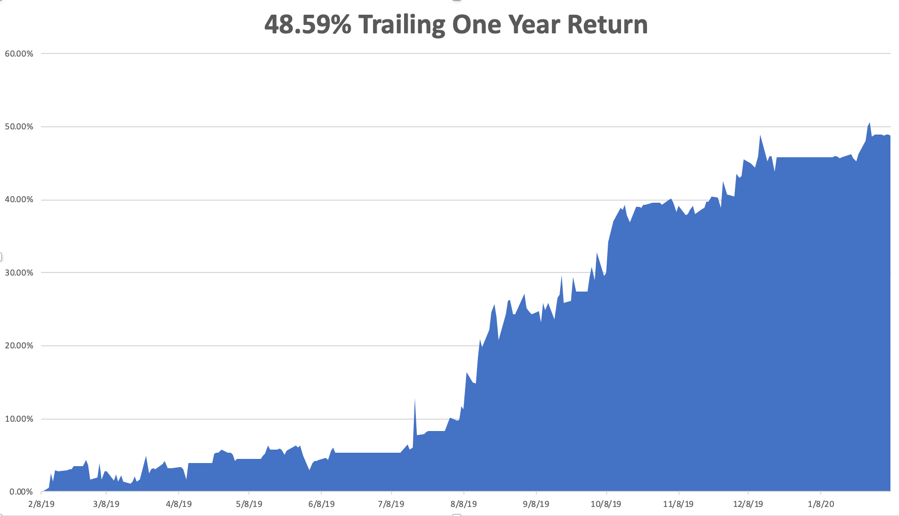
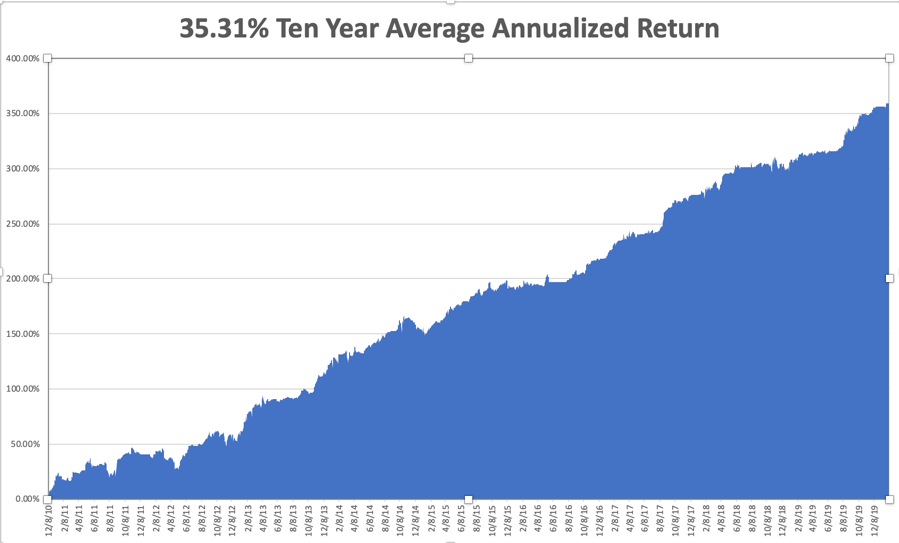
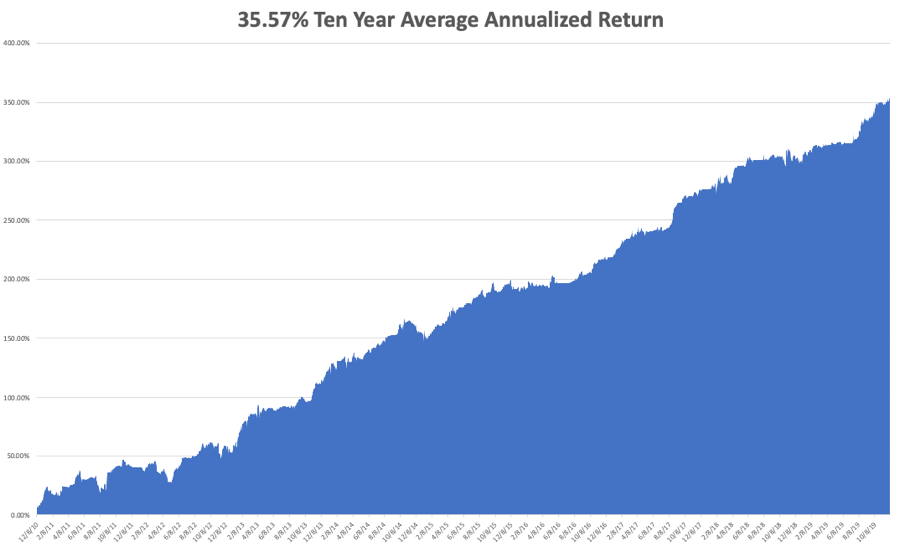
The Trade Alert service of the Mad Hedge Fund Trader has posted a new all time high in performance, taking in 46.05% so far in 2013. The three-year return is an eye popping 101.7%, taking the averaged annualized return to 35%. That compares to a far more modest increase for the Dow Average during the same period of 19%.
This has been the profit since the groundbreaking trade mentoring service was launched 35 months ago. These numbers place me at the absolute apex of all hedge fund managers, where the year to date gains have been a far more pedestrian 3%.
These numbers come off the back of a blistering week in the market where I added 5% in value to my model-trading portfolio. I called the top in the bond market on Monday, shorted the Treasury bond ETF (TLT), and bought the short Treasury ETF (TBT). Prices then collapsed, taking the ten-year Treasury bond yield from 2.47% to 2.63%.
I then pegged the top of the Euro (FXE) against the dollar, betting that the European Central Bank would have to cut interest rates to head off another recession. Since then, the beleaguered continental currency has plunged from $1.3700 to $1.3350 to the buck.
I then bet that the stock market would enter another tedious sideways correction going into the Thanksgiving holidays. I bought an in the money put spread on the S&P 500, and then bracketed the index through buying an in the money call spread.
Carving out the 2013 trades alone, 57 out of 71 have made money, a success rate of 80%. It is a track record that most big hedge funds would kill for.
This performance was only made possible by correctly calling the near term direction of stocks, bonds, foreign currencies, energy, precious metals and the agricultural products. It all sounds easy, until you try it.
My esteemed colleague, Mad Day Trader Jim Parker, has also been coining it. He caught a spike up in the volatility index (VIX) by both lapels. He also was a major player on the short side in bonds.
The coming winter promises to deliver a harvest of new trading opportunities. The big driver will be a global synchronized recovery that promises to drive markets into the stratosphere in 2014. The Trade Alerts should be coming hot and heavy.
Global Trading Dispatch, my highly innovative and successful trade-mentoring program, earned a net return for readers of 40.17% in 2011 and 14.87% in 2012. The service includes my Trade Alert Service and my daily newsletter, the Diary of a Mad Hedge Fund Trader. You also get a real-time trading portfolio, an enormous trading idea database, and live biweekly strategy webinars, order?Global Trading Dispatch PRO?adds Jim Parker?s?Mad Day Trader?service.
To subscribe, please go to my website at www.madhedgefundtrader.com, find the ?Global Trading Dispatch? or "Mad Hedge Fund Trader PRO" box on the right, and click on the blue ?SUBSCRIBE NOW? button.
https://www.madhedgefundtrader.com/wp-content/uploads/2013/11/TA-Performance-YTD.jpg699490Mad Hedge Fund Traderhttps://madhedgefundtrader.com/wp-content/uploads/2019/05/cropped-mad-hedge-logo-transparent-192x192_f9578834168ba24df3eb53916a12c882.pngMad Hedge Fund Trader2013-11-08 10:10:562013-11-08 10:10:56Mad Hedge Fund Trader Blasts to new All Time High
Legal Disclaimer
There is a very high degree of risk involved in trading. Past results are not indicative of future returns. MadHedgeFundTrader.com and all individuals affiliated with this site assume no responsibilities for your trading and investment results. The indicators, strategies, columns, articles and all other features are for educational purposes only and should not be construed as investment advice. Information for futures trading observations are obtained from sources believed to be reliable, but we do not warrant its completeness or accuracy, or warrant any results from the use of the information. Your use of the trading observations is entirely at your own risk and it is your sole responsibility to evaluate the accuracy, completeness and usefulness of the information. You must assess the risk of any trade with your broker and make your own independent decisions regarding any securities mentioned herein. Affiliates of MadHedgeFundTrader.com may have a position or effect transactions in the securities described herein (or options thereon) and/or otherwise employ trading strategies that may be consistent or inconsistent with the provided strategies.
We may request cookies to be set on your device. We use cookies to let us know when you visit our websites, how you interact with us, to enrich your user experience, and to customize your relationship with our website.
Click on the different category headings to find out more. You can also change some of your preferences. Note that blocking some types of cookies may impact your experience on our websites and the services we are able to offer.
Essential Website Cookies
These cookies are strictly necessary to provide you with services available through our website and to use some of its features.
Because these cookies are strictly necessary to deliver the website, refuseing them will have impact how our site functions. You always can block or delete cookies by changing your browser settings and force blocking all cookies on this website. But this will always prompt you to accept/refuse cookies when revisiting our site.
We fully respect if you want to refuse cookies but to avoid asking you again and again kindly allow us to store a cookie for that. You are free to opt out any time or opt in for other cookies to get a better experience. If you refuse cookies we will remove all set cookies in our domain.
We provide you with a list of stored cookies on your computer in our domain so you can check what we stored. Due to security reasons we are not able to show or modify cookies from other domains. You can check these in your browser security settings.
Google Analytics Cookies
These cookies collect information that is used either in aggregate form to help us understand how our website is being used or how effective our marketing campaigns are, or to help us customize our website and application for you in order to enhance your experience.
If you do not want that we track your visist to our site you can disable tracking in your browser here:
Other external services
We also use different external services like Google Webfonts, Google Maps, and external Video providers. Since these providers may collect personal data like your IP address we allow you to block them here. Please be aware that this might heavily reduce the functionality and appearance of our site. Changes will take effect once you reload the page.