Long term subscribers are well aware that I sent out a flurry of Trade Alerts at the beginning of the year, almost all of which turned out to be profitable.
Unfortunately, if you came in any time after January 17 you watched us merrily take profits on position after position, whetting your appetite for more.
However, there was nary a new Trade Alert to be had, nothing, nada, and even bupkiss. This has been particularly true with particular in technology stocks.
There is a method to my madness.
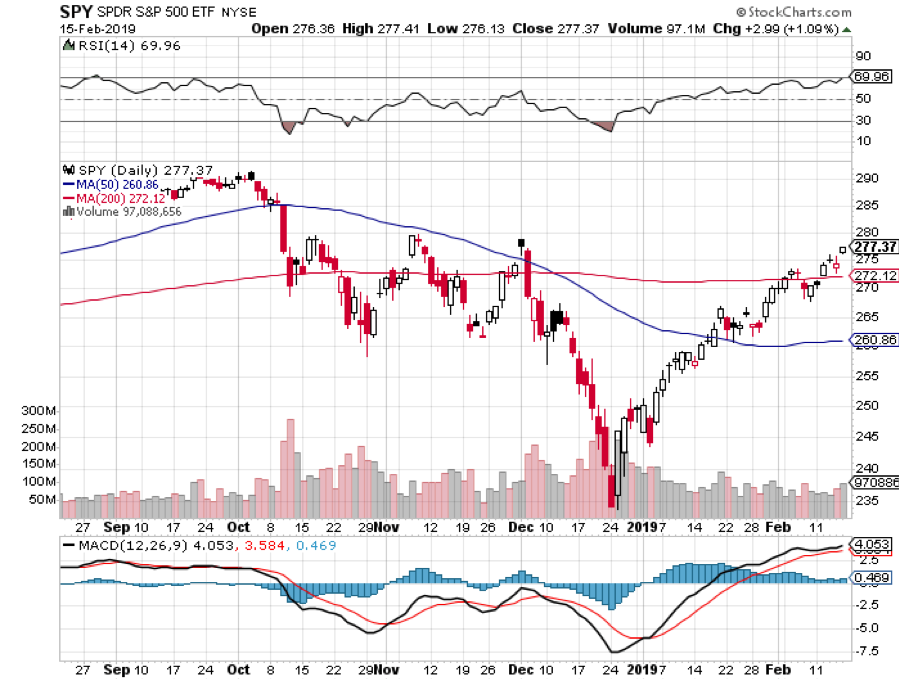
I was willing to bet big that the Christmas Eve massacre on December 24 was the final capitulation bottom of the whole Q4 move down, and might even comprise the grand finale for an entire bear market.
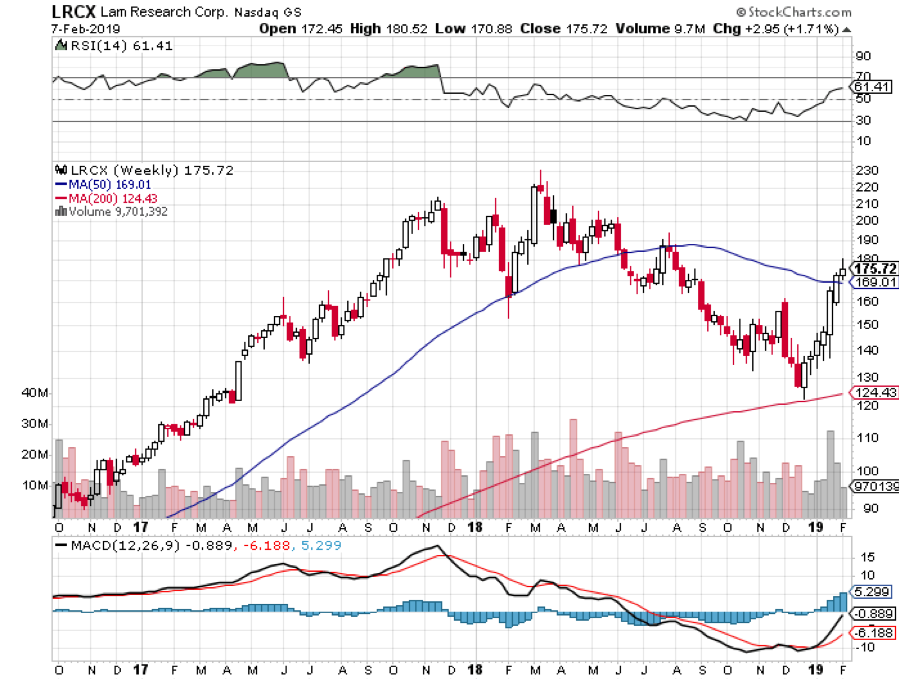
So when the calendar turned the page, I went super aggressive, piling into a 60% leverage long positions in technology stocks. My theory was that the stocks that had the biggest falls would lead the recovery with the largest rises. That is exactly how things turned out.
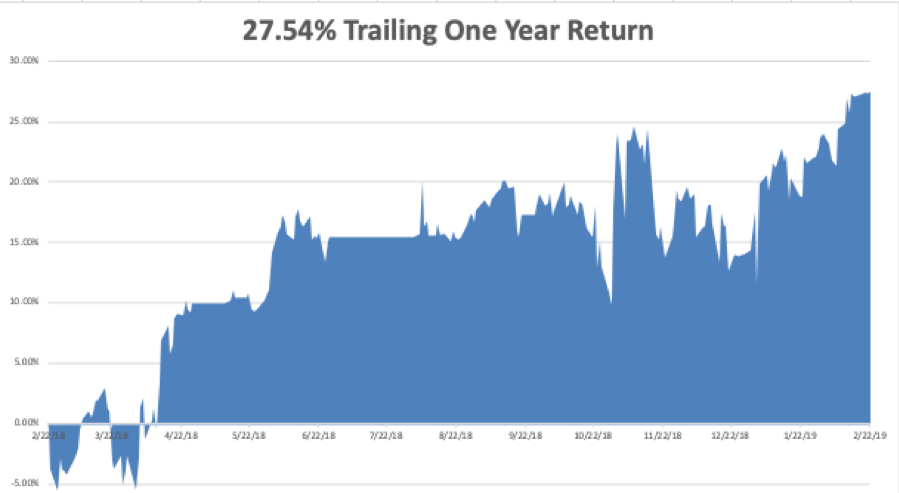
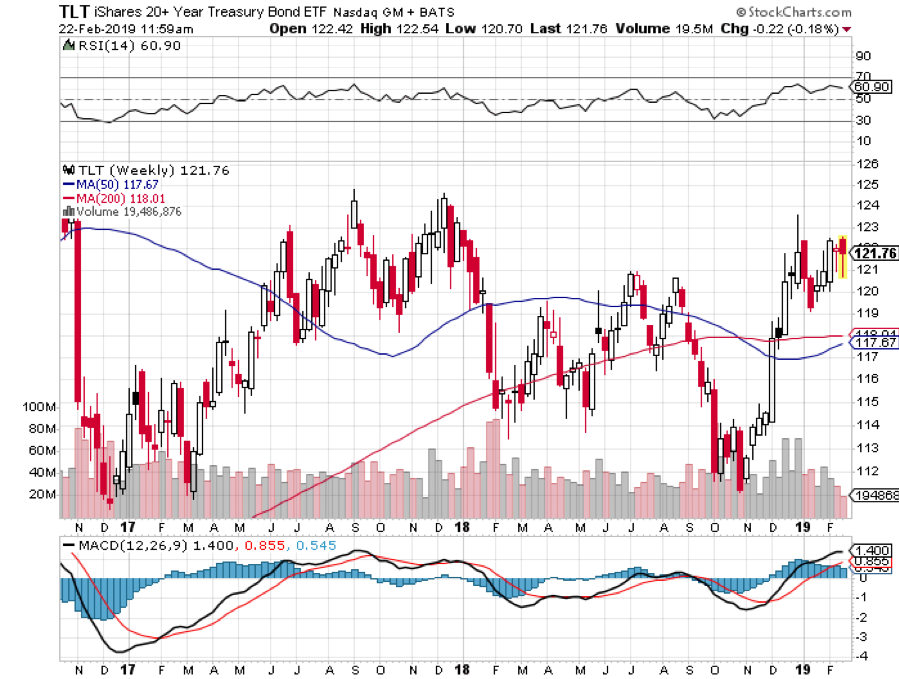
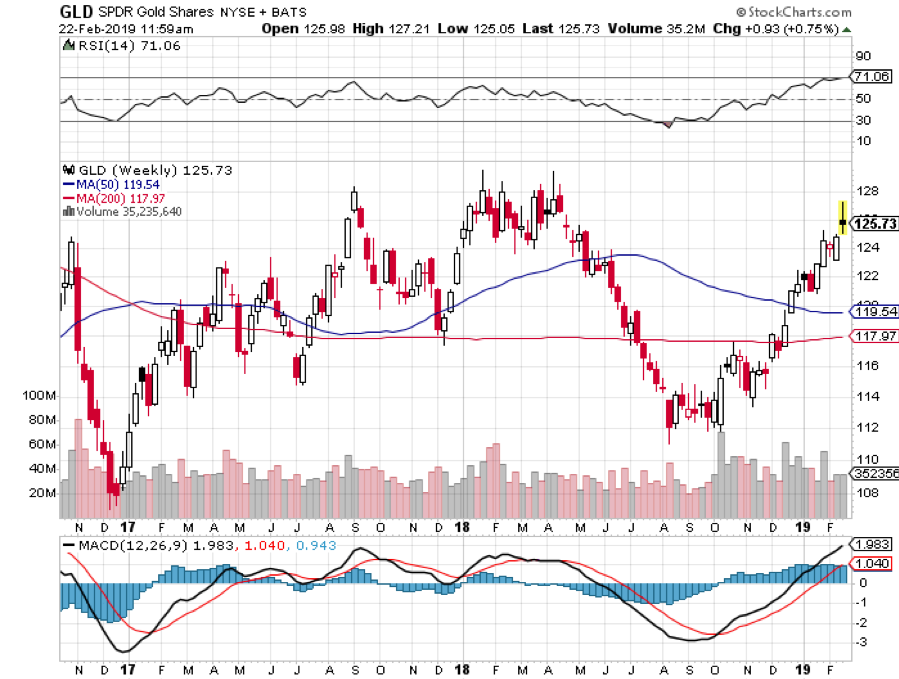
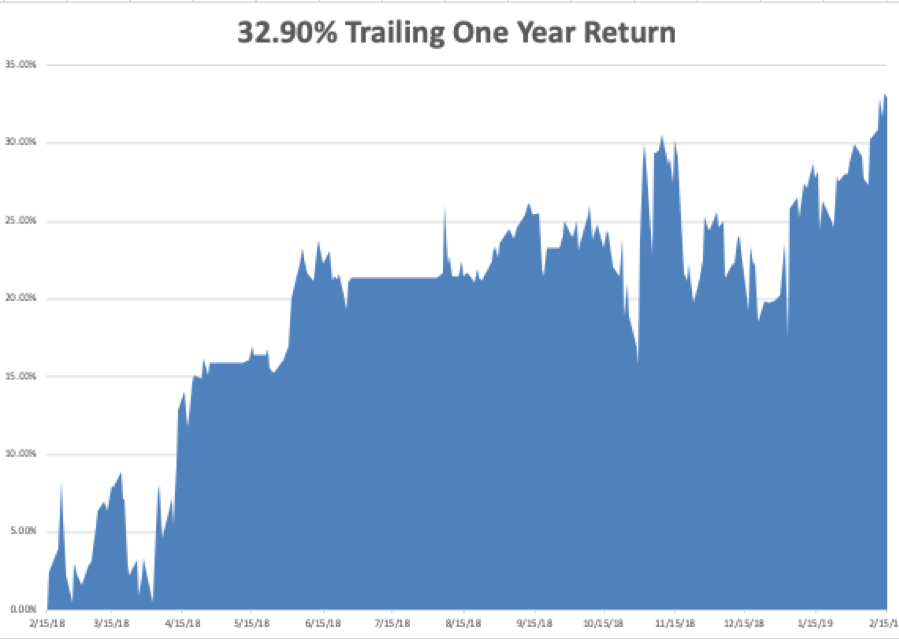
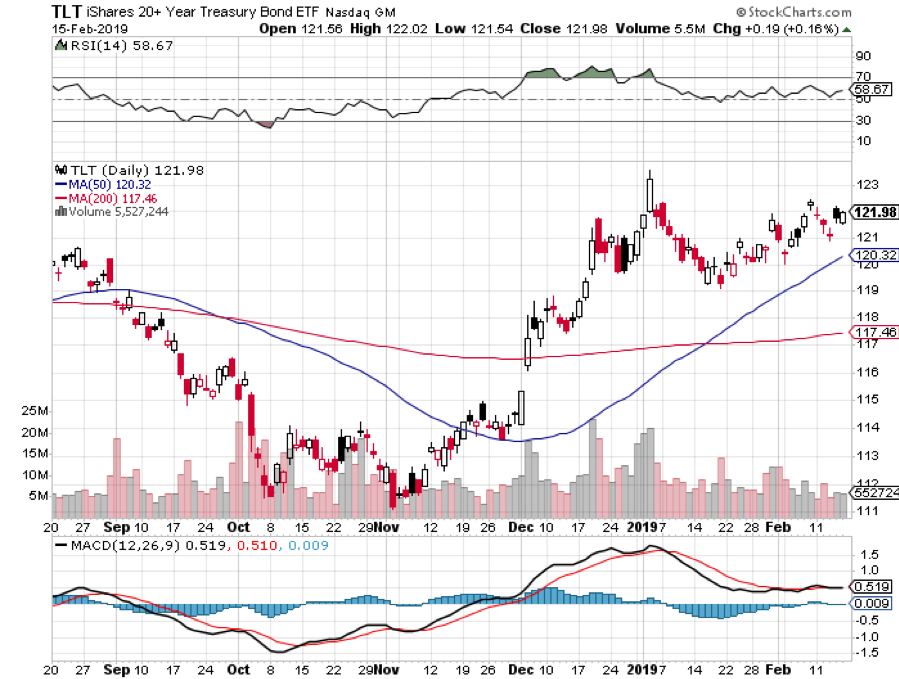
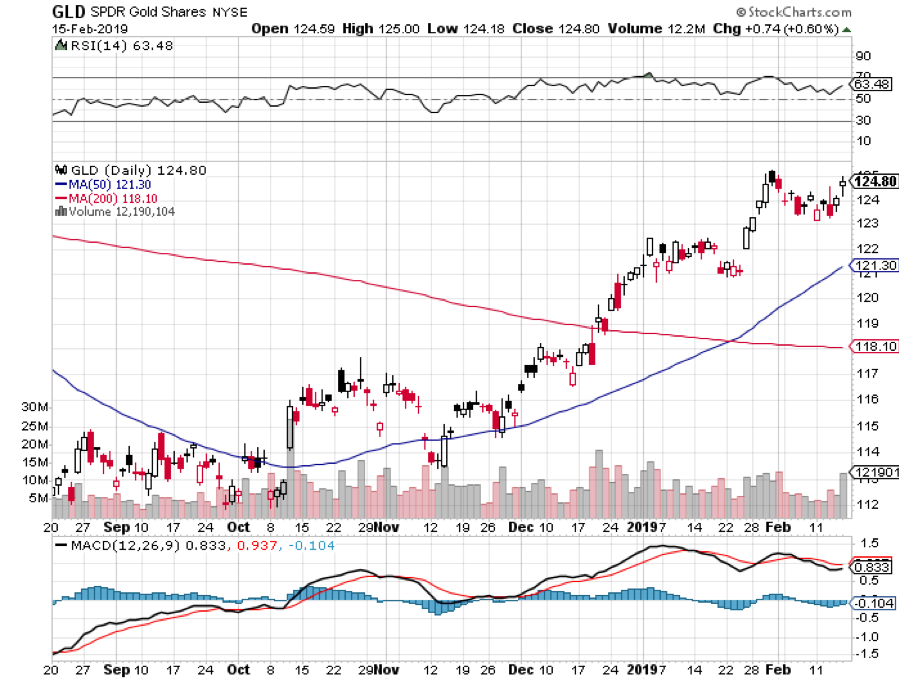
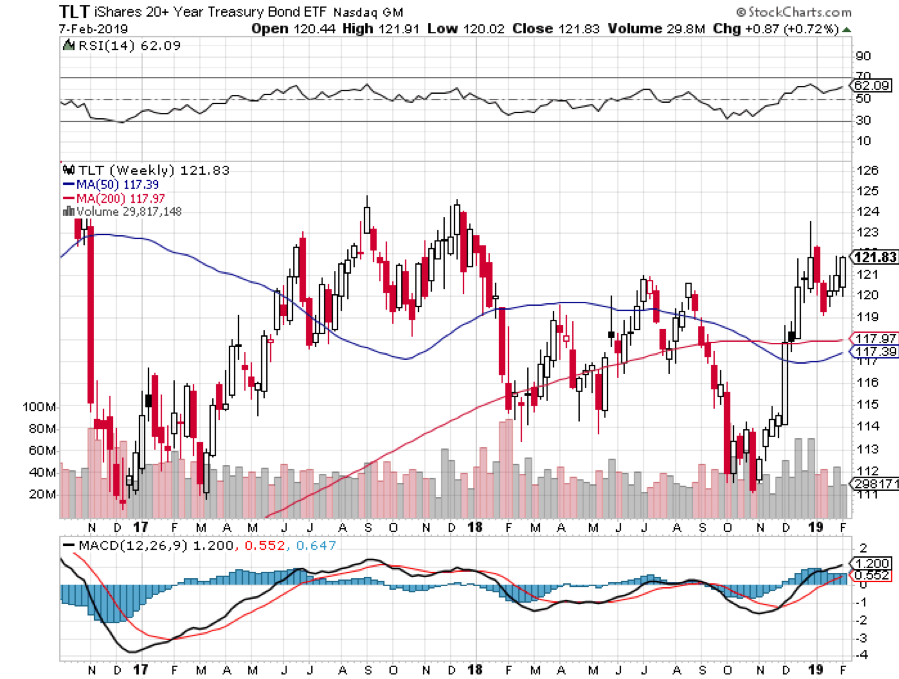
As the market rose, I steadily fed my long positions into it. As of today we are 80% cash and are up a ballistic 13.51% in 2019. My only remaining positions are a long in gold (GLD) and a short in US Treasury bonds (TLT), both of which are making money.
So, you’re asking yourself, “Where’s my freakin' Trade Alert?
To quote my late friend, Chinese premier Deng Xiaoping, “There is a time to fish, and there is time to mend the nets.” This is now time to mend the nets.
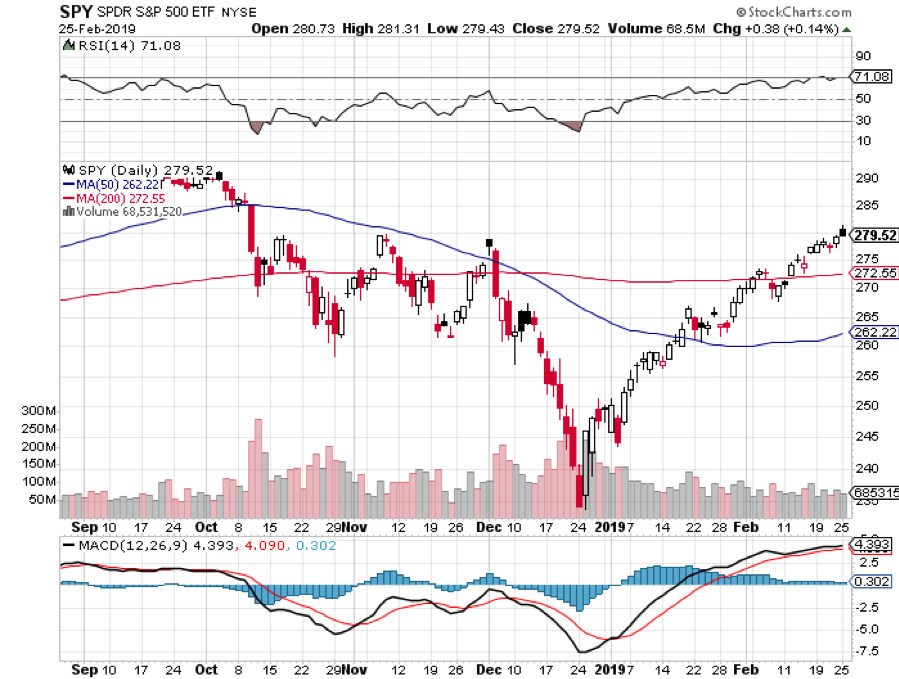
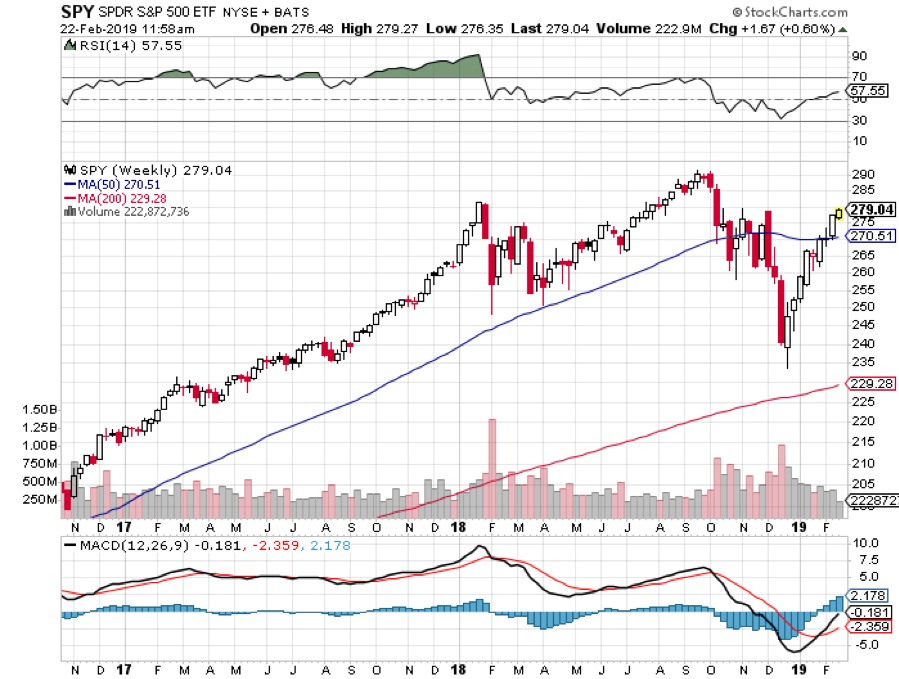
Stocks have just enjoyed one of their most prolific straight line moves in history, up some 20% in nine weeks. Indexes are now more overbought than at any time in history. We have gone from the best time on record to buy shares to the worst time in little more than two months.
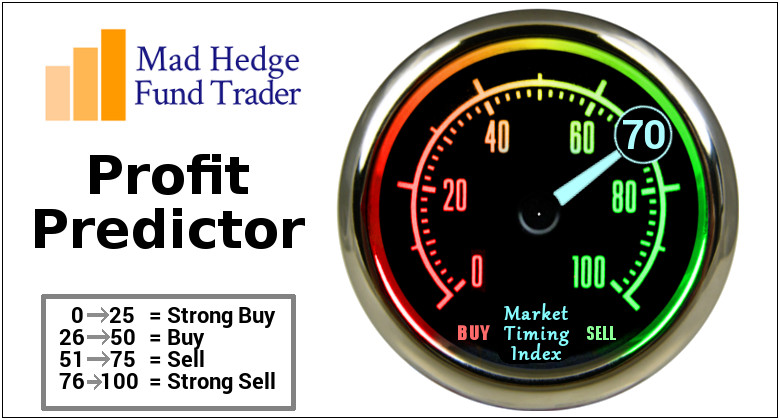
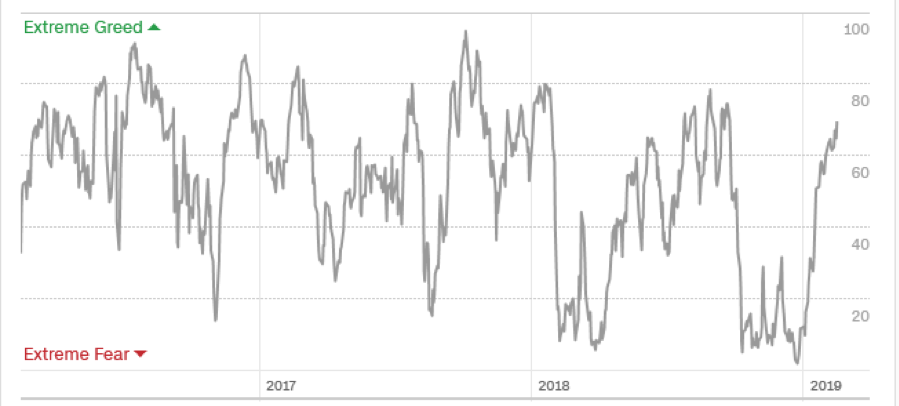
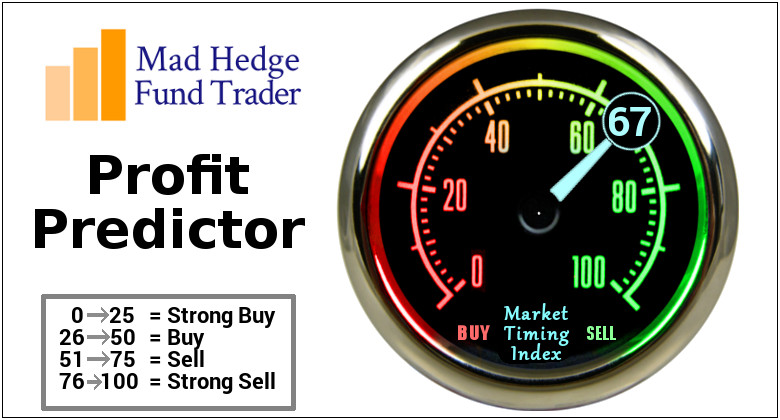
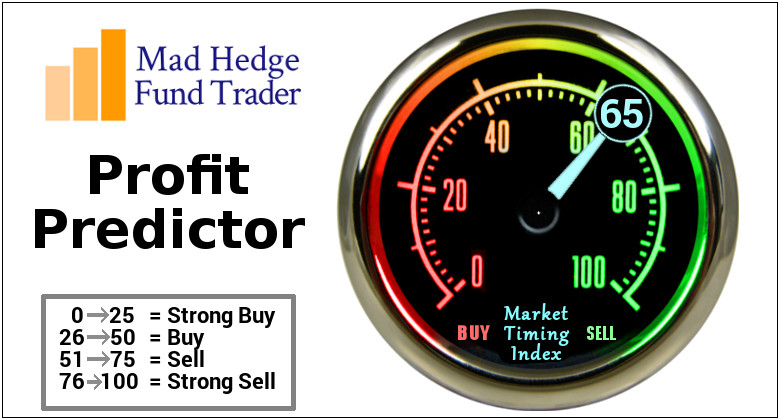
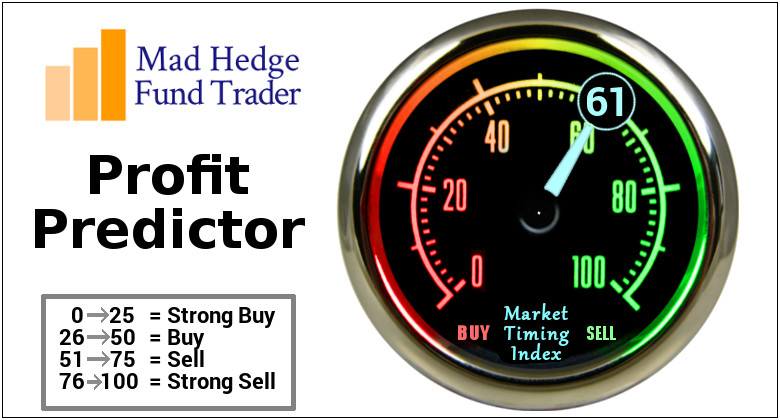
My own Mad Hedge Market Timing Index is now reading a nosebleed 74. Not to put too fine a point on it, but you would be out of your mind to buy stocks here. It would be trading malpractice and professional negligent to rush you into stocks at these high priced level.
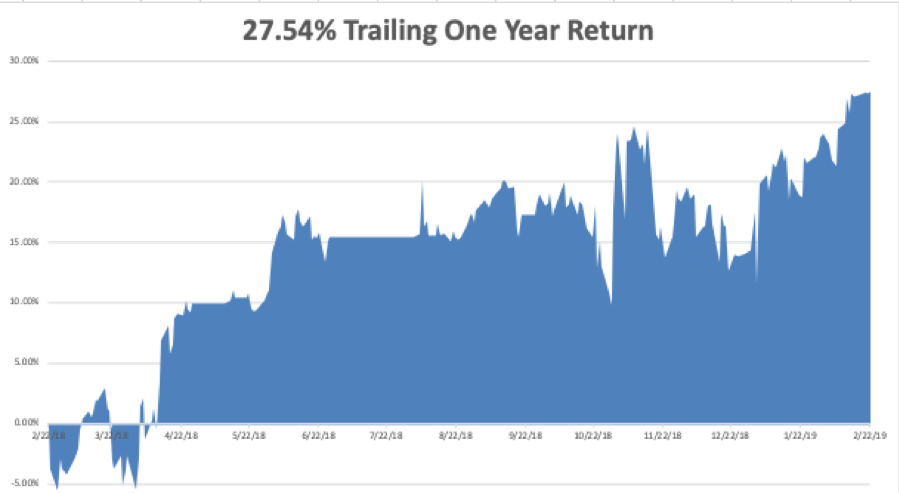
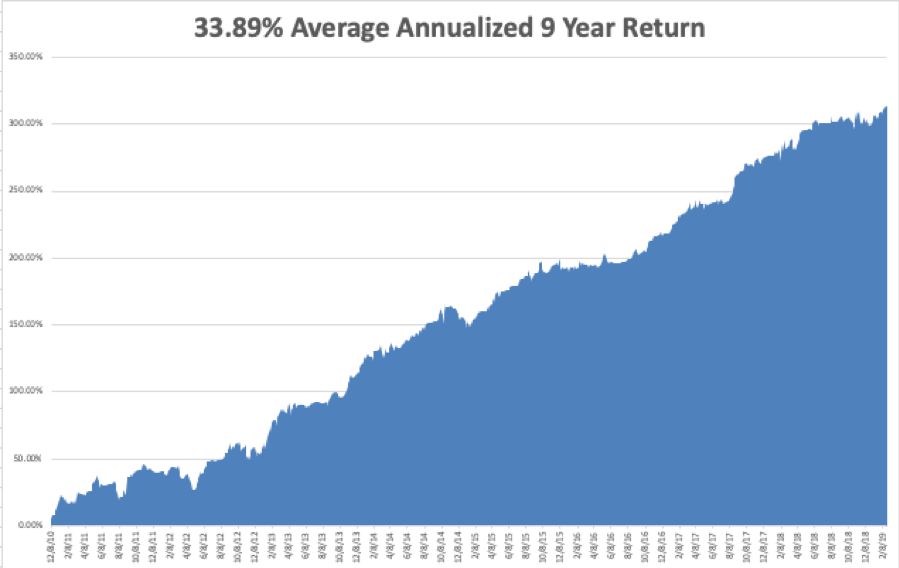
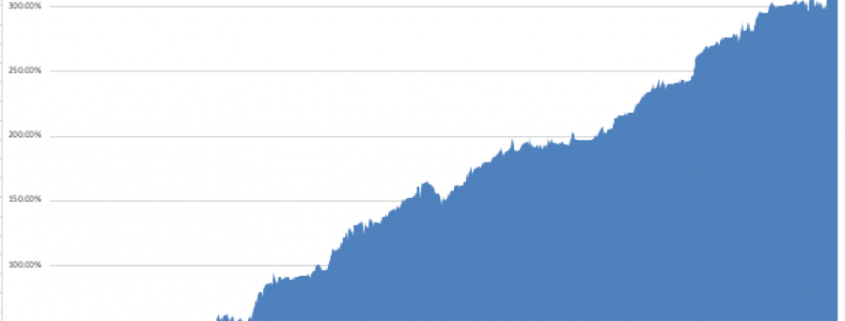
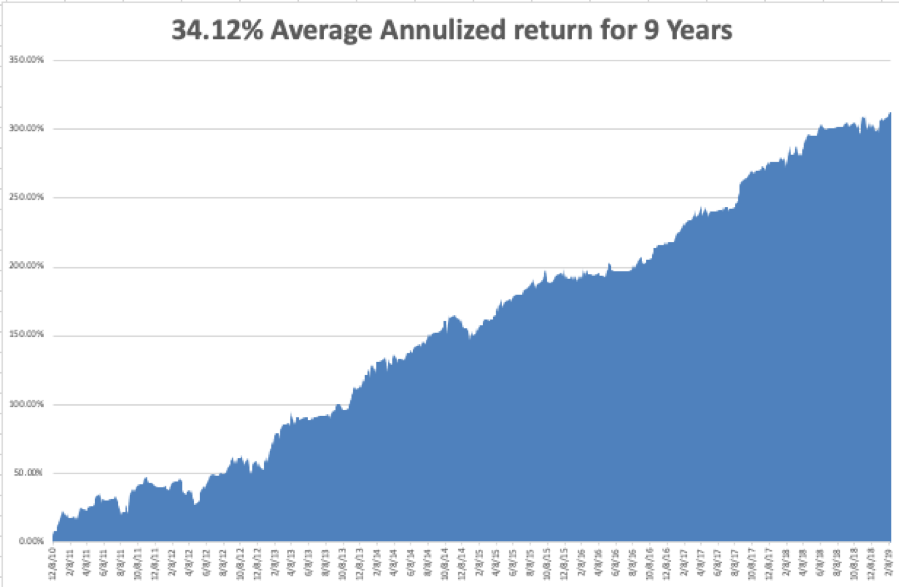
Yes, I know the competition is pounding you with trade alerts every day. If they work, it is by accident as these are entirely generated by young marketing people. Notice that none of them publish their performance, let alone on a daily basis like I do.
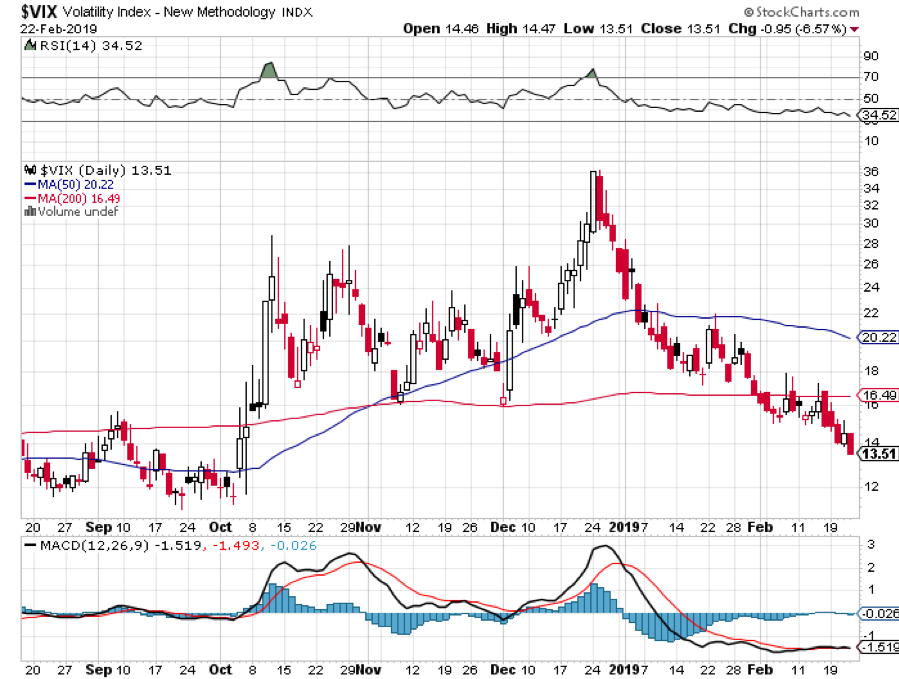
You can’t sell short either because the “I’s” have not yet been dotted nor the “T’s” crossed on the China trade deal. It is impossible to quantify greed in rising markets, nor to measure the limit of the insanity of buyers.
When I sold you this service I promised to show you the “sweet spots” for market entry points. Sweet spots don’t occur every day, and there are certainly none now. If you get a couple dozen a year, you are lucky.
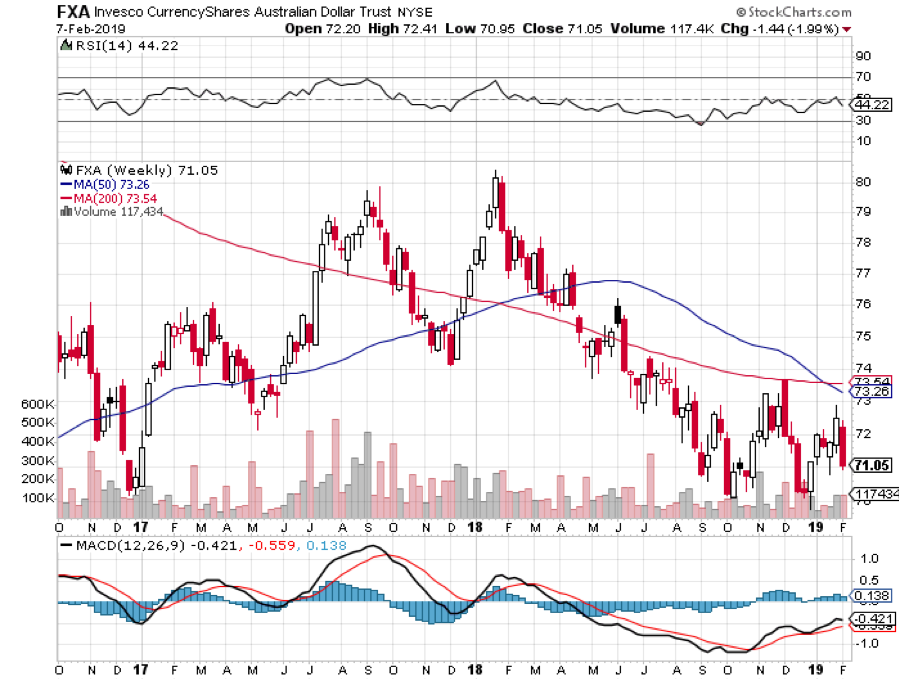
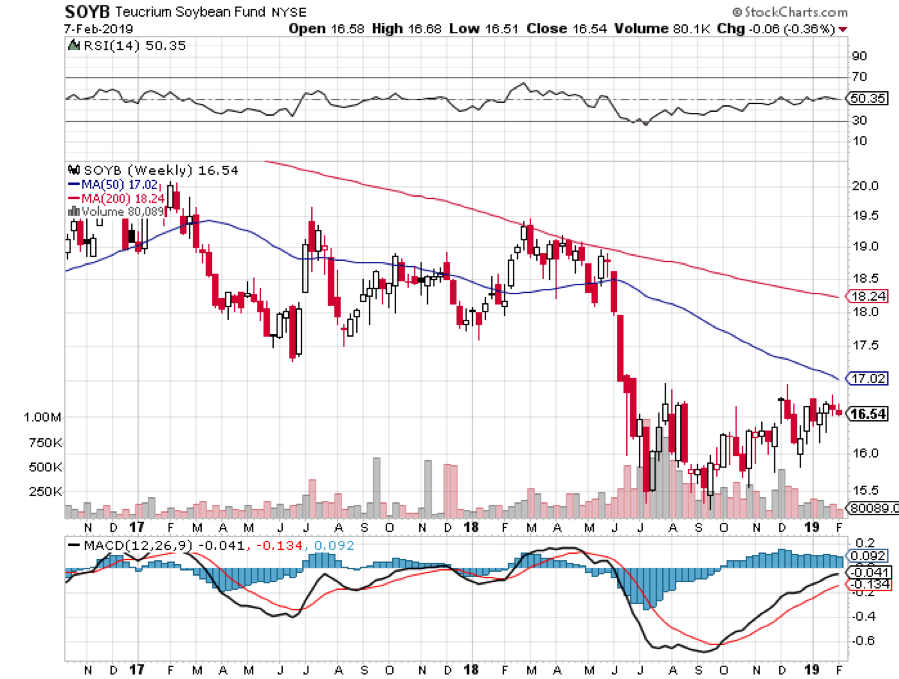
What do you buy at market highs? Cheap stuff. That would include all the weak dollar plays, including commodities, oil, gold, silver, copper, platinum, emerging markets, and yes, China, all of which are just coming out of seven-year BEAR markets.
After all, you have to trade the market you have in front of you, not the one you wish you had.
So, now is the time to engage in deep research on countries, sectors, and individual names so when a sweet spot doesn’t arrive, you can jump in with confidence and size. In other words, mend your net.
Sweet spots come and sweet spots go. Suffice it to say that there are plenty ahead of us. But if you lose all your money first chasing margin trades, you won’t be able to participate.
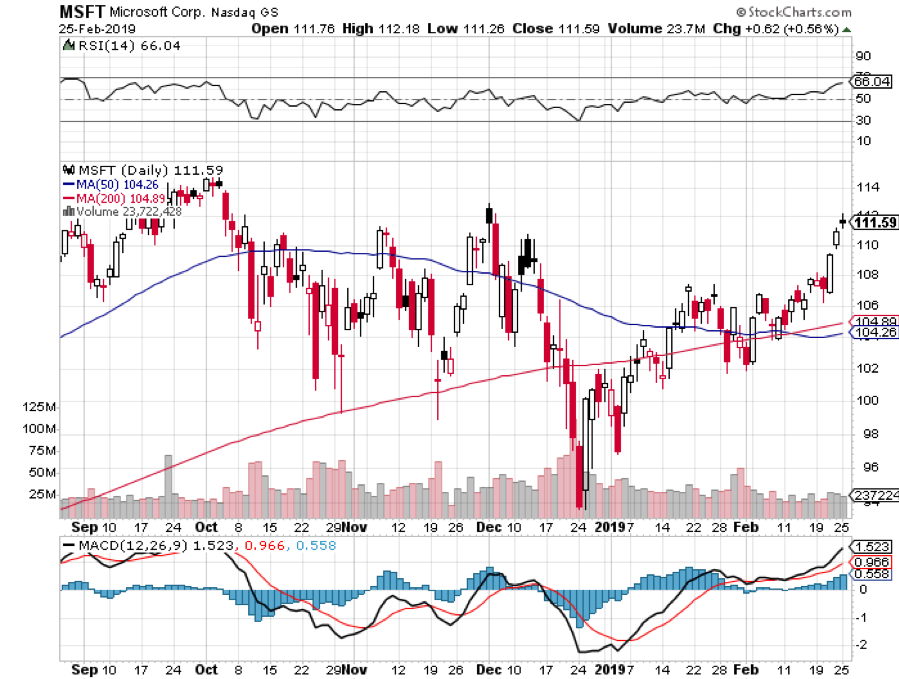
By the way, if you did buy my service recently, you received an immediate Trade Alert to by Microsoft (MSFT). Let’s see how those did.
In December, you received a Trade Alert to buy the Microsoft (MSFT) January 2019 $90-$95 in-the-money vertical BULL CALL spread at $4.40 or best.
That expired at a maximum profit point of $1,380. If you bought the stock it rose by 10%.
In January, you received a Trade Alert to buy the Microsoft (MSFT) February 2019 $85-$90 in-the-money vertical BULL CALL spread at $4.00 or best.
That expired last week at a maximum profit point of $1,380. If you bought the stock it rose by 12%.
So, as promised, you made enough on your first Trade Alert to cover the entire cost of your one-year subscription ON THE FIRST TRADE!
The most important thing you can do now is to maintain discipline. Preventing people from doing the wrong thing is often more valuable than encouraging them to do the right thing.
That is what I am attempting to accomplish today with this letter.


