Global Market Comments
June 10, 2021
Fiat Lux
Featured Trade:
(A NOTE ON OPTIONS CALLED AWAY),
(MSFT), (TLT), (BA), (GOOGL), (SPY)
Global Market Comments
June 10, 2021
Fiat Lux
Featured Trade:
(A NOTE ON OPTIONS CALLED AWAY),
(MSFT), (TLT), (BA), (GOOGL), (SPY)
Global Market Comments
May 28, 2021
Fiat Lux
Featured Trade:
(MAY 26 BIWEEKLY STRATEGY WEBINAR Q&A),
(SPY), (DIS), (AMZN), (FCX), (X), (PLTR), (FXE), (FXA), (TLT), (TBT), (AMC), (GME), (ZM), (DAL), (AXP), (LEN), (TOL), (KBH), (DOCO), (ZM), (TSLA), (NVDA), (ROM)
Below please find subscribers’ Q&A for the May 26 Mad Hedge Fund Trader Global Strategy Webinar broadcast from Lake Tahoe, NV.
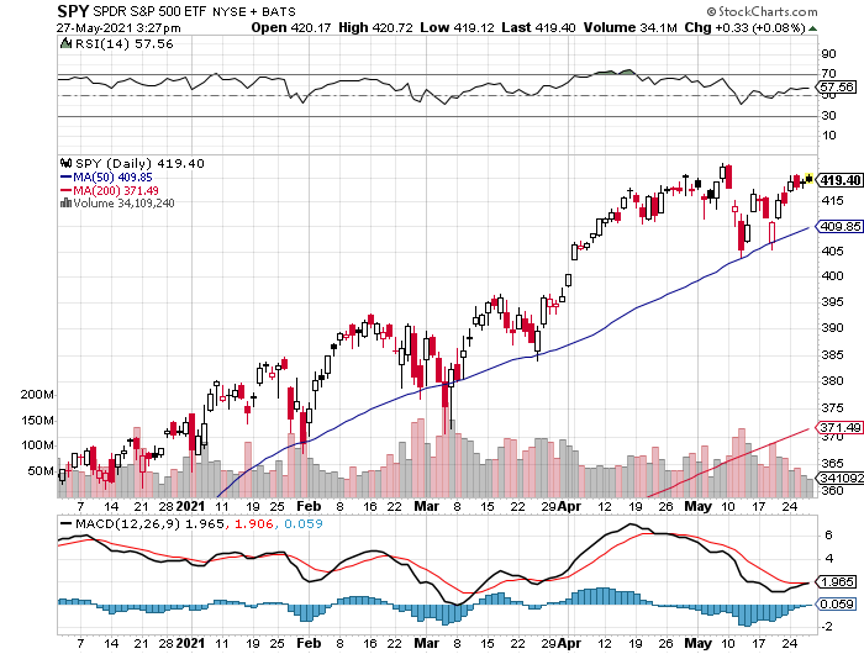
Q: Do you expect a longer pullback for the (SPY) through the summer and into the last quarter?
A: No, this market is chomping at the bit and go up and won’t do any more than a 5% correction. We’ve already tested this pullback twice. We could stay in this 5% range for a few more weeks or months, but no longer. If we make it to August before we take off to the upside, that would be a miracle. It seems to want to break out right now and if you look at the tech stocks charts you can see what I'm talking about.
Q: Why do day orders with spreads not good ‘til canceled (GTC)?
A: Actually, you can do good ‘til canceled on these spreads, it just depends on how your platform is set up. Good ‘til canceled won't hurt you—only if we get a sudden reversal on a stop out which has only happened four times this year.
Q: Disney (DIS) seems to be struggling to get back over $180; am I still safe with my January 2023 $250 LEAPS?
A: Yes, out to 2023 we’ll have two summers until those expire, so those look pretty good—that's a pretty aggressive trade, and I’m betting you’re looking at a 500% profit on those LEAPS. And by the way, I always urge people to go out long on these LEAPS, because the second year is almost free when you check the pricing. So, take the gift and that will also greatly reduce your risk. We could have a whole recession and recovery, and still have those LEAPS make it to $250 in Disney.
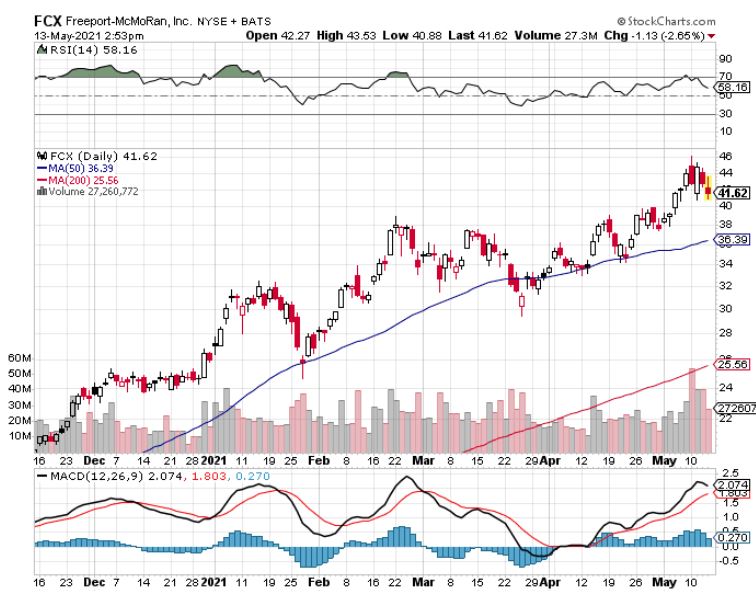
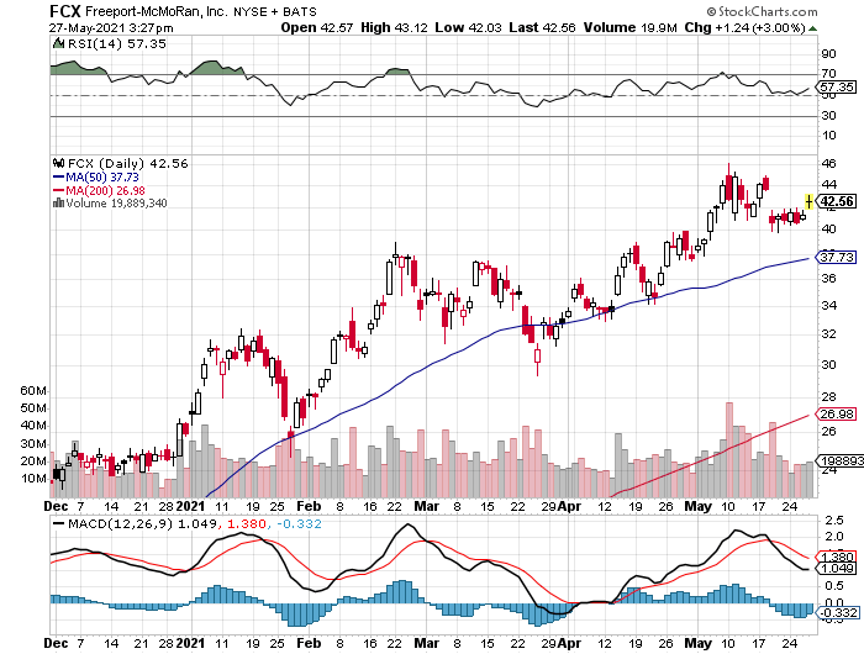
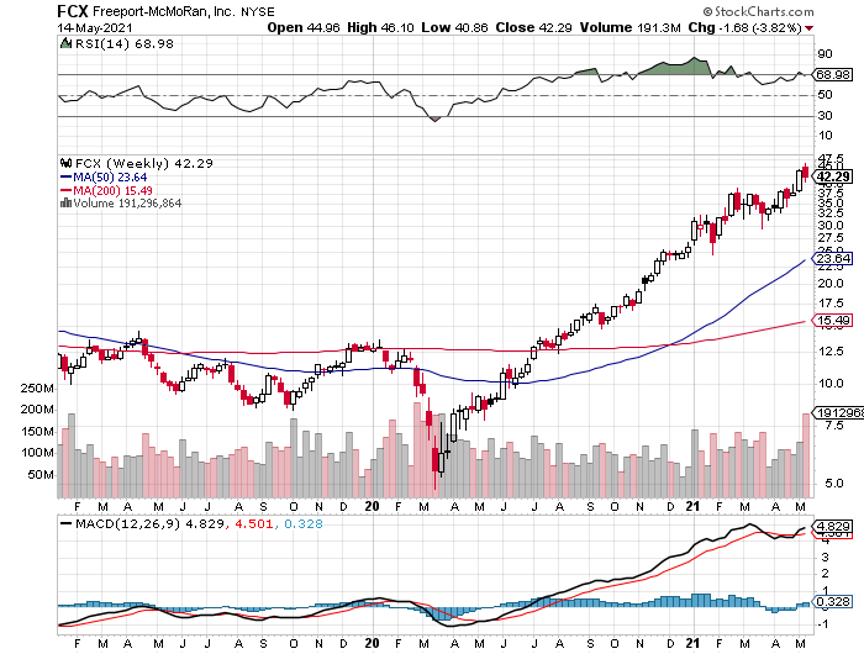
Q: Should I add to Freeport McMoRan (FCX)?
A: (FCX) I would not add—in fact, I would have a stop loss if we closed below $40 on (FCX) if you’re a short-term trader. There is a slowdown in the Chinese economy going on as well as a clampdown on commodity speculation. This has affected the whole base metal space, including steel and palladium. If you have the long-term LEAPS, keep them, because I think (FCX) doubles from here. The whole “green revolution story” is still good.
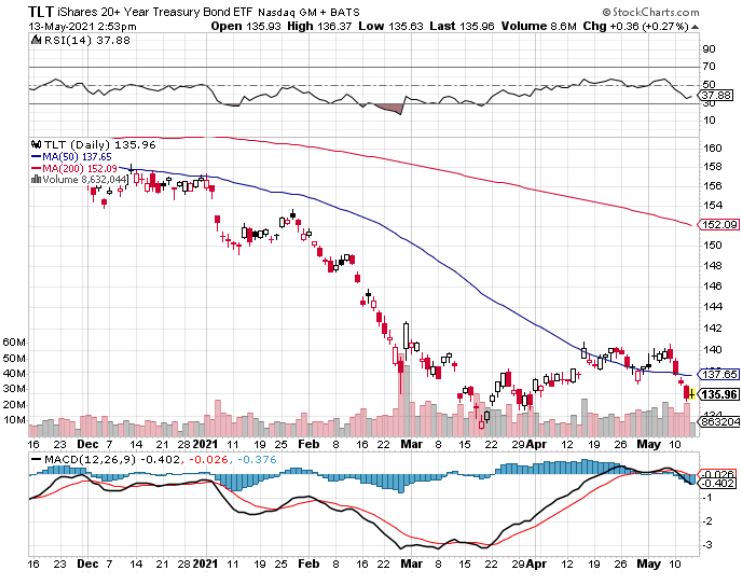
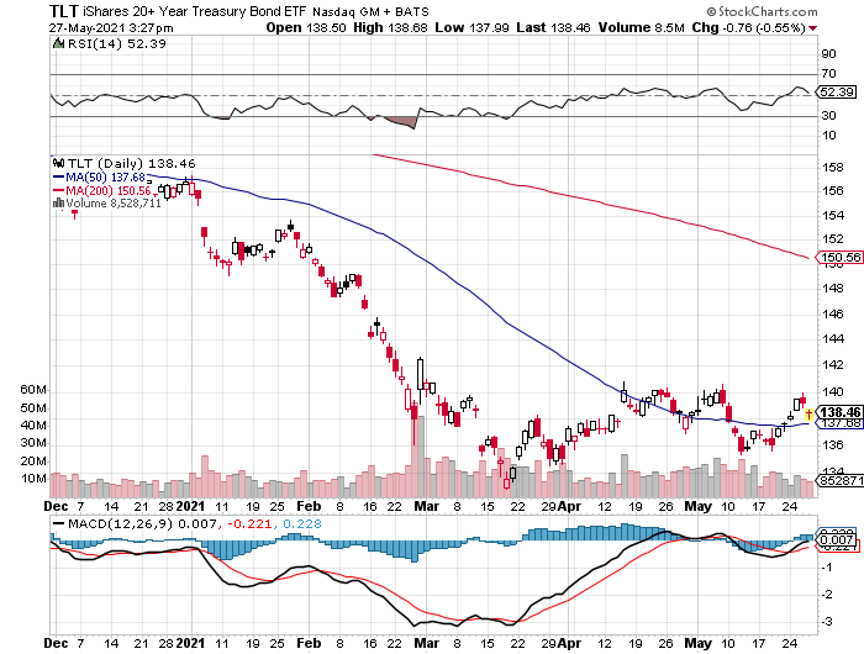
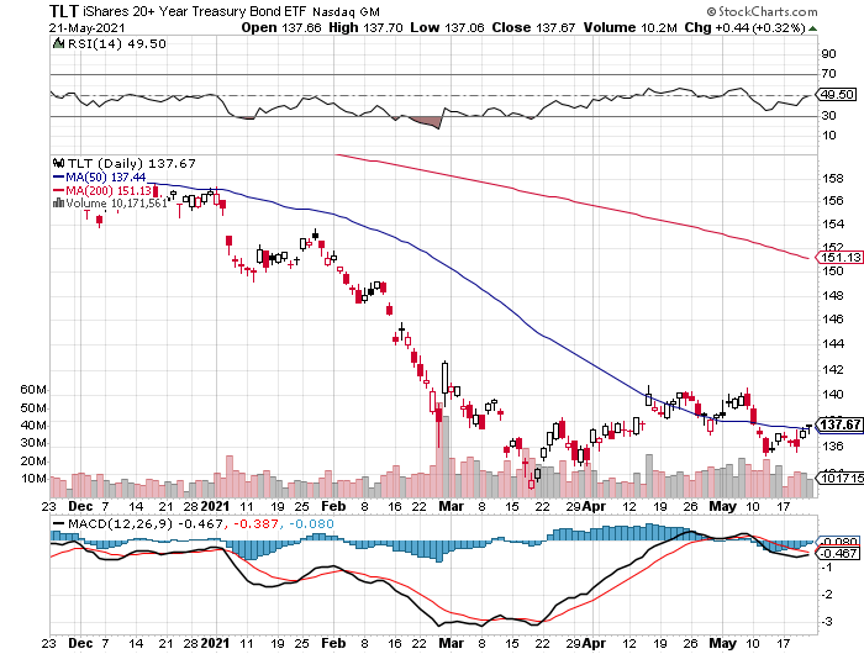
Q: Do you think the United States Treasury Bond Fund (TLT) is going up?
A: No, I think the (TLT) has been going down. I've been buying puts spreads like crazy, and I have a huge chunk of my own retirement fund in long-dated (TLT) LEAPS, so I am praying it will go down. We’ll talk about that when we get to the bond section.
Q: Prospects for U.S. Steel (X)?
A: It’s tied in with the whole rest of the base commodity complex—I think it is due for a rest after a terrific run, which is why I have such tight stop losses on Freeport McMoRan (FCX).
Q: Do you buy the “transitory” explanation for the hot inflation read two weeks ago that the Fed is handing out, or do you think inflation is bad and here to stay?
A: I go with the transitory argument because you’re getting a lot of one-time-only price rises off of the bottom a year ago when the economy completely shut down. Once those price rises work through the system, the inflation rate should go from 4.2% back down to 2% or so. So, I don't see inflation as a risk, which is why I think the stock markets can reach my 30% up target this year. You may get another hot month as the year-on-year comparisons are enormous. But betting on inflation is betting on the reversal of a 40-year trend, which usually doesn’t work out so well.
Q: On your spread trade alerts can we buy less than 25 contracts?
A: You can buy one contract. In fact, I recommend people start with one contract and test out where the real market is. Put a bid for one contract in the middle of the market, and if it doesn’t get done, raise your bid 5 cents, and eventually, your order gets done. Then you can add more if you want to. I always recommend this even for people who buy thousands of contracts, that they test the market with one contract order just to make sure the market is actually there.
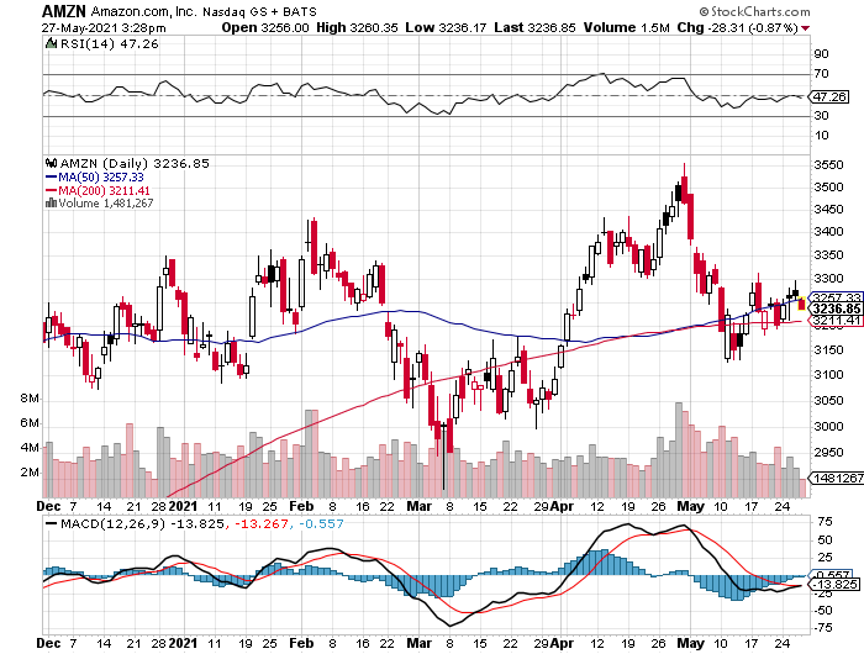
Q: Can you recommend a LEAPS for Amazon (AMZN)?
A: The Amazon LEAPS spread is the January 2022 $3150-3300 vertical call debit spread going out 8 months.
Q: When you short the (TLT), how do you do it?
A: I do vertical bear put debit spreads. I buy a near-money put and sell short and an out-of-the-money put so I can reduce the cost, and therefore triple my size. This strategy triples the leverage on the most likely part of the stock move to take place, which is the at the money. For example, a great one to buy here would be a January 2021 (TLT) $135/140 vertical bear put debit spread where you’re buying the $140 and selling short the $135. The potential 8-month profit on this is around 100%. You’ll make far more money on that kind of trade than you ever would just buying puts outright. Some 80% of the time the single option trades expire worthless. You don’t want to become one of those worthless people.
Q: What’s your best idea for avoiding a U.S. Dollar drop?
A: Buy the Invesco Currency Shares Euro Trust (FXE) or buy the Invesco Currency Shares Australian Dollar Trust Trust (FXA), the Australian Dollar to hedge some of your US Dollar risk. The Australian dollar is basically a call option on a global economic recovery.
Q: I’m a new subscriber, but I don’t get all the recommendations that you mention.
A: Please email customer support at support@madhedgefundtrader.com , tell them you’re not getting trade alerts, and she'll set you up. We have to get you into a different app in order for you to get all those alerts.
Q: How about the ProShares UltraShort 20 Year Treasury ETF (TBT)—is that a bet on declining (TLT)?
A: Absolutely yes, that is a great bet and we’re at a great entry point right now on the (TBT) so that is something I would start scaling into today.
Q: Do you still like Palantir (PLTR)?
A: Yes, but the reason I haven't been pushing it is because the CEO says he could care less about the stock market, and when the CEO says that it tends to be a drag on the stock. Palantir has an easy double or triple on it on a three-year view though. However, small tech has been out of favor since February as it is overpriced.
Q: How far down can the (TLT) go in the next 30 days?
A: It could go down to $135 and maybe $132 on an extreme move, especially if we get another hot CPI read on June 10. However, if you hear the word “taper” from a Fed official, then you’re looking at high $120’s in days.
Q: With the TLT going up, why have you not sent out an alert to double up on put spreads?
A: I tend to be a bit of a perfectionist since I’m a scientist and an engineer, so I’m hanging on for an absolute top to prove itself and start on the way down. On the shorts, I like selling them on the way down, and buying my longs on the way up, because there are always surprises, there’s always the unknown, and heaven forbid, I might actually be wrong sometimes! So, I’m still waiting on this one. And we do already have one position that is fairly close to the money now, the June 2021 $141-144 vertical bear put debit spread, so I don't want to double up on that until we have a reversal in the intermediate term trend.
Q: I see GameStop (GME) is spiking again now up to $230—should I get in for a short-term profit?
A: No. With these meme stocks, the trading is totally random. If anything, I would be selling short, but I would do it in a limited risk way by buying a put spread. However, the implied volatility in the options on these meme stocks are so high that it's almost impossible to make any money on options; you’re paying enormous amounts of money up front, so that's my opinion on GameStop and on AMC Entertainment Holdings (AMC), the other big meme stock.
Q: Will business travel come back after the world is vaccinated?
A: Absolutely. Companies don't want to send people on the road, but customers will demand it. All you need is one competitor to land an order because they visited the customer instead of doing a Zoom (ZM) meeting, and all of a sudden business travel will come roaring back. So that's why I was dabbling in Delta Airlines (DAL) and that's why I like American Express (AXP), where 8% of transactions are for first class airline tickets.
Q: As the work-from-home economy stops and workers go back to the office, do you see a 10% correction in the housing market?
A: Actually, in the housing market with real houses, I don't see prices dropping for years, because 30% of the people who went home to work are staying there for good—that the trend out of the cities into the hinterlands is a long-term trend that will continue for decades, now that Zoom has freed us of the obligations to commute and be near big cities. And of course, I’m a classic example of that; I've been working either in my basement in San Francisco or at Lake Tahoe for the last 14 years. Housing stocks on the other hand like Lennar (LEN), Toll Brothers (TOL) and KB Home (KBH) have had a tremendous run and are basically out of homes. Could they have a 10% correction at any time? Absolutely, yes.
Q: Should I avoid buying dips in last year's work-from-home stocks?
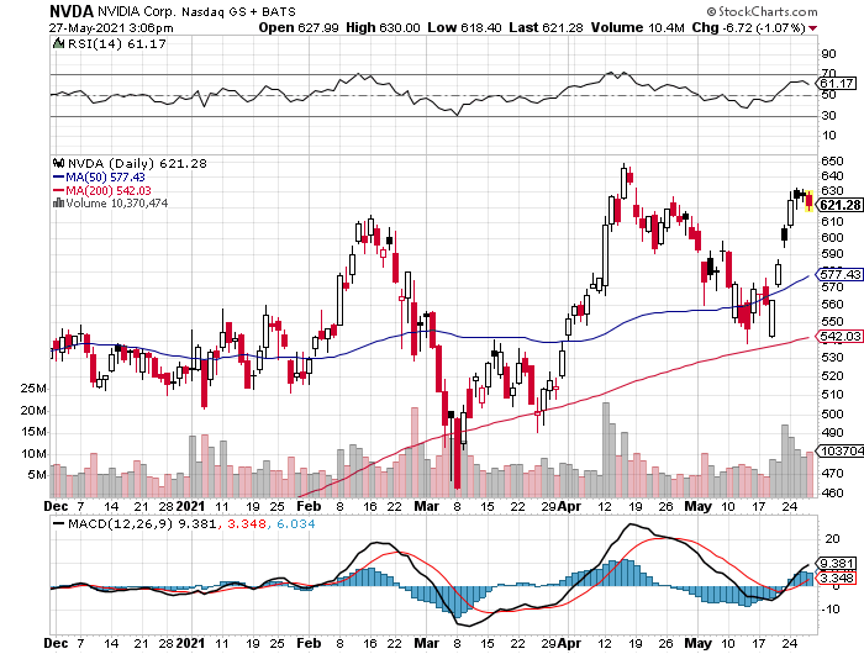
A: Yes I would. DocuSign (DOCO) and Zoom (ZM) are the two best ones because they were both up 12X from their lows, and I tend not to chase things that are up 12X unless they are a Tesla (TSLA) or an Nvidia (NVDA) or something like that. In the end, Tesla went up 295 times.
Q: Are you looking at the carbon credits market?
A: No, but I probably should. That market shut down last year. It’s alive again, and it looks like it's growing like crazy.
Q: What’s the ideal volatility for individual options? What do you use to compare?
A: Always look at the implied volatility of the option compared to the realized volatility of the underlying stock; and when the difference gets too big, you get ideal conditions for putting on call and put spreads, which take advantage of this. These are almost volatility neutral because you’re long on one batch of volatility and short on the other.
Q: Is it too late to get involved in the ProShares Ultra Technology ETF (ROM), the 2X long ETF in a spread?
A: The November 2021 $121-125 vertical bull call spread, the farthest expiration you can get for the (ROM), was kind of aggressive—I would go closer to the money. We’re right around mid $80s right now, so maybe do a January 2022 $95-100, and even that will get you something like a 400% gain by November.
To watch a replay of this webinar with all the charts, bells, whistles, and classic rock music, just log in to go to MY ACCOUNT, click on GLOBAL TRADING DISPATCH (or Tech Letter as the case may be), then WEBINARS, and all the webinars from the last ten years are there in all their glory.
Good Luck and Stay Healthy.
John Thomas
CEO & Publisher
The Diary of a Mad Hedge Fund Trader
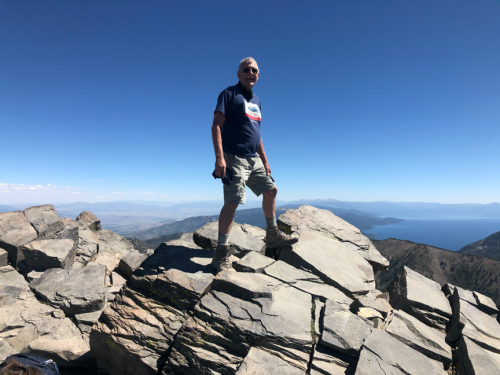
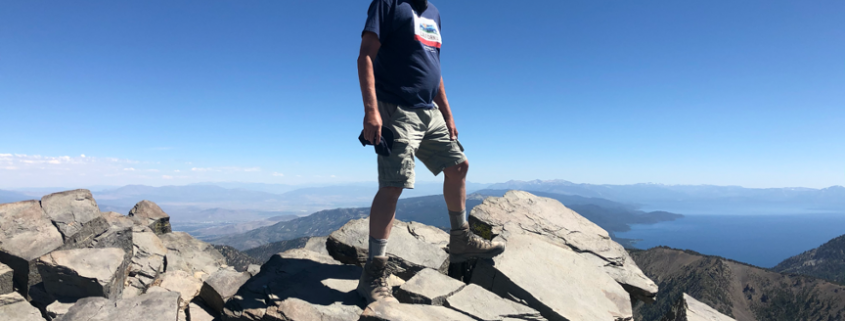
Summit of Mount Rose at 10,778 feet with Lake Tahoe on the Right
Global Market Comments
May 24, 2021
Fiat Lux
Featured Trade:
(MARKET OUTLOOK FOR THE WEEK AHEAD, or IT'S ALL ABOUT THE NUMBERS),
(TLT), (SPY), (FCX), (QQQ), (VIX), (UUP), (AMAT), (CRM), (GOOG), (AMZN), (AAPL), (FB)
I know that not all of you are mathematicians, nor blessed with math degrees from UCLA, as I am. However, the future of your retirement funds relies on a few simple numbers. So, I will try to be gentle.
S&P tech stocks are trading at a 27 price earnings multiple. The S&P 500 Index, as a whole, trades at a 21 multiple. S&P value stocks, financials, and old-line recovery stocks like industrials and materials are trading at a 17 multiple.
Historically, companies with double the earnings power of the index trade at a 5-point premium to the main market. As long as this disparity exists, tech stocks will go down and value with go up.
However, we are getting close to a reversal. Allowing for market noise, I don’t see tech dropping more than 10% from here over the coming months. Then we will see the mother of all Q4 rallies taking it to new highs.
That explains why investors have been nibbling on tech lately, especially the best ones like NVIDIA (NVDA), Applied Materials (AMAT), and Salesforce (CRM). You also want to pick up big cap money machines like Alphabet (GOOG), Amazon (AMZN), Apple (AAPL), and Facebook (FB). Their LEAPS are begging for attention.
That means the downside from here is limited. Sorry Cassandras, no crashes here.
I am more convinced of this outcome than ever, given the substantial number of crashes and disasters, markets have weathered this year. These are truly Teflon markets. Last week, Bitcoin collapsed an amazing 55% in six weeks, wiping $1 trillion off the value of that market.
The fear had been that a crypto crash of this size would ignite a system contagion that would take everything down. A few years ago, it would have. But with massive Fed liquidity and unprecedented deficit spending, all we got was down 600 points one day and 600 up the next.
No crash here.
We’ve also had smaller crashes in sectors that were the most egregiously overpriced in February, like SPACS, meme stocks, and shares trading at 100 times sales with no earnings. Again, no harm no foul. It was a comeuppance that was well earned.
The big tell that I am right came screaming loud and clear last week from the US dollar, which hit a new 2021 low. A cheaper greenback means cheaper US stocks for foreign investors, which means they buy more of them. A weak buck also means that interest rates will stay lower for longer, which is great news for stocks, especially tech.
So, take it easy for the next few months. Keep positions small and rejoin the human race.
It seems odd going out into civilization and seeing live people walking around without masks. All the batteries on my watches are dead, as they have not been used for nearly two years, so they are getting replaced. I walked into my closet, and it was like adventuring into an archeological dig, with dozens of Turnbull & Asser shirts untouched by human hands. I’ve been living in Marine Corps sweats since 2019.
Bitcoin Crashes, down 33% on the day at the lows to $30,000, and off a heart-palpitating 55% from the April high. You wanted volatility, you got volatility! The problem for the rest of us is whether this will cause a real systemic financial crisis, with the Dow already down 560 at today’s low. Was Elon Musk the shoeshine boy giving tips at the market top?
Chip Shortage causes $110 Billion in US Car Industry Sales, in 2021 and will take years to address. Supply chains will need to be rebuilt. My neighbor just had to wait 11 months to take delivery of his Ford F-150.
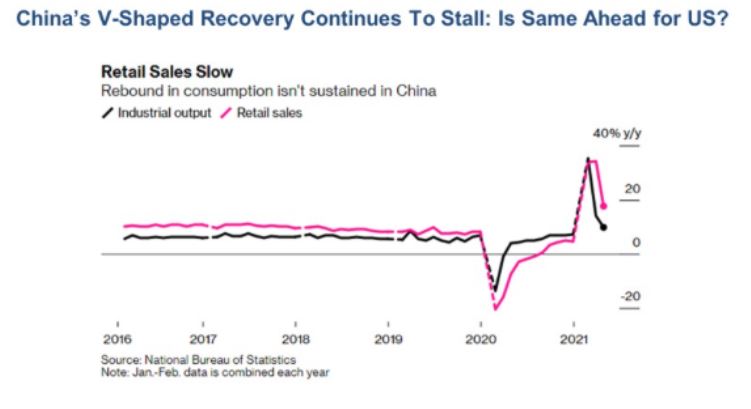
China’s Industrial Production Slows, from 14.1% in March to only 9.8% in April. That gives us a hint to our own future, as the Middle Kingdom emerged from the pandemic a year before we did. Retail sales also disappointed. After rocketing in 2020, the Chinese economy started slowing at the beginning of this year. The dead cat bounce in the economy is over. If this continues, it's bad news for copper prices of which the Middle Kingdom is the largest producer. If (FCX) closes under $40, stop out of all short-term longs immediately.
Housing Starts Dive, as builders run out of materials at reasonable prices. It gave the Dow Average a punch in the nose worth $220. Single family homes took the big hit, down 13.4% to 1.08 million. Permits are still up 70% YOY from when Covid completely shut the industry down. This is the most inflationary sector of the economy right now but barely registers in the CPI numbers. Prices must go even higher for frustrated buyers which are accelerating their rate of increase. Builders are including contingency clauses that allow price rises after the sale, a first. The South has dominated in starts where the population is moving and took the biggest hit. Buy (LEN), (KBH), and (PHM) on dips.
Existing Home Sales Drop 2.7%, in April to 5.85 million units. Inventories are down 20% YOY to only an unimaginable two-month supply. There’s nothing for sale. With the strongest YOY price gains in history, there is nothing for sale. It’s all about high prices, high prices, high prices. Homes over $1 million are up an incredible 214% YOY. The 70-year migration from North to South continues, costing democrats 5 seats in the House. Millennials are entering their peak home-buying years and that $150,000 four-bedroom home in Savannah, GA doesn’t look so bad.
Bitcoin is the Most Crowded State in the World, according to a survey of investment managers. That may explain the 35% plunge in cryptocurrency since April. Is this the end of the Ponzi scheme? Technology and ESG stocks are the second and third most over-owned, which may explain their recent flaccid performance.
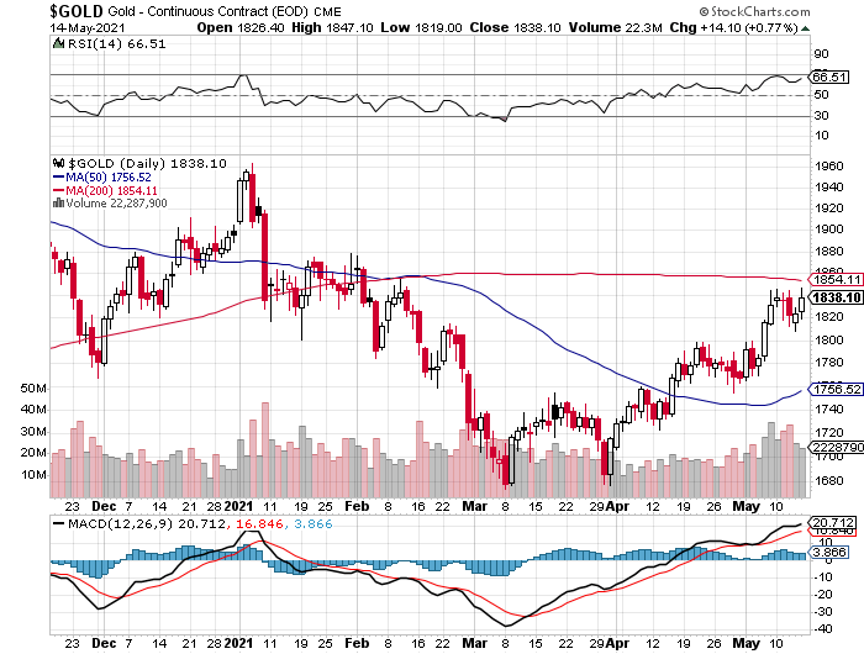
Why is the Gold Hedge Working this Time? The Barbarous relic is finally giving investors the insurance and the downside hedge they need, after failing to do so during the last correction in February. That’s because interest rates were spiking in the winter but aren’t now. Interest rates are the enemy of all no-yielding assets, like precious metals.
Fed Hints of Early Rate Rise, trashing both stocks and bonds. The big one could be here, a complete collapse of the US Treasury bond market. I’m already running the biggest (TLT) shorts ever. We should fall from the current $135 to $120 by yearend. Sell all (TLT) rallies.
Lumber Futures Collapse by 40%. There goes your inflation. Now if only Biden will end the Trump-era import duty on Canadian lumber. It gives a big boost to the “transitory” camp, arguing that this is just a one or two-month spike spawned by the cover recovery. Soaring lumber prices had been a key factor igniting new home prices.
Applied Materials Knocks the Cover off the Ball, reporting blowout earnings. The semiconductors equipment maker has been the best performing chip-related stock of 2021, up 72%. (AMAT) sees a structural chip shortage lasting for years. DRAMs are speeding up, while NAN is slowing down. Customers are placing orders years in advance for the first time ever. A new $7.5 billion stock buyback plan and 9% dividend increase were announced. Buy (AMAT) on the dips.
My Ten-Year View
When we come out the other side of pandemic, we will be perfectly poised to launch into my new American Golden Age, or the next Roaring Twenties. With interest rates still at zero, oil cheap, there will be no reason not to. The Dow Average will rise by 400% to 120,000 or more in the coming decade. The American coming out the other side of the pandemic will be far more efficient and profitable than the old. Dow 120,000 here we come!
My Mad Hedge Global Trading Dispatch profit reached 7.48% gain so far in May on the heels of a spectacular 15.67% profit in April. That leaves me 50% invested and 50% cash. We actually have a shot at reaching a double-digit performance for the seventh month in a row.
My 2021 year-to-date performance soared to 67.24%. The Dow Average is up 11.79% so far in 2021.
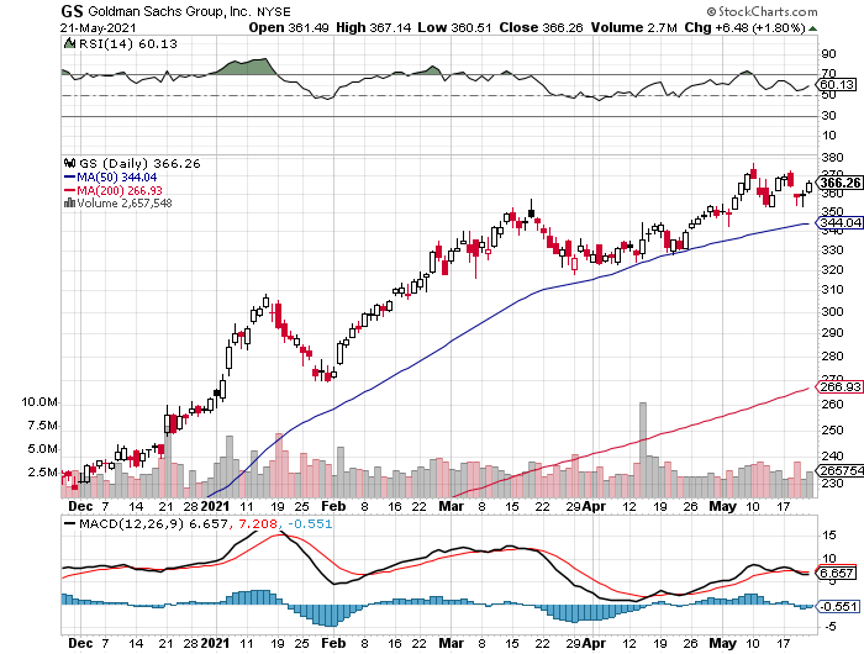
We got another major meltdown last week followed by an immediate recovery. I used the dip to reinitiate new positions in the (TLT), Goldman Sachs (GS), and Berkshire Hathaway (BRKB) to replace ones that expired on the Friday options expiration.
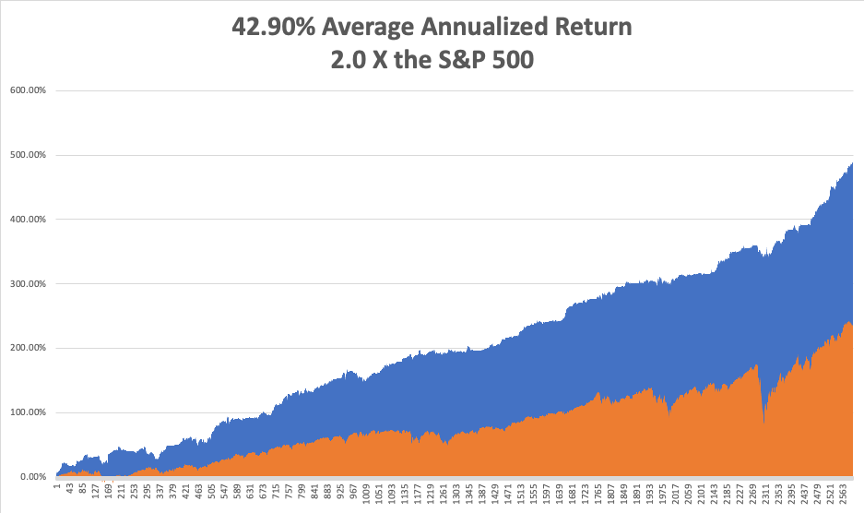
That brings my 11-year total return to 489.79%, some 2.00 times the S&P 500 (SPX) over the same period. My 11-year average annualized return now stands at an unbelievable 42.90%, easily the highest in the industry.
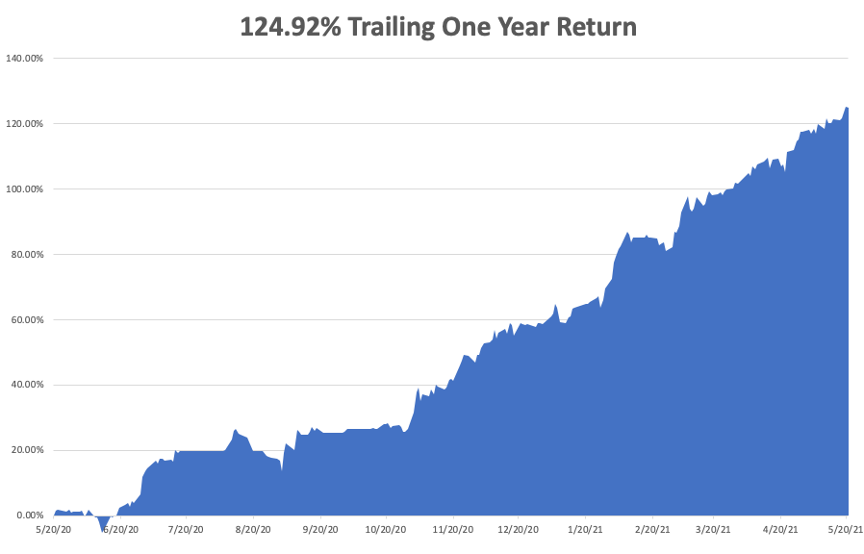
My trailing one-year return exploded to positively eye-popping 124.92%. I truly have to pinch myself when I see numbers like this. I bet many of you are making the biggest money of your long lives.
We need to keep an eye on the number of US Coronavirus cases at 33.1 million and deaths topping 590,000, which you can find here. Some 33.1 million Americans have contracted Covid-19.
The coming week will be a weak one on the data front.
On Monday, May 24, at 8:30 AM, the Chicago Fed National Activity Index is released.
On Tuesday, May 25, at 10:00 AM, the S&P Case Shiller National Home Price Index for March is announced.
On Wednesday, May 26 at 8:30 PM, MBA Mortgage Applications are revealed.
On Thursday, May 27 at 8:30 AM, the Weekly Jobless Claims are Published. We also get a second estimate for the red hot Q2 GDP.
On Friday, May 28 at 8:30 AM, the even hotter Personal Spending for April is disclosed. At 2:00 PM, we learn the Baker-Hughes Rig Count.
As for me, as this pandemic winds down, I am reminded of a previous one in which I played a role in ending.
After a 30-year effort, the World Health organization was on the verge of wiping out smallpox, a scourge that had been ravaging the human race since its beginning. I have seen Egyptian mummies at the Museum of Cairo that showed the scarring that is the telltale evidence of smallpox, which is fatal in 50% of cases.
By the early 1970s, the dread disease was almost gone but still remained in some of the most remote parts of the world. So, they offered a reward to anyone who could find live cases.
To join the American Bicentennial Mt. Everest Expedition in 1976, I took a bus to the eastern edge of Katmandu and started walking. That was the furthest roads went in those days. It was only 150 miles to basecamp and a climb of 14,000 feet.
Some 100 miles in, I was hiking through a remote village, which was a page out of the 14th century, back when families threw buckets of sewage into the street. The trail was lined with mud brick two-story homes with wood shingle roofs, with the second story overhanging the first.
As I entered the town, every child ran to their windows to wave, as visitors were so rare. Every smiling face was covered with healing but still bleeding smallpox sores. I was immune, since I received my childhood vaccination, but I kept walking.
Two months later, I returned to Katmandu and wrote to the WHO headquarters in Geneva about the location of the outbreak. A year later, I received a letter of thanks at my California address and a check for $100 telling me they had sent in a team to my valley in Nepal and vaccinated the entire population.
Some 15 years later, while on customer calls in Geneva for Morgan Stanley, I stopped by the WHO to visit a scientist I went to school with. It turned out I had become quite famous, as my smallpox cases in Nepal were the last ever discovered.
The WHO certified the world free of smallpox in 1980. The US stopped vaccinating children for smallpox in 1972, as the risks outweighed the reward.
Today, smallpox samples only exist at the CDC in Atlanta frozen in liquid nitrogen at minus 346 degrees Fahrenheit in a high-security level 5 biohazard storage facility. China and Russia probably have the same.
That’s because scientists fear that terrorists might dig up the bodies of some British sailors who were known to have died of smallpox in the 19th century and were buried on the north coast of Greenland remaining frozen ever since. If you need a new smallpox vaccine, you have to start from somewhere.
As for me, I am now part of the 34% of Americans who remain immune to the disease. I’m glad I could play my own small part in ending it.
Stay healthy.
John Thomas
CEO & Publisher
The Diary of a Mad Hedge Fund Trader

On Mt. Everest, Smallpox-Free in 1976
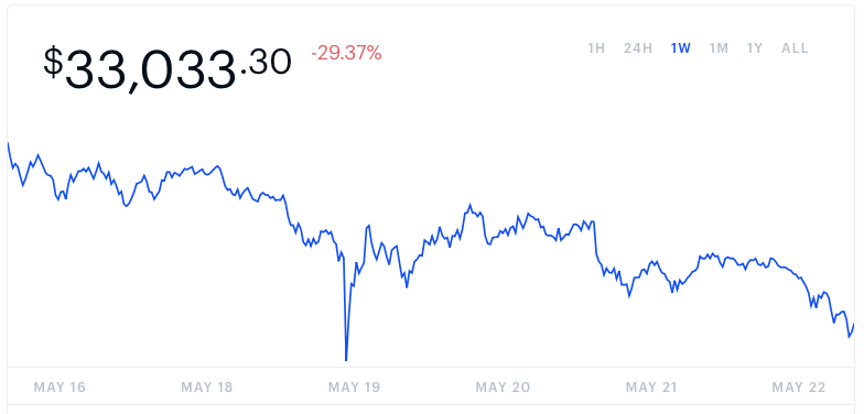
Bitcoin
Global Market Comments
May 18, 2021
Fiat Lux
Featured Trade:
(ON THE AIR WITH CASEY STUBBS),
(HOW TO HANDLE THE FRIDAY, MAY 21 OPTIONS EXPIRATION),
(UNP), (TLT)

Followers of the Mad Hedge Fund Trader alert service have the good fortune to own TWO deep-in-the-money options positions that expire on Friday, May 21, and I just want to explain to the newbies how to best maximize their profits.
These involve the:
(TLT) 5/$143-$146 put spread 10.00%
(UNP) 5/$200-$210 call spread 10.00%
Provided that we don’t have another 3,000-point move down in the market by next week, these positions should expire at their maximum profit points.
So far, so good.
I’ll do the math for you on our oldest and least liquid position, the Union Pacific (UNP) May 21, 2021, $200-$210 vertical in-the-money vertical Bull Call debit spread, which I almost certainly will run into expiration. Your profit can be calculated as follows:
Profit: $10.00 expiration value - $8.70 cost = $1.30 net profit
(12 contracts X 100 contracts per option X $1.30 profit per options)
= $1,570 or 14.97% in 18 trading days.
Many of you have already emailed me asking what to do with these winning positions.
The answer is very simple. You take your left hand, grab your right wrist, pull it behind your neck, and pat yourself on the back for a job well done.
You don’t have to do anything.
Your broker (are they still called that?) will automatically use your long position to cover your short position, canceling out the total holdings.
The entire profit will be credited to your account on Monday, May 24 and the margin freed up.
Some firms charge you a modest $10 or $15 fee for performing this service.
If you don’t see the cash show up in your account on Monday, get on the blower immediately and find it.
Although the expiration process is now supposed to be fully automated, occasionally machines do make mistakes. Better to sort out any confusion before losses ensue.
If you want to wimp out and close the position before the expiration, it may be expensive to do so. You can probably unload them pennies below their maximum expiration value.
Keep in mind that the liquidity in the options market understandably disappears and the spreads substantially widen when a security has only hours, or minutes until expiration on Friday, May 21. So, if you plan to exit, do so well before the final expiration at the Friday market close.
This is known in the trade as the “expiration risk.”
One way or the other, I’m sure you’ll do OK, as long as I am looking over your shoulder, as I will be, always. Think of me as your trading guardian angel.
I am going to hang back and wait for good entry points before jumping back in. It’s all about keeping that “Buy low, sell high” thing going.
I’m looking to cherry-pick my new positions going into the next month-end.
Take your winnings and go out and buy yourself a well-earned dinner. Just make sure it’s take-out. I want you to stick around.
Well done, and on to the next trade.
You Can’t Do Enough Research
Global Market Comments
May 17, 2021
Fiat Lux
Featured Trade:
(MARKET OUTLOOK FOR THE WEEK AHEAD, or WHY HISTORY RHYMES),
(TLT), (SPY), (FCX), (MSFT), (DAL), (QQQ), (VIX), (DAL), (UUP)


The 19th century humorist and writer, Mark Twain, said, “History never repeats itself, but it rhymes.” This is certainly one of those rhyming times.
Remember back in 2011 when the Dow hit a short-term peak at $12,300 in May of 2011? The Cassandras had a heyday. The bull market was over, stocks were imminently going to crash, and the next stop for the Dow was $3,000. Gold and bonds were the only safe places.
Those who drank the Kool-Aid missed the greatest investment opportunity of the century and are now driving for Uber cars to earn their crust of bread. Those who drank the Kool-Aid twice sold their homes as well ahead of the greatest real estate boom of all time.
Not that a correction wasn’t sorely needed, we needed to scare money out of what I call the “super liquidity” investments like Bitcoin, SPACS, and tech companies selling at 100 times sales with failing business models.
We also needed to put the fear of god into newbie day traders by teaching them that stocks go down as well as up. We’ve already made good progress on this front. With many of the “meme” stocks down by half or more since February, we are already making good progress on that front.
What will power the Dow to my now very prescient looking $40,000 target by yearend? The unwind of the 40-year-old bull market in bonds has barely just begun. Ten-year US Treasury bond yields ($TNX) have only appreciated from 0.32% to 1.68%, compared to 5.6% at the last 2007 peak. That means there are still many tens of trillions of dollars to shift out of bonds (TLT) and INTO STOCKS!
Once the current correction ends, money will pour back into the recent leaders, the economic cyclicals, including financials, commodities, industrials, and commodities.
Technology will stay in the penalty box for the foreseeable future until they become under-owned and cheap again. The good news here is that tech earnings are growing at such a prolific rate that the sector is losing two price earnings multiple points a month and will return to the bargain basement in the not-too-distant future.
The long term view here is that you want to rent growth, but own tech, which still has double the growth rate of everything else.
It all makes my 2021 $40,000 Dow Average target look like a piece of cake, and my 2030 goal of $120,000 positively conservative, cautious, and circumspect.
Notice that our 2,000 point-swan dive in the Dow last week lasted only three days, and then delivered the sharpest fall in the Volatility Index (VIX) in history, from $29 to $19 in only 24 hours. The writing is still on the wall. People want to BUY.
Inflation explodes, with the Consumer Price Index posting a ballistic 4.2% YOY rate, the fastest gain since 2009. The Fed believes this is a temporary surge, the markets not so much. Bonds take it on the nose. Keep selling rallies in the (TLT). We’re making a fortune here.
Volatility Index (VIX) soars to $29, almost doubling in a week. Call me when it tops $30. That’s the usual signal for a short-term stock market bottom. I’m relaxed because I’m going into this with 80% cash and have just made a huge fortune on bond shorts.
Value and cyclicals are still the Big Play. That was the message of the stock market on Friday’s wild day which saw an 11-basis point trading range in the ten-year US treasury bond. If you think the next big move in rates is up, then Cyclicals will roar, and techs will fade.
It’s all about buying what people are underweight and selling what they are overweight. I’m looking for cyclicals that have recently corrected. Stay tuned to this station.
US Inventories see solid gains as retailers load the boat for the biggest economic recovery of all time. March was up 1.3%. One of an endless series of data points pointing to the best business conditions in a century.
The Home Buying Frenzy continues, with the median price for a single-family home soaring by 16.2% to $319,200 in Q1, according to the National Association of Realtors. Record high prices are hitting all markets. The perfect upside storm continues.
Weekly Jobless Claims come in at 473,000, a new post-Covid low. Continuing claims fall to 3,655,000. The greatest economic recovery of all time continues.
Producer Prices leap in April, up 0.6% following a 1% gain in March. It is a natural follow-on from the hot CPI. The PPI tracks changes in production costs, and supply bottlenecks and shortages tied to the pandemic recovery have caused commodity prices to soar. Temporary or continuing, that is the big debate. Watch the bond market for clues.
Stanley Druckenmiller says Bonds are Toast, and The Dollar is Worse. I couldn’t agree more with my old friend and trading counterparty. Current Fed policies are now the most extreme in history and threaten the reserve status of the US dollar. Sell all rallies in the (TLT) and the (UUP).
My Ten Year View
When we come out the other side of pandemic, we will be perfectly poised to launch into my new American Golden Age, or the next Roaring Twenties. With interest rates still at zero, oil cheap, there will be no reason not to. The Dow Average will rise by 400% to 120,000 or more in the coming decade. The American coming out the other side of the pandemic will be far more efficient and profitable than the old. Dow 120,000 here we come!
My Mad Hedge Global Trading Dispatch profit reached 3.83% gain so far in May on the heels of a spectacular 15.67% profit in April. That leaves me 30% invested and 70% cash.
My 2021 year-to-date performance soared to 63.59%. The Dow Average is up 13.47% so far in 2021.
During the stock market meltdown, my hedges with shorts in the S&P 500 (SPY), NASDAQ (QQQ), and the United States Treasury Bond Fund (TLT) performed spectacularly well, leaving me up on the week. I managed to limit myself to only two stop losses, in Microsoft (MSFT) and Delta Airlines (DAL).
While everyone else was running around like chickens with their heads cut off, I was as relaxed as ever. Our worst case for May is that we will be only up single digits, instead of the double-digit gains of the past six months. That is not a bad “worst case” to have.
That brings my 11-year total return to 486.14%, some 2.00 times the S&P 500 (SPX) over the same period. My 11-year average annualized return now stands at an unbelievable 42.45%, easily the highest in the industry.
My trailing one-year return exploded to positively eye-popping 127.09%. I truly have to pinch myself when I see numbers like this. I bet many of you are making the biggest money of your long lives.
We need to keep an eye on the number of US Coronavirus cases at 33 million and deaths topping 586,000, which you can find here.
The coming week will be a weak one on the data front.
On Monday, May 17, at 9:45 AM, the New York Empire State Manufacturing Index for May will be out
On Tuesday, May 18, at 10:00 AM, the Housing Starts for April are announced.
On Wednesday, May 19 at 2:00 PM, Minutes from the last Federal Reserve FOMC Meeting are published.
On Thursday, May 20 at 8:30 AM, the Weekly Jobless Claims are published.
On Friday, May 21 at 10:00 AM, Existing Homes Sales for April are announced. At 2:00 PM, we learn the Baker-Hughes Rig Count.
As for me, we had a big 4.7 earthquake at Lake Tahoe last week. The healthy live trees vibrated and swayed. But all of the brittle dead trees killed by pine beetles during the draught snapped at the base and fell over.
Those blocked all the fire roads, so every emergency and public service organization on the lake was called up and sent up into the mountains with chain saws. That included me, a member of Lake Tahoe Search and Rescue.
I hiked up to 9,000 feet with a 50-pound load and went to work. We cut these enormous 100-foot conifers into one-foot rounds and then rolled them off the road. Everyone else on the job was under 40.
After a day of heavy lifting, I hiked down the mountain and collapsed into bed. I slept for 12 hours, which is why the Monday letter was late. They say 70 is the new 40. I am the proof of that.
So can 100 be the new 60? One can only hope.
How was your weekend?
Stay healthy.
John Thomas
CEO & Publisher
The Diary of a Mad Hedge Fund Trader
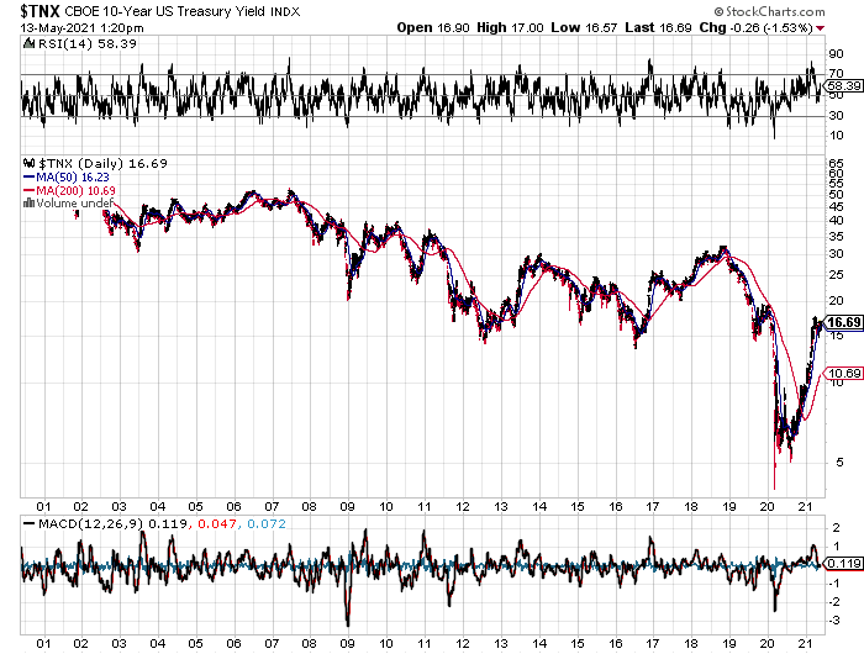
20 Year Chart of Ten Year US Treasury Yields

Below please find subscribers’ Q&A for the May 12 Mad Hedge Fund Trader Global Strategy Webinar broadcast from Lake Tahoe, NV.
Q: Is it too risky to run a double position on the US Treasury Bond Fund (TLT)?
A: Absolutely not, if anything it’s now risky enough. You need to be running triple and quadruple short positions in the (TLT) and skipping all the other marginal trades out there.
Q: Where do I find the put LEAPS recommendations?
A: If you did not get the put LEAP recommendation as part of your regular Global Trading Dispatch service, just log in to the www.madhedgefundtrader.com website and do a search on put LEAPS. Our concierge members get many more LEAPS recommendations, and they get them earlier. I happen to have an opening now, provided you can afford $10,000 a year for the service.
Q: With the inflation numbers coming at 4.2% YOY, how does that affect our strategy?
A: It kills techs, gets them too much lower levels that are much more attractive, and you make a fortune on all of your US Treasury (TLT) shorts. That's the main goal of our strategy right now. In other words, it’s great news.
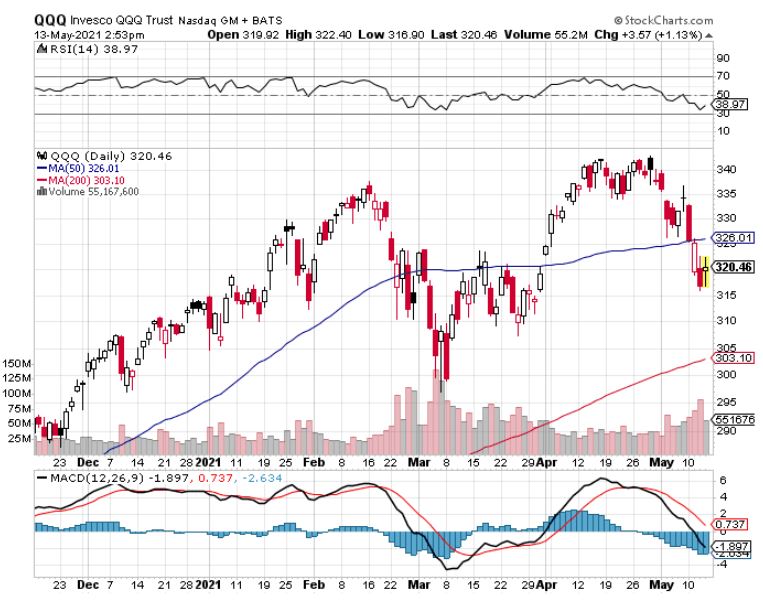
Q: Would you sell technology stocks here and wait for a bounce?
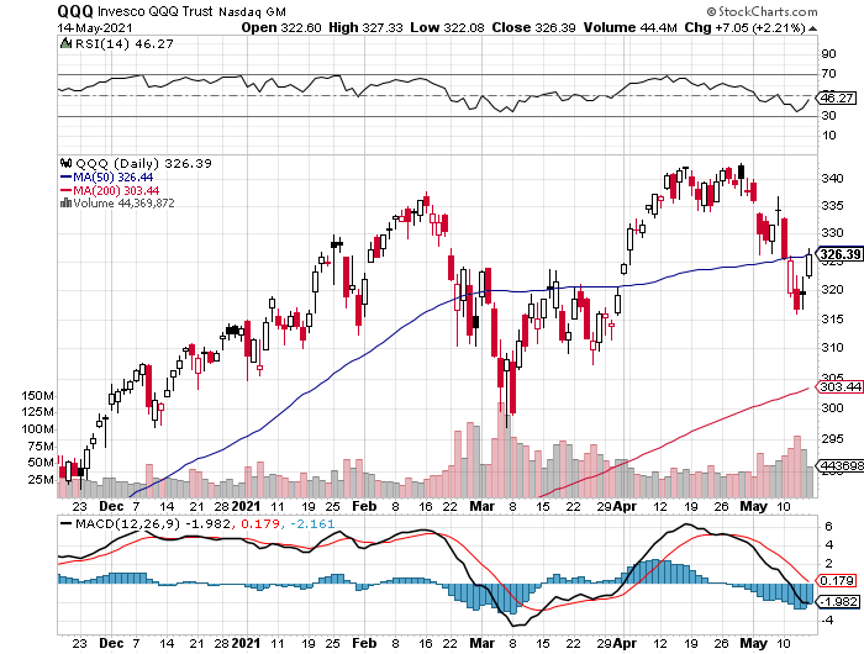
A: No, ideally you would have hedged last week, buying Invesco QQQ Trust NASDAQ (QQQ) and TLT put spreads, and that hedged all your losses in your technology portfolio. The next move is to take profits on your (QQQ) and bond (TLT) shorts and then go unhedged on your tech longs. This is how hedge funds are executing their barbell strategies.
Q: Is the (TLT) $130-$135 vertical bear put spread okay for September, or should I pay more for January?
A: I would go to January because, as you noticed, this market could enter a long sideways period that goes on for months, like we just had. If you have a September and we go into another one of those sideways moves, you’re going to be wishing you did January. You don’t have to pay much more for January, only a few cents and even then, you’re looking at a 100% return.
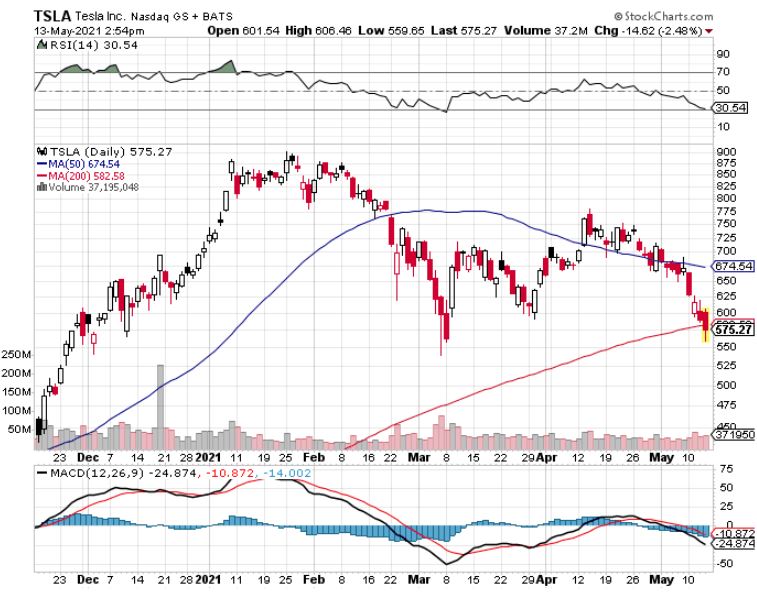
Q: Is Tesla (TSLA) under $600 a good buy?
A: It's even a better buy at $545, which is the double bottom low of the last selloff; so, I would wait for that. And then I would essentially not do the stock, but a $450 call spread to reduce your risk even further.
Q: I just entered the Freeport McMoRan (FCX) LEAPS today. Should I average in a lower price?
A: Absolutely yes, I don't think it drops much from here since everyone expects it to double. And if you have the 8- or 20-month LEAPS, the day-to-day price move isn’t very big, given how much the stock is moving. That's the great thing about LEAPS—it reduces the volatility of your portfolio because you have such enormous time value in these long-dated LEAPS. It's really good to have a couple of these in your portfolio, just to act as a sort of sea anchor to reduce volatility; and of course, the (TLT) and (FCX) are two of the best trades out there.
Q: Would you roll a losing position?
A: I do that maybe once a year, in extraordinary circumstances. I would rather take a short-term loss on Microsoft (MSFT) and if it drops $10 more, then I go back into the position. You never know when you get one of these huge selloffs and you can take the full 10% hit on these call spreads. Remember these are highly leveraged positions; they are leverage ten to one or more. When the stock moves even a little bit against you, you don't want leverage whatsoever. Better to get out of a small hole now than a much bigger hole later. But that's just me after 52 years of trading.
Q: The hedge fund legend Stanley Druckenmiller said the current Fed monetary policy puts the US dollar at risk of losing its reserve currency status. What do you think about this?
A: I’m totally in line with him on being short the dollar and short treasuries, but I don't think the dollar will lose reserve status in my lifetime. What would they replace it with? Anything you look at has far more problems with liquidity and stability than the US dollar. I literally have been asked this many times a year for the last 50 years, ever since the US went off the gold standard in 1972. The strongest reserve currency in the world has the strongest military, and as long as that’s true, the US dollar will not lose its reserve status. That has been true since the Roman Empire. In fact, you still find Roman coins floating around.
Q: When do we stop out of Delta (DAL)?
A: When we break 43. Very simple. You break your first strike price at $43.00 and you are out of there, losing about $800 on the position, which is our hard and fast stop loss rule. Never let emotion into the equation. Stop losses should be automatic and mechanical.
Q: What do you think of Nordstrom (JWN)?
A: I think they were close to bankruptcy, but I'm looking at the higher end retailers to make a recovery. While the bricks and mortar were shut down, they did develop pretty big online businesses. That's true for Macy’s (M), Kohls (KSS) and a lot of the other businesses that survived the pandemic.
Q: Is Mastercard (MA) better than Visa (V)?
A: All three credit card companies are more or less six of one and half a dozen of the other. So, buy all three if you’re not sure. American Express (AXP) has more exposure to business travel, so if you’re looking for a business travel recovery, that's the one you want to own.
Q: Is it too late to get into (TLT) LEAPS today?
A: I think it is kind of late for the short term. We have dropped $5.00 since I put this thing out on Friday, and I would rather let it wait and fall two more points and then rally five points and then put more on. You should sell the next rally peak, wherever that is, even if we start from $130. You can even do in the money LEAPS, like a $135-$140 (TLT) going out to January—the profit on that is still well over 50%. So even today returns are very high on that position.
Q: Would you buy more Palantir (PLTR) on the recent dip?
A: Yes, but only if you have a long-term view. The CEO said he could care less about the stock price, and when CEOs say that, the stock sells off huge. If the CEO doesn't care about the stock, then nobody else does either. I think their business model is interesting for the long term and I think eventually some kind of tech rally will take it back up. That is not now.
Q: Is First Solar (FSLR) a buy?
A: We’re getting into buy territory. They had a monster 4X rally off the bottom last year. But the entire green sector got wildly overbought by February and was then dragged down with the rest of the tech selloff. I think solar is going to have a major long-term bull market. Look to buy for the long term. It’s not in call spread or LEAP territory for me yet, but it will be. Another good one to buy is SunPower (SPWR).
Q: Do you have several different subscriptions? How do I find out about them?
A: Yes, go to the www.madhedgefundtrader.com store. We have services that go from free all the way up to $10,000 a year. Just pick one that suits your level of experience, risk tolerance, and the amount of capital you have to work with.
Q: How do I get trade alerts?
A: Email customer support at support@madhedgefundtrader.com , send them your cell number and they will set you up with the trade alert service which goes straight to your phone.
Q: How do existing subscribers get a price break on your other subscriptions?
A: You make so much money trading from your existing service, that you never have to ask a price on anything again. JP Morgan once said that “If you have to ask the price of a yacht you don’t need to know.
Q: I’m doing extremely well in the Invesco Currency Shares Australian Dollar Trust (FXA) that you recommended a year ago.
A: Yes, you and everyone else who believed my story. Australia is a call option on a global economic recovery with all its commodity exports like iron ore and natural gas. My target is $100 in two years.
Q: Should I buy the US dollar (UUP) or wait for another down move?
A: I wouldn't touch it with a 10-foot pole. I think the move down in the dollar is a 10-year event that we’re one year into. By the way, currencies do go down for decades at a time because it will take that long to cut back our borrowing and start paying back some of the principle. That is a long way off.
Q: If Bitcoin drops do tech stocks drop as well?
A: I don't think there's that much of a correlation between Bitcoin and tech stocks. Tech stocks have major valuation support about 10% down and for sure 20% down. That gets you a price-earnings multiple for the big tech stocks of only 18X, which was the low in the 2008 crash and the 2000 Dotcom crash. So major historical support at an 18X multiple Bitcoin has no technical or fundamental support whatsoever because there are no fundamentals, there are only charts.
Q: Do you think Chinese carmakers like Nio (NIO) and Xpeng Inc. (XPEV) will ever catch up with Tesla?
A: No, never. China has never been able to reach the safety standards necessary to export cars to the US. They've been making electric cars in China longer than Tesla has. I was visiting electric car factories in China around 2007-2008, and they just can’t get the quality up. In the meantime, Tesla is moving ahead at warp speed, so I don't see a risk to them.
Q: I have a big position in Clorox (CLX) that I’ve made a lot of money on; should I sell it?
A: Yes, you’ll never get more reasons to buy Clorox at a great price than in a pandemic. There's actually a shortage of Clorox right now. So yes, take profits on (CLX).
Q: Would you buy Kathy Wood’s Ark Innovation ETF (ARKK) right here today?
A: No, I think we have more interest rate rallies to go and more tech selloffs to go. I would wait and buy it with ten-year US Treasury yields at 2.00%. I would rather be buying this on the way up and averaging up, than buying on the way down and averaging down.
Q: How will stocks be affected at 2.00% yields in the ten-year?
A: I think what happens is we run up 2.00%, bonds collapse, and then it stops. And when it stops and starts to pull back from 2.00%, then you get a new rally in the stock market, especially in technology stocks.
Q: Is it a good idea to hold 30-year US treasury bonds?
A: It's a terrible idea. I would be selling short US Treasury bonds up the wazoo—especially the 30 year which has the greatest price sensitivity to a move up in interest rates.
Q: Should we buy put LEAPS on oil (USO) and energy (XLE)?
A: Yes but not yet; as long as you have a red hot economy in the short term, you don’t want to be shorting anything in energy. Next year, however, may be a different story. The economic growth rate will start to slow down, oil demand starts to slow down, and the rate of replacement of gasoline cars by EV’s accelerate with all the new production. So that's next year’s trade, not this year’s trade, but it’s a good idea.
Q: When the Volatility Index (VIX) hits $30, what would be your first choices to pick up?
A: I would go for all the domestic recovery, interest rate, and industrial plays that have been working so well this year. They will continue to lead the market until we get a major reversal down in interest rates.
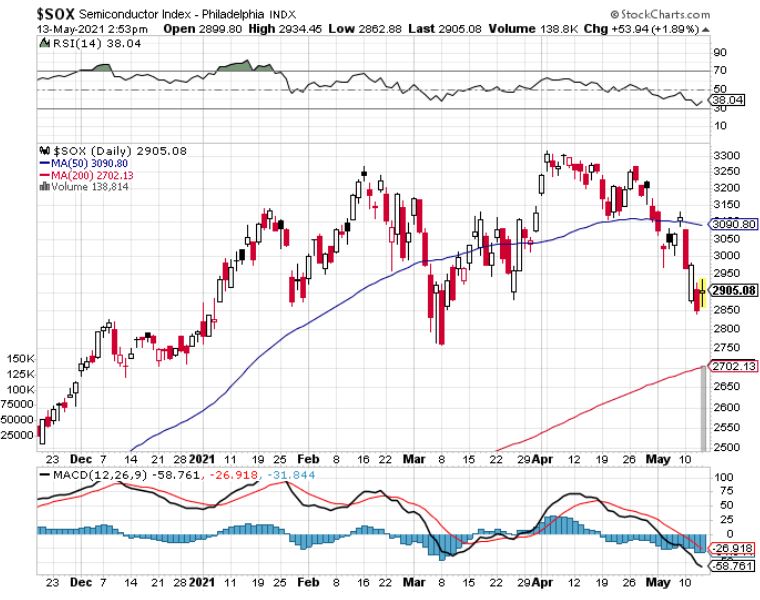
Q: When do I buy semiconductor stocks (SOX)?
A: When the rest of tech bottoms out and starts its way back up. It’s better to average up than average down.
To watch a replay of this webinar with all the charts, bells, whistles, and classic rock music, just log in to www.madhedgefundtrader.com, go to MY ACCOUNT, click on GLOBAL TRADING DISPATCH, then WEBINARS, and all the webinars from the last ten years are there in all their glory.
Good Luck and Stay Healthy
John Thomas
CEO & Publisher
The Diary of a Mad Hedge Fund Trader