Global Market Comments
September 9, 2019
Fiat Lux
Featured Trade:
(MARKET OUTLOOK FOR THE WEEK AHEAD, or SAVED BY A HURRICANE)
(FXB), (M), (XOM), (BAC), (FB), (AAPL),
(AMZN), (ROKU), (VIX), (GS), (MS),
Global Market Comments
September 9, 2019
Fiat Lux
Featured Trade:
(MARKET OUTLOOK FOR THE WEEK AHEAD, or SAVED BY A HURRICANE)
(FXB), (M), (XOM), (BAC), (FB), (AAPL),
(AMZN), (ROKU), (VIX), (GS), (MS),
This was the week when the stock market was saved by Hurricane Dorian.
Why a hurricane?
Because it gave President Trump something else to Tweet about beside China and Jay Powell. The White House went totally silent, at least on matters concerning the stock market. There, the focus instead turned on whether Trump predicted Dorian was going to hit Alabama (it didn’t).
Thank goodness for small favors.
Instead, investors got to hear about progress was purported to be made on the China trade talks with a possible October meeting.
It all reminds me of the 1968 Paris peace talks, which I visited, where I remember Ambassador Avril Harriman storming out of the Majestic Hotel with a very stern expression on his face. They had just spent a year arguing with the North Vietnamese over the shape of the table (they finally settled on an oval).
Brexit finally started lurching towards its inevitable demise. Hard Brexit failed in Parliament, a disaster for Prime Minister Boris Johnson, whose own party and even his own brother voted against him.
Elections will follow which will finally plunge a dagger through the heart of Britain’s attempt to leave the European Community. If this happens, it will be a huge positive for risk markets globally. This is the beginning of the end. Get ready to buy the pound (FXB).
The bad news? Don’t count on this happening again this week, unless we get another hurricane. When a stock market rally is led by sectors with the worst fundamentals, like retail (M), energy (XOM), and banks (BAC), you want to run a mile. It means the rally was driven by short-covering, we are now at a market high, and the short players have a ton of cash.
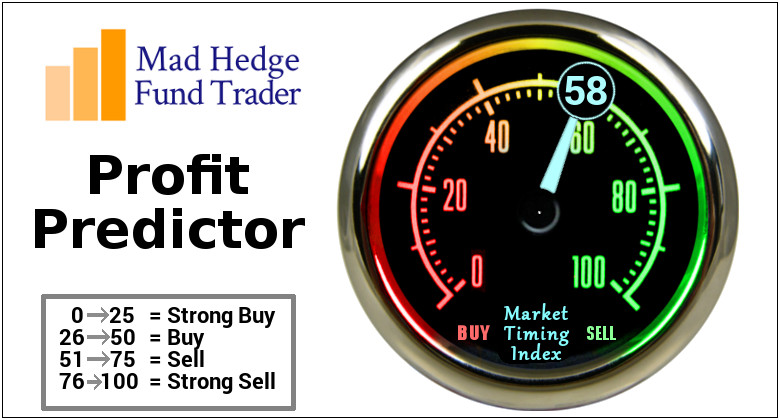
I have been pounded with questions all week if the bottom is in and if it’s time to load the boat with tech stocks yet again. I have to answer with a firm “Not yet!” We still have three weeks to go in September with plenty of time for more volatility.
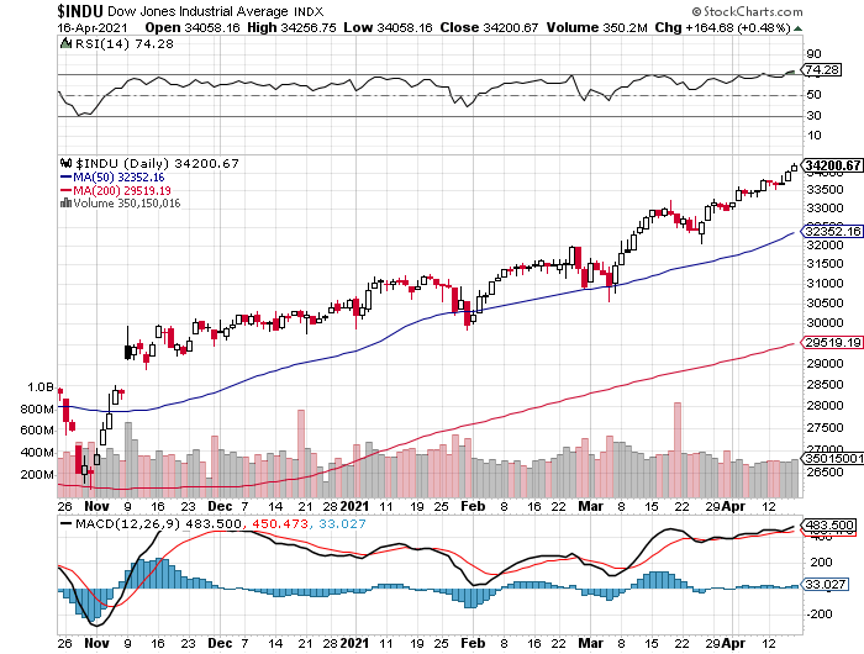
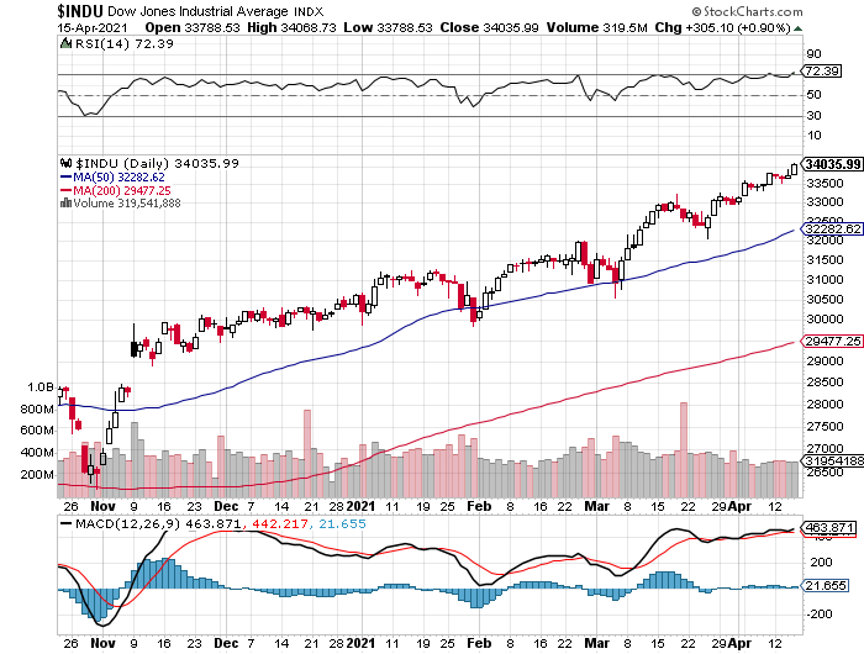
If the Fed cuts interest rates by 25 basis points, the Dow average could crater by 1,000 points. If they don’t cut, which I give a 50/50 chance, it will be down by 2,000 points.
They will be encouraged to cut by an August Nonfarm Payroll Report that came in at a tepid 130,000. The headline Unemployment Rate remained unchanged at 3.7%, a 50-year low. Average Hourly Earnings were an inflationary 0.4%, or 3.2% YOY. June and July were revised down.
The 2020 census was a big factor in August, where the US government hired 25,000 workers to prepare for next year. Without this, August would have come in at a weak 105,000 jobs.
Manufacturing hiring amounted to only 3,000, while Retail lost 11,000 jobs for the seventh consecutive monthly decline. The broader U-6 “discouraged worker” unemployment rate rose from 7.0% to 7.2%.
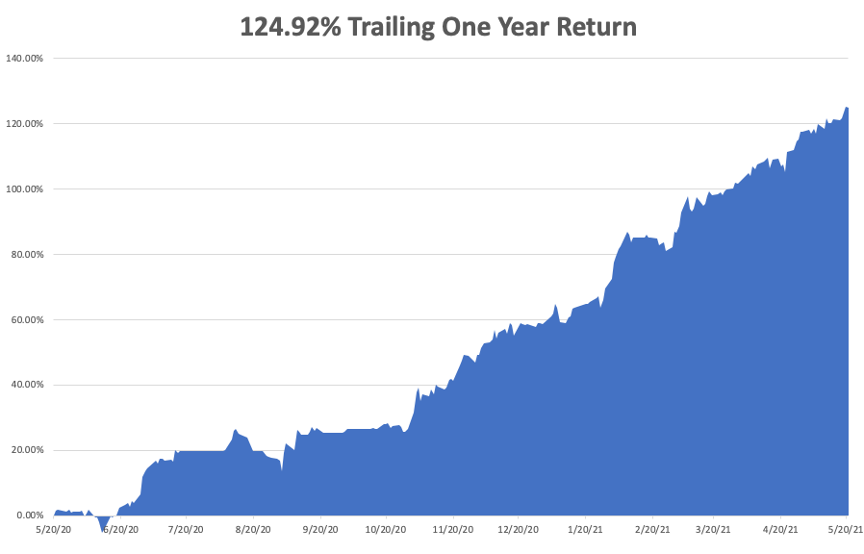
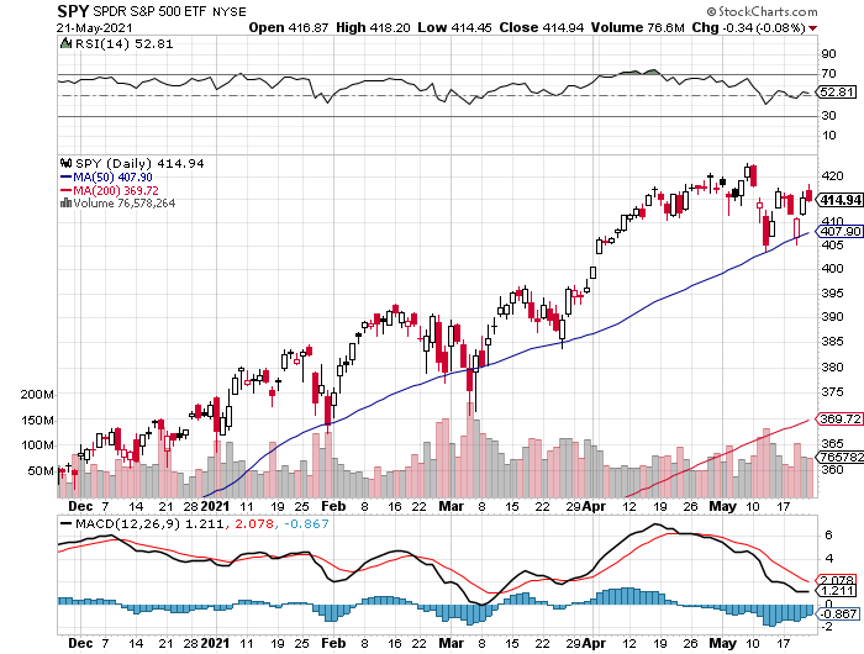
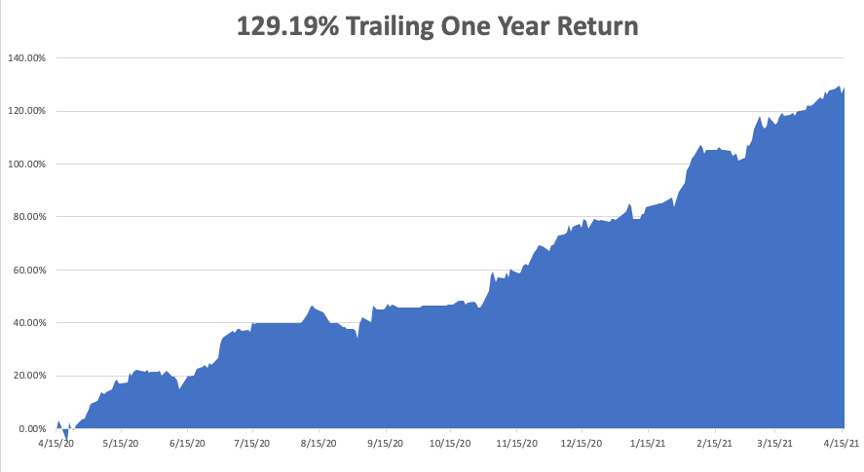
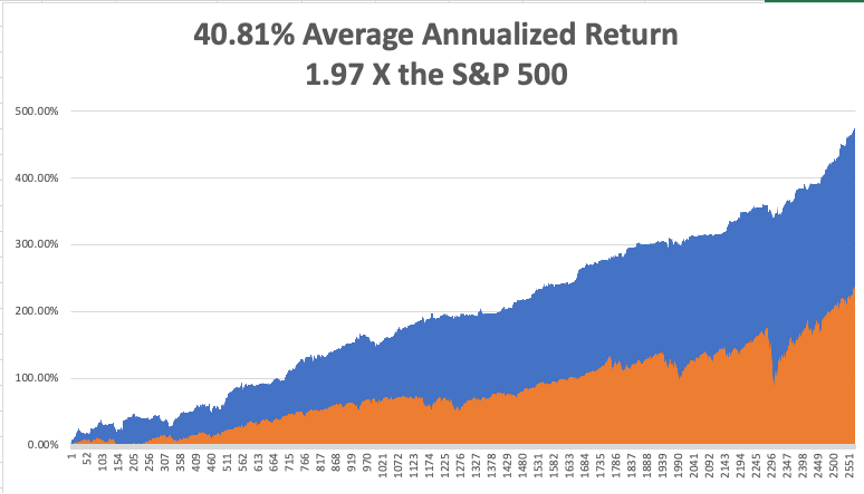
To demonstrate how much value you are gaining with this service, I generated the chart below. Since January 26, 2018 when the S&P 500 peaked, the total return has been zero, with a lot of heart-stopping volatility, including one 20% drawdown.
That has been the cost to the stock market of the trade war, which started only a few days later. The profit created by the Mad Hedge Fund Trader during the same period has been 58.97%.
You couldn’t even beat the Mad Hedge Fund Trader by pouring all your money into big technology stocks. Over the same time, Facebook (FB) fell 4.1%, Apple (AAPL) rose 21.7%, and Amazon (AMZN) by 22.2%.
The only way you could have topped my performance was to pour your life savings into Roku (ROKU), right when Amazon was about to put it out of business. Jeff Bezos partnered with Roku instead of delivering a 225% pop in the shares.
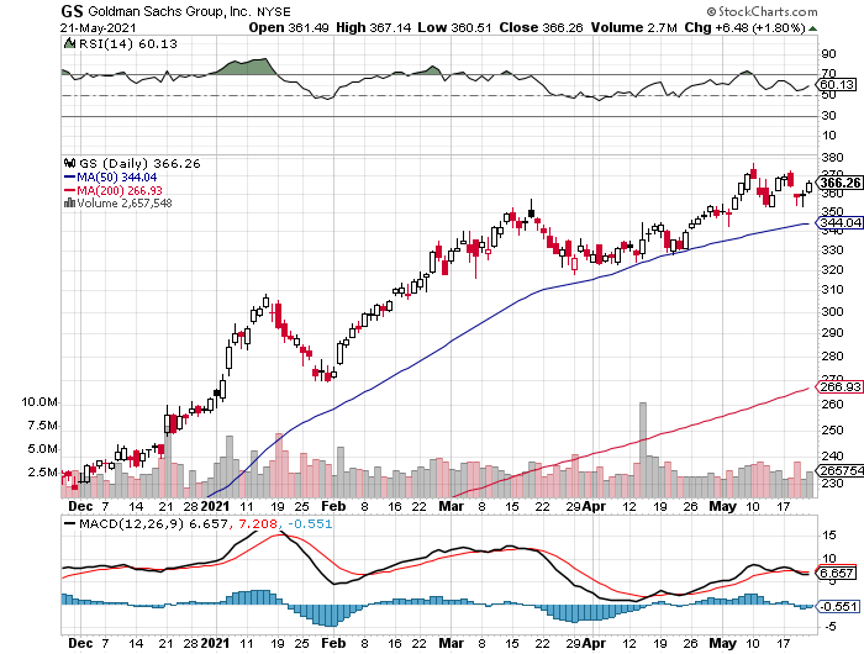
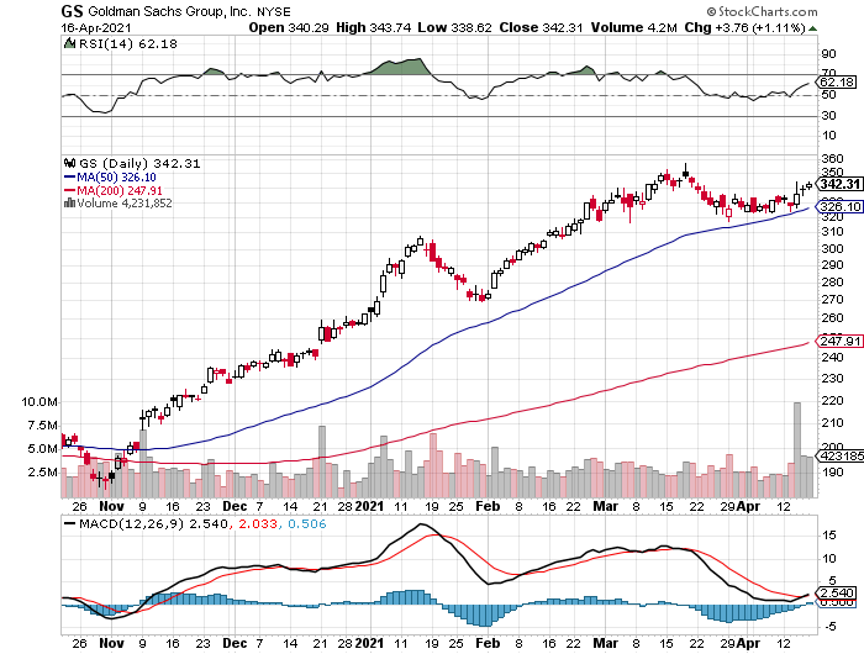
You might think such a performance is blown out of proportion, exaggerated, and fake. However, it is perfectly consistent with the numbers generated for the in-house trading books by senior traders at Goldman Sachs (GS) and Morgan Stanley (MS) where I come from.
In fact, during my day, if a trader earned less than 30% a year on his capital, he got fired or transferred over to covering retail accounts because the firm had so many better places to invest. They are also consistent with the performance of the top-end hedge managers, of which I used to be one.
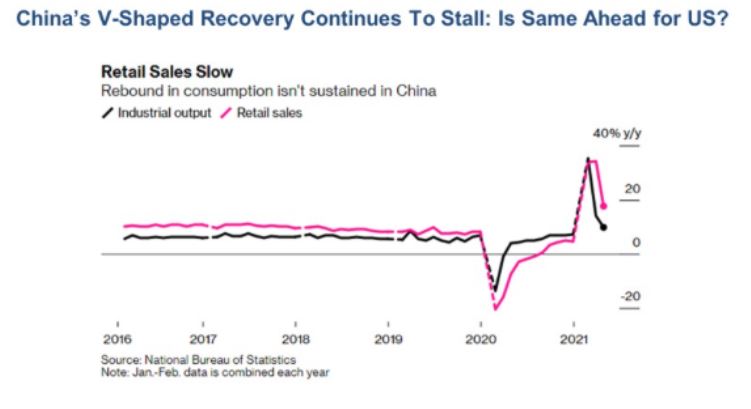
Chinese Manufacturing Activity fell for four consecutive months taking the Purchasing Managers Index below a recessionary 50. If you wreck the economy of the world’s largest customer, the rest of the world goes into recession.
US Manufacturing hit a three-year low, the ISM Manufacturing PMI diving from an average 56.5 to 49.1 in August. Anything below 50 is a recession indicator. Hoping that China will bleed worse than us in a trade war is not a winning strategy. Stocks dove 300 points and the Volatility Index (VIX) shot up to $21 on the news. Avoid risk, as this is going to be a terrible month.
The prospect of a China meeting popped stocks 400 points, with an agreement to meet in October, citing progress on a phone call. Boy, I’m getting tired of this. When can we go back to looking at earnings, dividends, and book value?
The European Central Bank will almost certainly ease this week. It hasn’t worked for ten years so let’s try it again. They’re obviously not printing enough Euros. Overnight rates will fall from -0.4% to -0.6%. Some 30 billion euros a month will hit the economy in a new QE.
The Atlanta Fed downgraded the economy, cutting its Q3 GDP growth forecast from 2.0% to 1.5%. Expect a string of poor data points in the coming months as the delayed effect of an escalated trade war. However, the non-manufacturing service economy remains strong. That’s me, and probably you too.
The Mad Hedge Trader Alert Service has posted its best month in two years. Some 22 or the last 23 round trips, or 95.6%, have been profitable, generating one of the biggest performance jumps in our 12-year history.
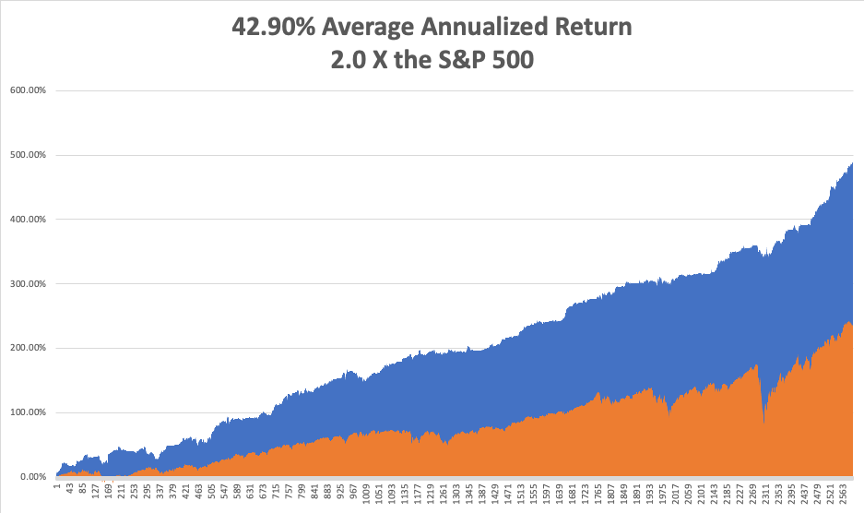
My Global Trading Dispatch has hit a new all-time high of 334.48% and my year-to-date shot up to +34.35%. My ten-year average annualized profit bobbed up to +34.30%.
Better yet, since July 31, we generated a 20% profit for the trade alert service while the gain in the Dow Average was absolutely zero!
I raked in an envious 16.01% in August. All of you people who just subscribed in June and July are looking like geniuses. My staff and I have been working to the point of exhaustion, but it’s worth it if I can print these kinds of numbers.
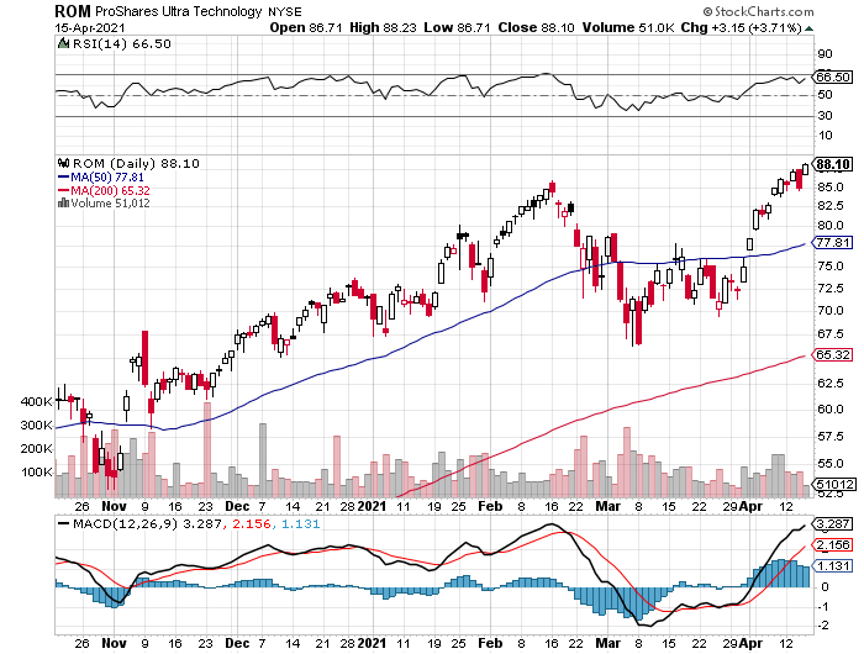
As long as the Volatility Index (VIX) stays above $20, deep in-the-money options spreads are offering free money. I am now 40% long big tech. It rarely gets this easy.
The coming week will be a snore, as it always is after the jobs data.
On Monday, September 9 at 11:00 AM, August Consumer Inflation Expectations are out.
On Tuesday, September 10 at 12:00 PM, the NFIB Business Optimism Index for August is released.
On Wednesday, September 11, at 8:30 AM, the US Producer Price Index is announced.
On Thursday, September 12 at 8:30 AM, the Weekly Jobless Claims are printed. At the same time, the US Inflation Rate is published.
On Friday, September 13 at 8:30 AM, the US Retails Sales are printed. The Baker Hughes Rig Count follows at 2:00 PM.
As for me, I’ll be driving up to Lake Tahoe to make final preparations for the October 25-26 Mad Hedge Lake Tahoe Conference. A record number of black bears have been breaking into homes this summer and I just want to make sure my lakefront estate is OK.
It seems that Airbnb tenants have been leaving trails of cookies to their front doors and painting their refrigerators with peanut butter so they can get better selfies with their ursine neighbors.
Not a good idea.
I’ll be avoiding Interstate 80. A truck carrying 1,000 live chickens crashed there yesterday and the California Highway Patrol was last seen chasing them down the freeway.
Good luck and good trading.
John Thomas
CEO & Publisher
The Diary of a Mad Hedge Fund Trader
Global Market Comments
September 5, 2019
Fiat Lux
SPECIAL VOLATILITY ISSUE
Featured Trade:
(SHOPPING FOR FIRE INSURANCE IN A HURRICANE),
(VIX), (VXX), (XIV),
(THE ABCs OF THE VIX),
(VIX), (VXX), (SVXY),
I am one of those cheapskates who buy Christmas ornaments by the bucketload from Costco in January for ten cents on the dollar because my 11-month theoretical return on capital comes close to 1,000%.
I also like buying flood insurance in the middle of the summer drought when the forecast in California is for endless days of sunshine. That is what we had at the end of July when the (VIX) was plumbing the depths of $12.
Get this one right, and the profits you can realize are spectacular.
It gets better.
If the bottom in volatility exactly coincides with the peak in the stock market that it measures, volatility could be headed back up to the 30% handle, and maybe more.
I double dare you to look at the charts below and tell me this isn’t happening.
Watch carefully for other confirming trends to affirm this trade is unfolding. Those would include a strong dollar, and a weak Japanese yen, Euro, and rising fixed income instruments of any kind.
Notice that every one of these is happening this week!
Reversion to the mean, anyone?
You may know of this from the many clueless talking heads, beginners, and newbies who call (VIX) the “Fear Index”.
For those of you who have a Ph.D. in higher mathematics from MIT, the (VIX) is simply a weighted blend of prices for a range of option contracts on the S&P 500 index (SPX).
The formula uses a kernel-smoothed estimator that takes as inputs the current market prices for all out-of-the-money calls and puts for the front-month and second-month expirations.
The (VIX) is the square root of the par variance swap rate for a 30-day term initiated today. To get into the pricing of the individual options, please go look up your handy dandy and ever-useful Black-Scholes equation.
You will recall that this is the equation that derives from the Brownian motion of heat transference in metals. Got all that?
For the rest of you who do not possess a Ph.D. in higher mathematics from MIT, and maybe scored a 450 on your math SAT test, or who don’t know what an SAT test is, this is what you need to know.
When the market goes up, the (VIX) goes down. When the market goes down, the (VIX) goes up. Period. End of story. Class dismissed.
The (VIX) is expressed in terms of the annualized monthly movement in the S&P 500 (SPX) which, with the (VIX) today at $10, is at $72.54.
So for example, a (VIX) of $10 means that the market expects the index to move 2.89%, or $72.54 S&P 500 points, over the next 30 days.
You get this by calculating $10/3.46 = 2.89%, where the square root of 12 months is 3.46.
The volatility index doesn’t really care which way the stock index moves. If the S&P 500 moves more than the projected 2.89% in ANY direction, you make a profit on your long (VIX) positions.
I am going into this detail because I always get a million questions whenever I raise this subject with volatility-deprived investors.
It gets better.
Futures contracts began trading on the (VIX) in 2004 and options on the futures since 2006.
Since then, these instruments have provided a vital means through which hedge funds control risk in their portfolios, thus providing the “hedge” in hedge fund.
Global Market Comments
August 22, 2019
Fiat Lux
Featured Trade:
(WHAT THE NEXT RECESSION WILL LOOK LIKE),
(FB), (AAPL), (NFLX), (GOOGL), (KSS), (VIX), (MS), (GS),
(TESTIMONIAL)
Global Market Comments
August 19, 2019
Fiat Lux
Featured Trade:
(MARKET OUTLOOK FOR THE WEEK AHEAD, or WHAT A ROLLER COASTER RIDE!),
(SPY), (TLT), (VIX), (VXX), (M),
(WMT), (FB), (AMZN), (GOOGL), (IWM)
I like roller coasters. The Giant Dipper at the Santa Cruz Boardwalk is tough to beat, the last operating wooden coaster in the United States. And I’ll always have fond memories of the Cyclone at Coney Island in New York.
I especially liked this week in the financial markets, which provided more profitable trading opportunities, both on the long and the short side, that any other week of the past decade.
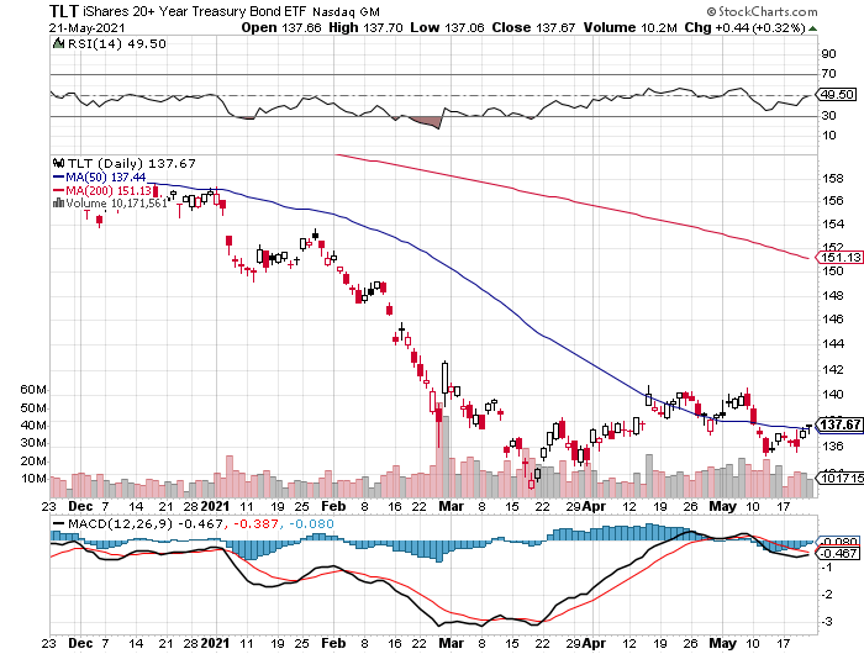
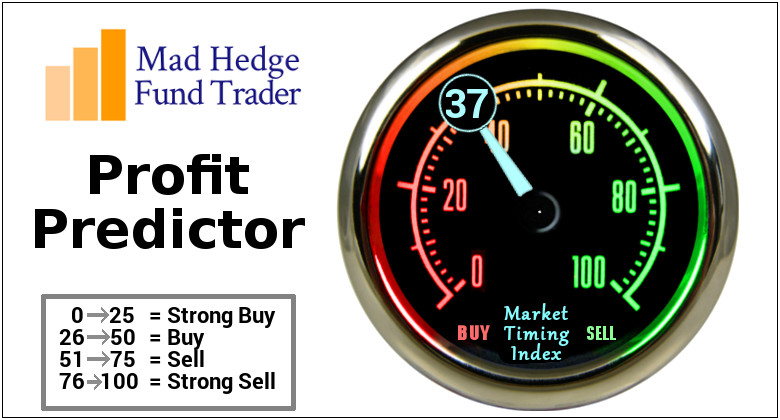
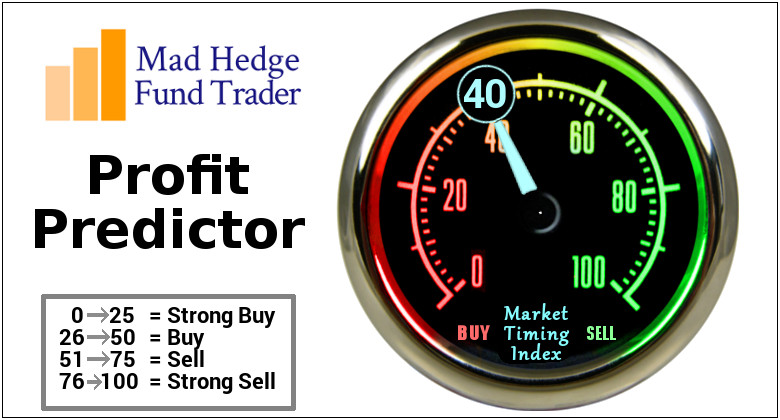
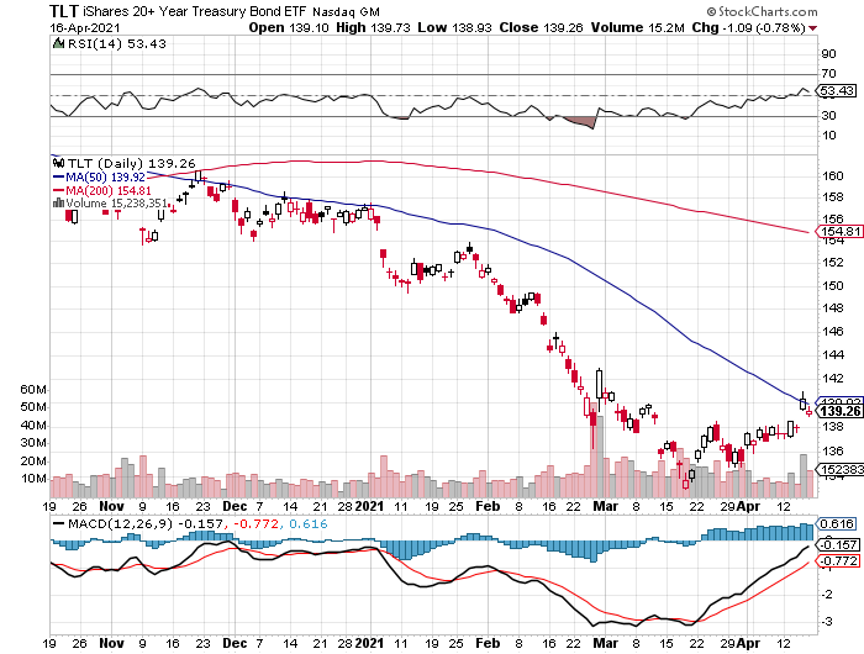
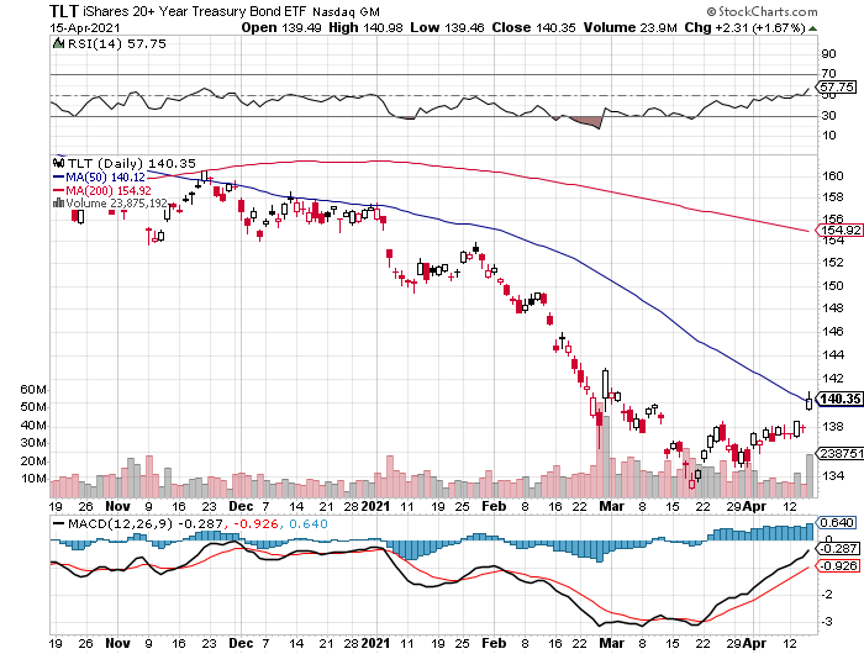
Perhaps the highpoint was on Thursday when I was staring at my screens watching ten year US Treasury bond yields (TLT) bottom at a near historic 1.46%, and my own Mad Hedge Market Timing Index plunging to a lowly 19.
Impulsively, I covered the last of my short positions and started piling on longs in the FANGs. The next morning, the Dow Average opened up 300 points. But then, it’s easy to be bold and decisive when you’re up 30% on the year, compared to only 11% for the Dow Average.
And guess what? The best may be yet to come!
As long as the Volatility Index stays over $20, you will be able to print all the money you want with options spreads. I’m talking 10%-15% A MONTH!
All eyes are now on September 1 when the Chinese announce their own retaliation to our tariff increase. Will they target ag again? Or does the bond market (TLT) take the hit this time (the Chinese government owns $900 billion worth of our debt).
And now for the question that everyone is asking: How far will the stock market fall in this cycle. We have already plunged 10% from the highs on an intraday basis. Could we drop another 10% in this period of high anxiety? Certainly. However, I tend to think it will be less than that.
The initial market pop on Monday came when the new Chinese tariffs were delayed, from September 1 to December 15, on some items. Tell me who saw this one coming. The potential costs of the tariffs are hitting the US more than China. It was worth a 550-point rally in the Dow Average. In 50 years, I’ve never seen such blatant market manipulation.
Gold hit a new six-year high, with the collapse of the Argentine Peso a new factor. A poor election result drove the beleaguered currency down 15% in one day, a massive move.
Now you have to worry about what’s happening in China AND Argentina. For the first time in history, gold now has a positive yield versus the Europe and the Japanese Yen, which both offer negative interest rates.
Hong Kong is becoming a factor driving US markets down. If there is a repeat if the 1989 Tiananmen Square massacre where thousands died, global markets could collapse. The hit to growth will be more than it currently can stand in its present weakened state.
Inflation is taking off, with Core Consumer Inflation for July coming in at a red hot 0.3%, delivering the strongest two-month price burst since 2006. If it keeps up, you can kiss those future interest rate cuts goodbye.
Germany is in recession. That is the only conclusion possible when you see Q2 at -0.1% growth and the economy still in free fall. The ZEW’s figures regarding Germany yesterday were nothing short of horrific as the Economic Sentiment Index fell to -44. When you damage China’s economy, it puts the rest of the world into recession. The global economy has become so interlinked, it can’t become undone without another great recession.
Bonds rates bottomed yesterday, at least for the short term, the intraday low for the ten-year US Treasury yield hitting 1.46%. Welcome to inversion land, where long term interest rates are below short-term ones. Confidence in the economy is melting like an Alaskan glacier. But with three more 25 basis point rate cuts to come, an eventual break below 1.0% is inevitable. Watch for stocks to remake half their recent losses.
Consumer Sentiment cratered in August from 97.0 estimated to 92.1. And that was before the stock market sold off. Consumer spending remains strong. The last time it was this strong was at the market top in 2008, the market top in 1999, and the market top in 1987.
July Housing Starts plunged 4.0%, to 1.191 million units as homebuilders move into recession mode. Not even record low-interest rates can get them to stick their necks out this time. Those that did last time got wiped out.
It’s been pedal to the metal all month with the Mad Hedge Trade Alert Service, with no less than 31 Trade Alerts going out so far. Some 18 or the last 19 round trips have been profitable, generating one of the biggest performance jumps in our 12-year history.
Since July 12, we have clocked a blistering 15.15% in profits or $15,150 for the model $100,000 trading portfolio.
My Global Trading Dispatch has hit a new all-time high of 330.65% and my year-to-date shot up to +30.51%. My ten-year average annualized profit bobbed up to +34.20%.
I have coined a blockbuster 12.18% so far in August. All of you people who just subscribed in June and July are looking like geniuses. My staff and I have been working to the point of exhaustion, but it’s worth it if I can print these kinds of numbers.
The coming week will be a snore on the data front. Believe it or not, it could be quiet.
On Monday, August 19, nothing of note is released.
On Tuesday, August 20 at 10:30 AM, we get API Crude Oil Stocks.
On Wednesday, August 21, at 10:00 the Existing Home Sales are published for July.
On Thursday, August 22 at 8:30 AM, the Weekly Jobless Claims are printed. The Jackson Hole conference of global central bankers and economists begins.
On Friday, August 23 at 8:30 AM the July New Home Sales are announced.
The Baker Hughes Rig Count follows at 2:00 PM.
As for me, I will be attending the Pebble Beach Concourse d’Elegance vintage car show where I will be exhibiting my 1925 Rolls Royce Phantom I, the best car ever made.
I don’t mind the wooden brakes, but it’s too bad they didn’t make adjustable seats in those days to fit my 6’4” frame. However, its price appreciation has been better than Apple’s (AAPL) which I bought as a fixer upper in England during the 1980s for $20,000. My average cost on Apple is a split adjusted 25 cents.
My Rolls will be shown alongside James Bond’s 1964 Aston Martin which sold for $6.3 million, a 1939 Volkswagen Type 64 priced at more than $20 million, and a $13 million 1958 Ferrari 250 GT BBT.
And what am I doing next weekend? Taking the Boy Scouts to the Six Flags roller coaster farm in Vallejo.
Good luck and good trading.
John Thomas
CEO & Publisher
The Diary of a Mad Hedge Fund Trader
My Phantom I
1939 Volkswagen
1954 Ferrari
Global Market Comments
August 14, 2019
Fiat Lux
Featured Trade:
(HOW TO HANDLE THE FRIDAY, AUGUST 16 OPTIONS EXPIRATION),
(CRM), (FB), (M), (VIX)
(SILICON VALLEY REAL ESTATE SAYS THE BULL MARKET IN TECH CONTINUES)
Followers of the Mad Hedge Technology Letter have the good fortune to own three deep in-the-money options position that expires on Friday, August 16, and I just want to explain to the newbies how to best maximize their profits.
This involves the:
the Salesforce (CRM) August 2019 $125-$130 in-the-money vertical BULL CALL spread at $4.50 which will expire at $5.00
the Macy's (M) August 2019 $23-$25 in-the-money vertical BEAR PUT spread at $1.74 which will expire at $2.00
the Facebook (FB) August 2019 $167.50-$172.50 in-the-money vertical BULL CALL spread at $4.50 which will expire at $5.00
The total profit on all three positions will increase the value of our $100,000 model trading portfolio by 3.68%, or $3,680. This position only became possible due to the extreme volatility (VIX) seen in the market in recent weeks.
Provided that we don’t have a monster “RISK OFF” move in the market this week (more failure of the China trade talks? War with Iran? A massacre in Hong Kong?) which causes stocks to collapse and volatility to rocket, these positions should expire at its maximum profit points. So far, so good.
I’ll do the math for you on the Salesforce (CRM) position. Your profit can be calculated as follows:
Profit: $5.00 expiration value - $4.50 cost = $0.50 net profit
(22 contracts X 100 shares per option X $0.50 net profit)
= $1,100 or 11.11% in 7 trading days.
One of the reasons that I run these positions into expiration is that with volatility high, and therefore the implied volatility on the options, we get paid much more to run these into expiration than we have in the past.
Many of you have already emailed me asking what to do with these winning positions.
The answer is very simple. You take your left hand, grab your right wrist, pull it behind your neck, and pat yourself on the back for a job well done.
You don’t have to do anything.
Your broker (are they still called that?) will automatically use your long position to cover your short position, canceling out the total holdings.
The entire profit will be credited to your account on Monday morning August 19 and the margin freed up.
Some firms charge you a modest $10 or $15 fee for performing this service.
If you don’t see the cash show up in your account on Monday, get on the blower immediately and find it.
Although the expiration process is now supposed to be fully automated, mistakes occasionally do occur. Better to sort out any confusion before losses ensue.
If you want to wimp out and close the position before the expiration, it may be expensive to do so. You can probably unload them pennies below their maximum expiration value.
Keep in mind that the liquidity in the options market disappears, and the spreads substantially widen when a security has only hours or minutes until expiration on Friday. So, if you plan to exit, do so well before the final expiration at the Friday market close.
This is known in the trade as the “expiration risk.”
One way or the other, I’m sure you’ll do OK as long as I am looking over your shoulder, as I will be, always. Think of me as your trading guardian angel.
I am going to hang back and wait for good entry points before jumping back in. It’s all about keeping that “Buy low, sell high” thing going.
I’m looking to cherry-pick my new positions going into the next quarter end.
Take your winnings and go out and buy yourself a well-earned dinner. Or use it to put a down payment on a long cruise.
Well done, and on to the next trade.
Global Market Comments
August 12, 2019
Fiat Lux
Featured Trade:
(MARKET OUTLOOK FOR THE WEEK AHEAD, or
(CYB), (FXE), (TLT), (FXY), (COPX), (USO),
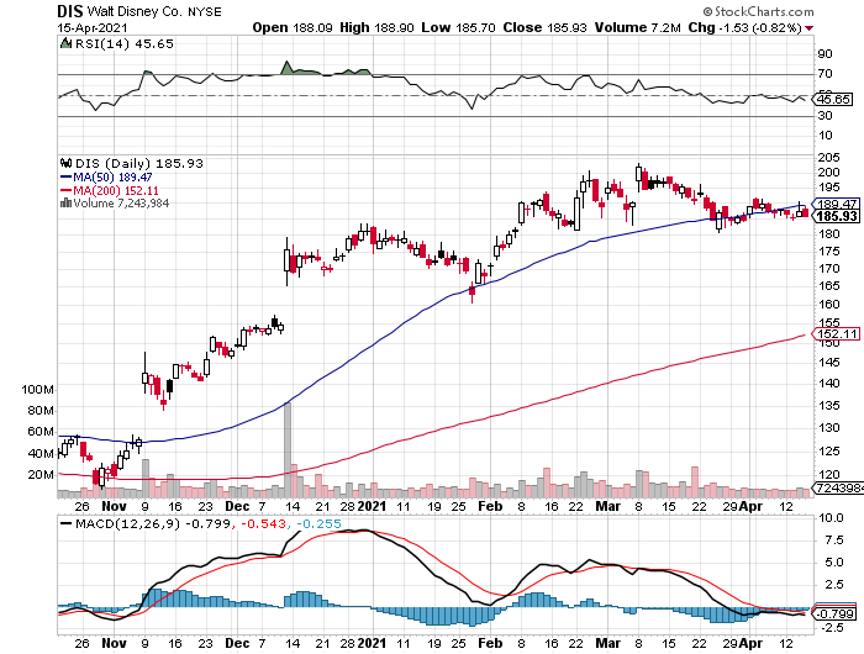
(GLD), (VIX), (FXB), (IWM0, (DIS), (CRB), (FB)
(A COW BASED ECONOMICS LESSON)
Legal Disclaimer
There is a very high degree of risk involved in trading. Past results are not indicative of future returns. MadHedgeFundTrader.com and all individuals affiliated with this site assume no responsibilities for your trading and investment results. The indicators, strategies, columns, articles and all other features are for educational purposes only and should not be construed as investment advice. Information for futures trading observations are obtained from sources believed to be reliable, but we do not warrant its completeness or accuracy, or warrant any results from the use of the information. Your use of the trading observations is entirely at your own risk and it is your sole responsibility to evaluate the accuracy, completeness and usefulness of the information. You must assess the risk of any trade with your broker and make your own independent decisions regarding any securities mentioned herein. Affiliates of MadHedgeFundTrader.com may have a position or effect transactions in the securities described herein (or options thereon) and/or otherwise employ trading strategies that may be consistent or inconsistent with the provided strategies.
This site uses cookies. By continuing to browse the site, you are agreeing to our use of cookies.
OKLearn moreWe may request cookies to be set on your device. We use cookies to let us know when you visit our websites, how you interact with us, to enrich your user experience, and to customize your relationship with our website.
Click on the different category headings to find out more. You can also change some of your preferences. Note that blocking some types of cookies may impact your experience on our websites and the services we are able to offer.
These cookies are strictly necessary to provide you with services available through our website and to use some of its features.
Because these cookies are strictly necessary to deliver the website, refuseing them will have impact how our site functions. You always can block or delete cookies by changing your browser settings and force blocking all cookies on this website. But this will always prompt you to accept/refuse cookies when revisiting our site.
We fully respect if you want to refuse cookies but to avoid asking you again and again kindly allow us to store a cookie for that. You are free to opt out any time or opt in for other cookies to get a better experience. If you refuse cookies we will remove all set cookies in our domain.
We provide you with a list of stored cookies on your computer in our domain so you can check what we stored. Due to security reasons we are not able to show or modify cookies from other domains. You can check these in your browser security settings.
These cookies collect information that is used either in aggregate form to help us understand how our website is being used or how effective our marketing campaigns are, or to help us customize our website and application for you in order to enhance your experience.
If you do not want that we track your visist to our site you can disable tracking in your browser here:
We also use different external services like Google Webfonts, Google Maps, and external Video providers. Since these providers may collect personal data like your IP address we allow you to block them here. Please be aware that this might heavily reduce the functionality and appearance of our site. Changes will take effect once you reload the page.
Google Webfont Settings:
Google Map Settings:
Vimeo and Youtube video embeds: