Global Market Comments
February 5, 2026
Fiat Lux
Featured Trade:
(A REFRESHER COURSE AT SHORT SELLING SCHOOL),
(SH), (SDS), (PSQ), (DOG), (RWM), (SPXU), (AAPL), (TSLA),
(VIX), (VXX), (IPO), (MTUM), (SPHB), (HDGE)
Global Market Comments
February 5, 2026
Fiat Lux
Featured Trade:
(A REFRESHER COURSE AT SHORT SELLING SCHOOL),
(SH), (SDS), (PSQ), (DOG), (RWM), (SPXU), (AAPL), (TSLA),
(VIX), (VXX), (IPO), (MTUM), (SPHB), (HDGE)
Global Market Comments
January 22, 2026
Fiat Lux
Featured Trade:
(FRIDAY, FEBRUARY 13, 2026 ANTARCTICA STRATEGY LUNCHEON)
(A CHEAP HEDGE FOR THIS MARKET),
($VIX), (VXX), (SPY), (GS), (GLD)
Global Market Comments
April 11, 2025
Fiat Lux
SPECIAL VOLATILITY ISSUE
Featured Trade:
(TESTIMONIAL)
(MAKING VOLATILITY YOUR FRIEND),
(VIX), (VXX), (XIV),
(THE ABC’s OF THE VIX),
(VIX), (VXX), (SVXY)


I am one of those cheapskates who buy Christmas ornaments by the bucket load from Costco in January for ten cents on the dollar because my 11-month theoretical return on capital comes close to 1,000%.
I also like buying flood insurance in the middle of the summer drought, when the forecast in California is for endless days of sunshine. That is what we had at the end of July when the (VIX) was plumbing the depths of $12.
Get this one right, and the profits you can realize are spectacular.
It gets better.
If the bottom in volatility exactly coincides with the peak in the stock market that it measures, volatility could be headed back up to the 30% handle, and maybe more.
I double dare you to look at the charts below and tell me this isn’t happening.
Watch carefully for other confirming trends to affirm this trade is unfolding. Those would include a strong dollar, and a weak Japanese yen, Euro, and rising fixed-income instruments of any kind.
Notice that every one of these is happening this week!
Reversion to the mean, anyone?
You may know of this from the many clueless talking heads, beginners, and newbies who call (VIX) the “Fear Index”.
For those of you who have a PhD in higher mathematics from MIT, the (VIX) is simply a weighted blend of prices for a range of option contracts on the S&P 500 index (SPX).
The formula uses a kernel-smoothed estimator that takes as inputs the current market prices for all out-of-the-money calls and puts for the front-month and second-month expirations.
The (VIX) is the square root of the par variance swap rate for a 30-day term initiated today. To get into the pricing of the individual options, please go look up your handy dandy and ever-useful Black-Scholes equation.
You will recall that this is the equation that derives from the Brownian motion of heat transference in metals. Got all that?
For the rest of you who do not possess a PhD in higher mathematics from MIT, and maybe scored a 450 on your math SAT test, or who don’t know what an SAT test is, this is what you need to know.
When the market goes up, the (VIX goes down. When the market goes down, the (VIX) goes up. Period. End of story. Class dismissed.
The (VIX) is expressed in terms of the annualized monthly movement in the S&P 500 (SPX) which, with the (VIX) today at $10, is at $72.54.
So for example, a (VIX) of $10 means that the market expects the index to move 2.89%, or $72.54 S&P 500 points, over the next 30 days.
You get this by calculating $10/3.46 = 2.89%, where the square root of 12 months is 3.46.
The volatility index doesn’t really care which way the stock index moves. If the S&P 500 moves more than the projected 2.89% in ANY direction, you make a profit on your long (VIX) positions.
I am going into this detail because I always get a million questions whenever I raise this subject with volatility-deprived investors.
It gets better.
Futures contracts began trading on the (VIX) in 2004, and options on the futures since 2006.
Since then, these instruments have provided a vital means through which hedge funds control risk in their portfolios, thus providing the “hedge” in hedge fund.

Global Market Comments
April 8, 2025
Fiat Lux
Featured Trade:
(A REFRESHER COURSE AT SHORT SELLING SCHOOL),
(SH), (SDS), (PSQ), (DOG), (RWM), (SPXU), (AAPL), (TSLA),
(VIX), (VXX), (IPO), (MTUM), (SPHB), (HDGE)
Global Market Comments
March 6, 2025
Fiat Lux
Featured Trade:
(A REFRESHER COURSE AT SHORT SELLING SCHOOL),
(SH), (SDS), (PSQ), (DOG), (RWM), (SPXU), (AAPL), (TSLA),
(VIX), (VXX), (IPO), (MTUM), (SPHB), (HDGE)

Some asset classes are reflecting the fact that we are already in a full-blown recession, while others are not. In case I am wrong and we DO go into a recession, knowing how to sell short stocks will be a handy skill to have.
It will become essential to be knowledgeable about all the different ways to add downside protection.
While you are all experts in buying stocks, selling them short is another kettle of fish.
I, therefore, think it is timely to review how to make money when prices are falling. I call it Short Selling School 101.
I don’t think we are going to crash to new lows from here, maybe drop only 10% at worst. So some of the most aggressive bearish strategies described below won’t be appropriate.
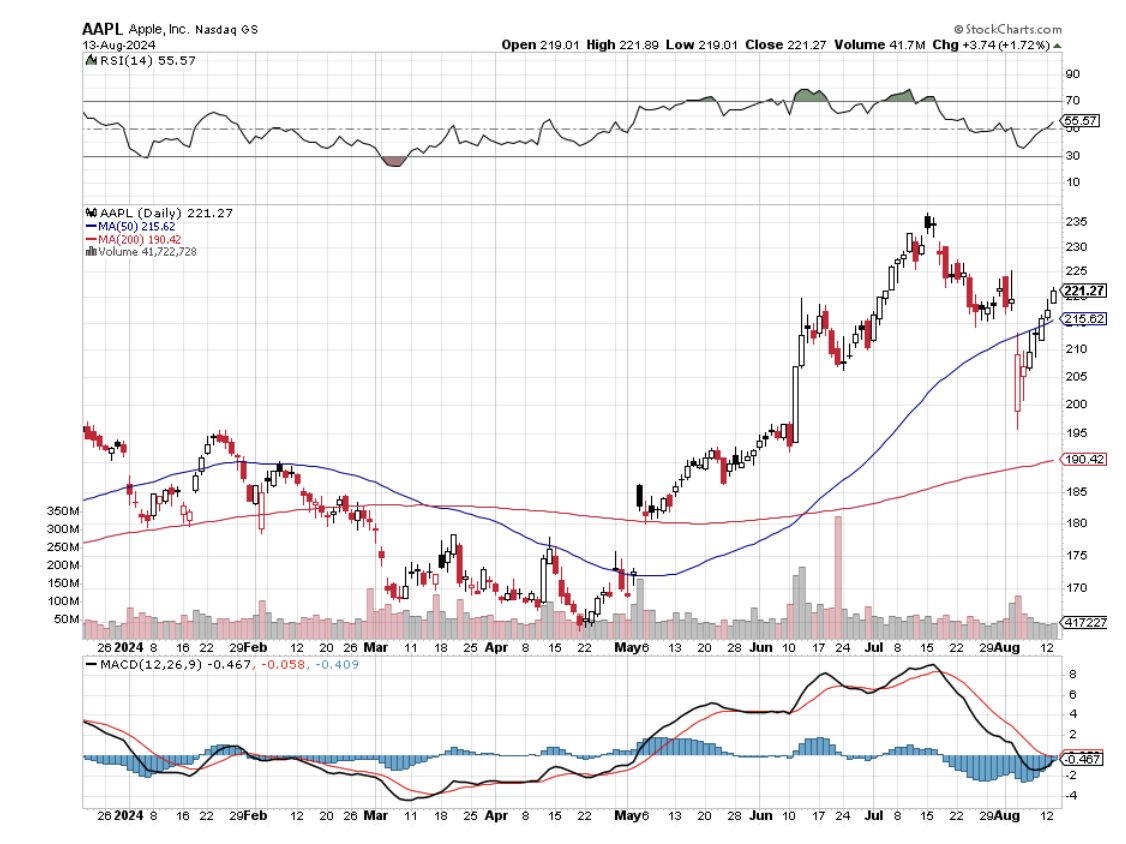
If you have big positions in single stocks, like Apple (AAPL), you can execute the same kind of strategy. Selling short the Apple call options to hedge an existing long in the stock looks like the no-brainer here. You should sell one option contract for every 100 shares you own.
There is nothing worse than closing the barn door after the horses have bolted or hedging after markets have crashed.
No doubt, you will receive a wealth of short-selling and hedging ideas from your other research sources and the media right at the next market bottom.
That is always how it seems to play out, great closing the barn doors after the horses have bolted.
So I am going to get you out ahead of the curve, putting you through a refresher course on how to best trade falling markets now, while stock prices are still rich.
I’m not saying that you should sell short the market right here. But there will come a time when you will need to do so.
Watch my Trade Alerts for the best market timing. So here are the best ways to profit from declining stock prices, broken down by security type:
Bear ETFs
Of course, the granddaddy of them all is the ProShares Short S&P 500 Fund (SH), a non-leveraged bear ETF that is supposed to match the fall in the S&P 500 point for point on the downside. Hence, a 10% decline in the (SPY) is supposed to generate a 10% gain in the (SH).
In actual practice, it doesn’t work out like that. The ITF has to pay management operating fees and expenses, which can be substantial. After all, nobody works for free.
There is also the “cost of carry,” whereby owners have to pay the price for borrowing and selling short shares. They are also liable for paying the quarterly dividends for the shares they have borrowed, around 2% a year. And then you have to pay the commissions and spread for buying the ETF.
Still, individuals can protect themselves from downside exposure in their core portfolios by buying the (SH) against it (click here for the prospectus). Short-selling is not cheap. But it’s better than watching your gains of the past seven years go up in smoke.
Virtually all equity indexes now have bear ETFs. Some of the favorites include the (PSQ), a short play on the NASDAQ (click here for the prospectus ), and the (DOG), which profits from a plunging Dow Average (click here for the prospectus).
My favorite is the (RWM) a short play on the Russell 2000, which falls 1.5X faster than the big cap indexes in bear markets (click here for the prospectus).
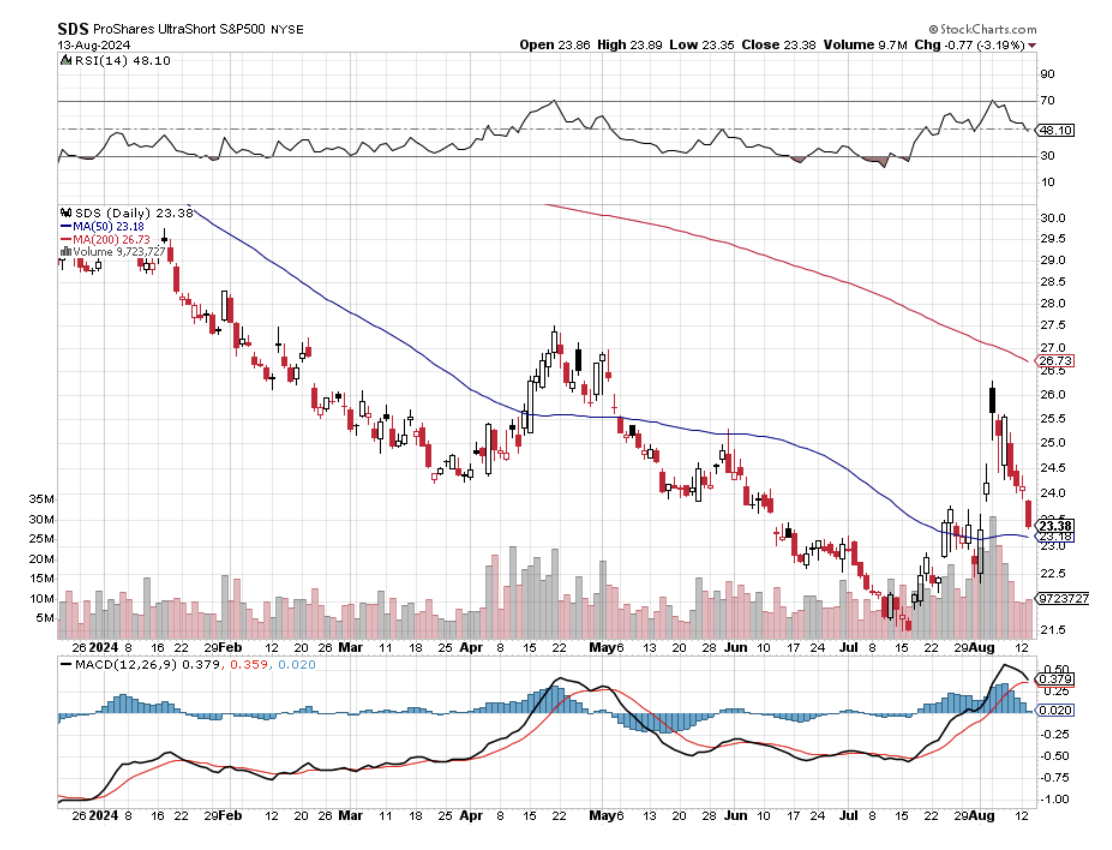
Leveraged Bear ETFs
My favorite is the ProShares Ultra Short S&P 500 (SDS), a 2X leveraged ETF (click here for the prospectus). A 10% decline in the (SPY) generates a 20% profit, maybe.
Keep in mind that by shorting double the market, you are liable for double the cost of shorting, which can total 5% a year or more. This shows up over time in the tracking error against the underlying index. Therefore, you should date, not marry, this ETF, or you might be disappointed.
3X Leveraged Bear ETF
The 3X bear ETFs, like the UltraPro Short S&P 500 (SPXU), are to be avoided like the plague (click here for the prospectus).
First, you have to be pretty good to cover the 8% cost of carry embedded in this fund. They also reset the amount of index they are short at the end of each day, creating an enormous tracking error.
Eventually, they all go to zero and have to be periodically redenominated to keep from doing so. Dealing spreads can be very wide, further adding to costs.
Yes, I know the charts can be tempting. Leave these for the professional hedge fund intraday traders for which they are meant.
Buying Put Options
For a small amount of capital, you can buy a ton of downside protection. For example, the April (SPY) $182 puts I bought for $4,872 on Thursday allows me to sell short $145,600 worth of large cap stocks at $182 (8 X 100 X $6.09).
Go for distant maturities out several months to minimize time decay and damp down daily price volatility. Your market timing better be good with these because when the market goes against you, put options can go poof and disappear pretty quickly.
That’s why you are reading this newsletter.
Selling Call Options
One of the lowest risk ways to coin it in a market heading south is to engage in “buy writes.” This involves selling short call options against stock you already own but may not want to sell for tax or other reasons.
If the market goes sideways or falls, and the options expire worthless, then the average cost of your shares is effectively lowered. If the shares rise substantially, they get called away, but at a higher price, so you make more money. Then you just buy them back on the next dip. It is a win-win-win.
Selling Futures
This is what the pros do, as futures contracts trade on countless exchanges around the world for every conceivable stock index or commodity. It is easy to hedge out all of the risk for an entire portfolio of shares by simply selling short futures contracts for a stock index.
For example, let’s say you have a portfolio of predominantly large-cap stocks worth $100,000. If you sell short 1 September 2021 contract for the S&P 500 against it, you will eliminate most of the potential losses for your portfolio in a falling market.
The margin requirement for one contract is only $5,000. However, if you are short the futures and the market rises, then you have a big problem, and the losses can prove ruinous.
But most individuals are not set up to trade futures. The educational, financial, and disclosure requirements are beyond mom-and-pop investing for their retirement fund.
Most 401Ks and IRAs don’t permit the inclusion of futures contracts. Only 25% of the readers of this letter trade the futures market. Regulators do whatever they can to keep the uninitiated and untrained away from this instrument.
That said, get the futures markets right, and is the quickest way to make a fortune if your market direction is correct.
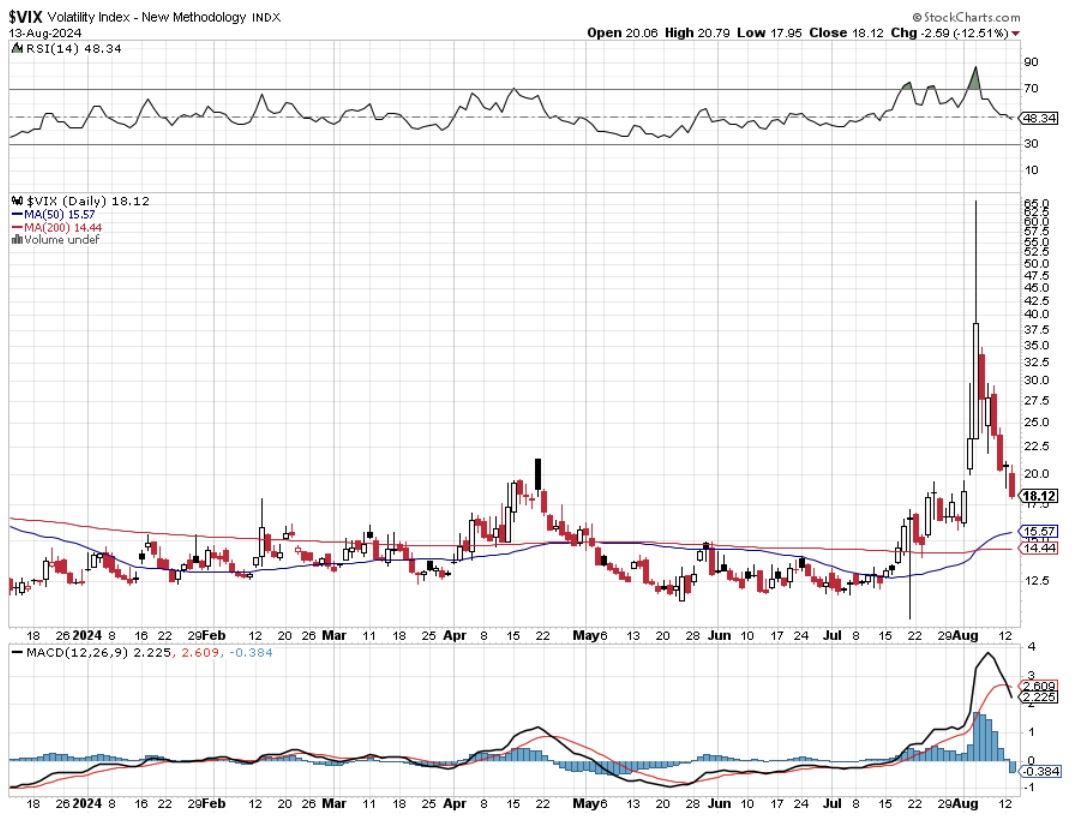
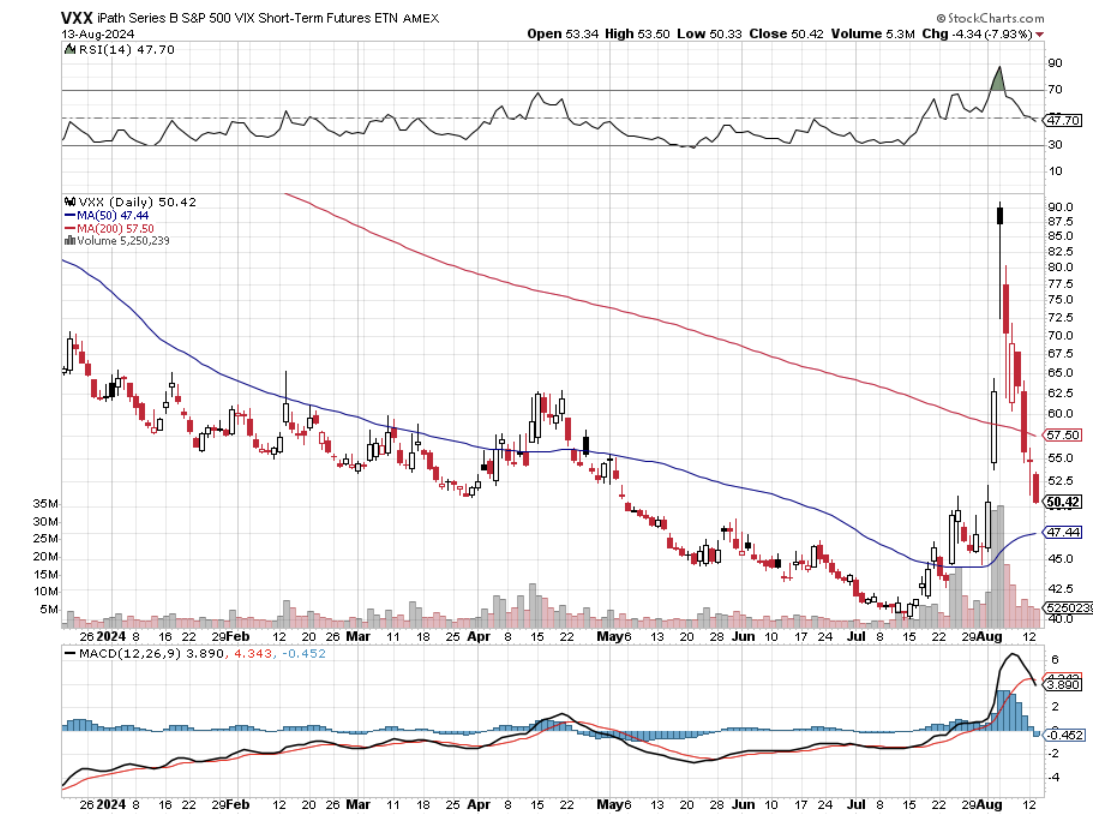
Buying Volatility
Volatility (VIX) is a mathematical construct derived from how much the S&P 500 moves over the next 30 days. You can gain exposure to it by buying the iPath S&P 500 VIX Short-Term Futures ETN (VXX) or buying call and put options on the (VIX) itself.
If markets fall, volatility rises, and if markets rise, then volatility falls. You can, therefore, protect a stock portfolio from losses through buying the (VIX).
I have written endlessly about the (VIX) and its implications over the years. For my latest in-depth piece with all the bells and whistles, please read “Buy Flood Insurance With the (VIX)” by clicking here.
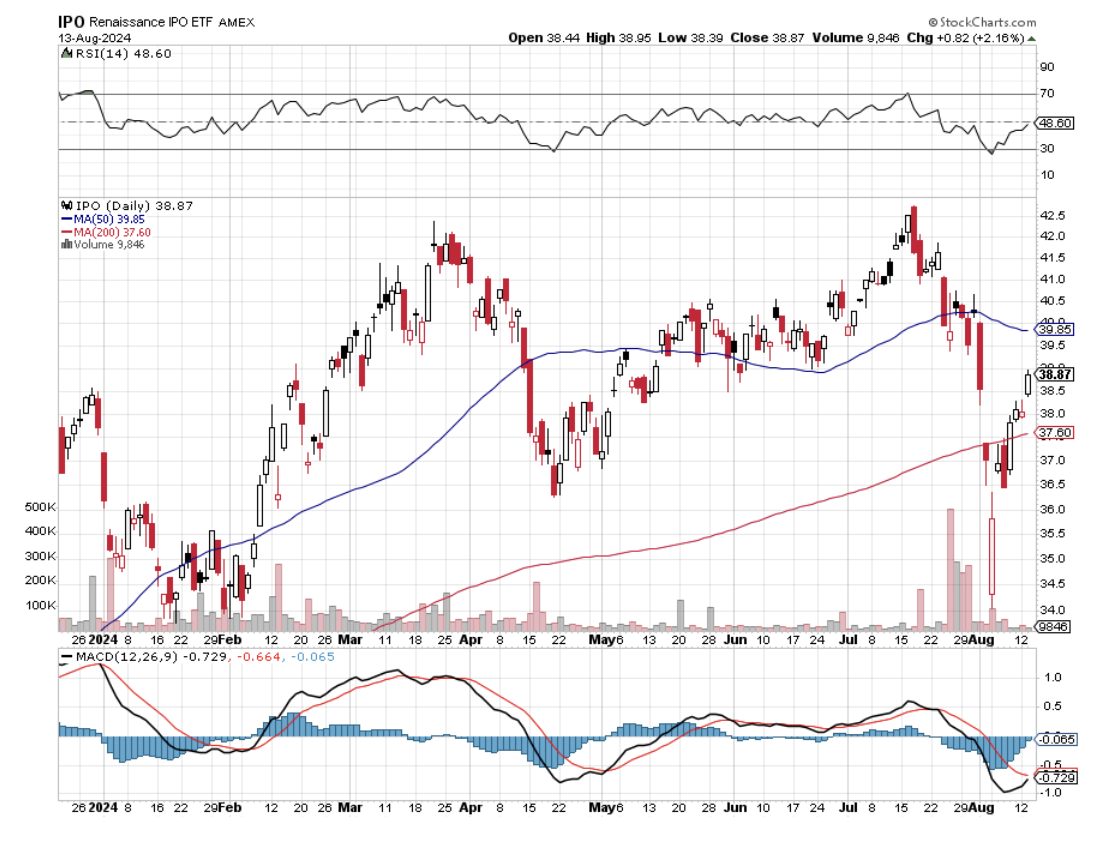
Selling Short IPOs
Another way to make money in a down market is to sell short recent initial public offerings. These tend to go down much faster than the main market. That’s because many are held by hot hands, known as “flippers,” don’t have a broad institutional shareholder base.
Many of the recent ones don’t make money and are based on an as-yet unproven business model. These are the ones that take the biggest hits.
Individual IPO stocks can be tough to follow to sell short. But one ETF has done the heavy lifting for you. This is the Renaissance IPO ETF (click here for the prospectus). As you can tell from the chart below, (IPO) was warning that trouble was headed our way since the beginning of March. So far, a 6% drop in the main indexes has generated a 20% fall in (IPO).
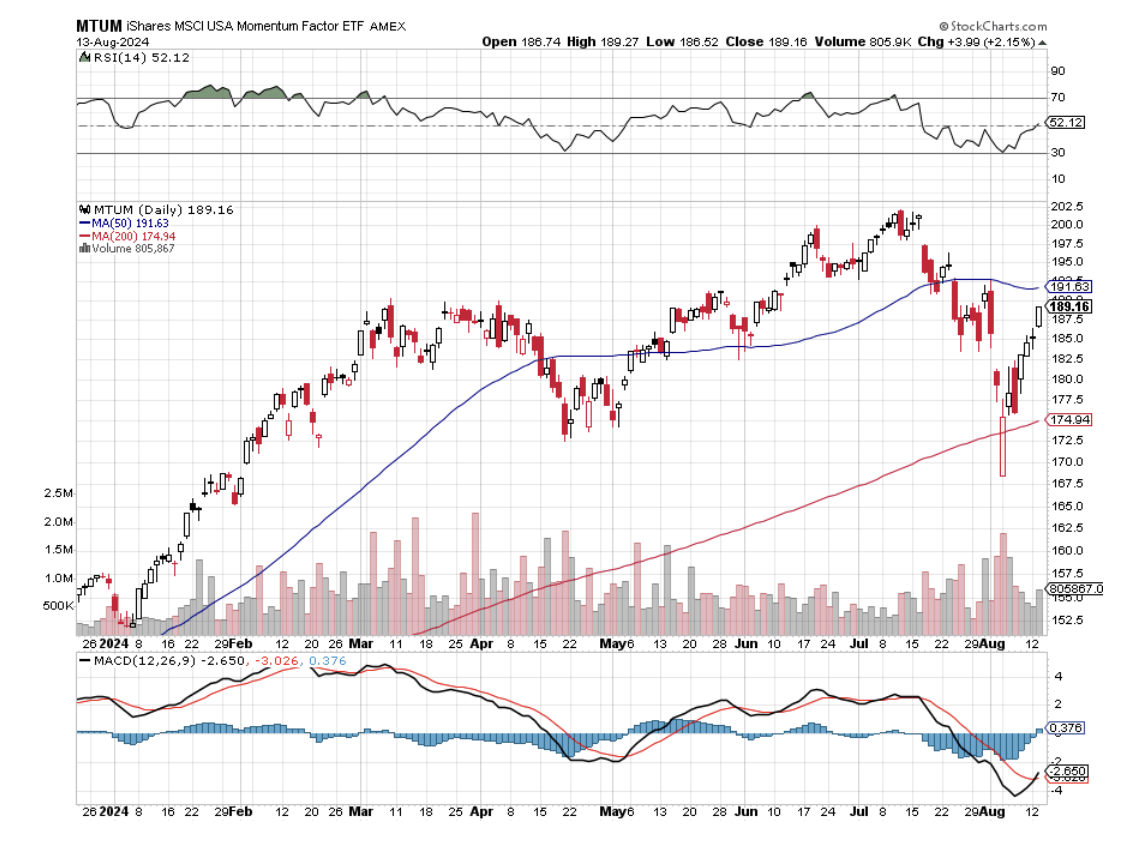
Buying Momentum
This is another mathematical creation based on the number of rising days over falling days. Rising markets bring increasing momentum, while falling markets produce falling momentum.
So, selling short momentum produces additional protection during the early stages of a bear market. Blackrock has issued a tailor-made ETF to capture just this kind of move through its iShares MSCI Momentum Factor ETF (MTUM). To learn more, please read the prospectus by clicking here.
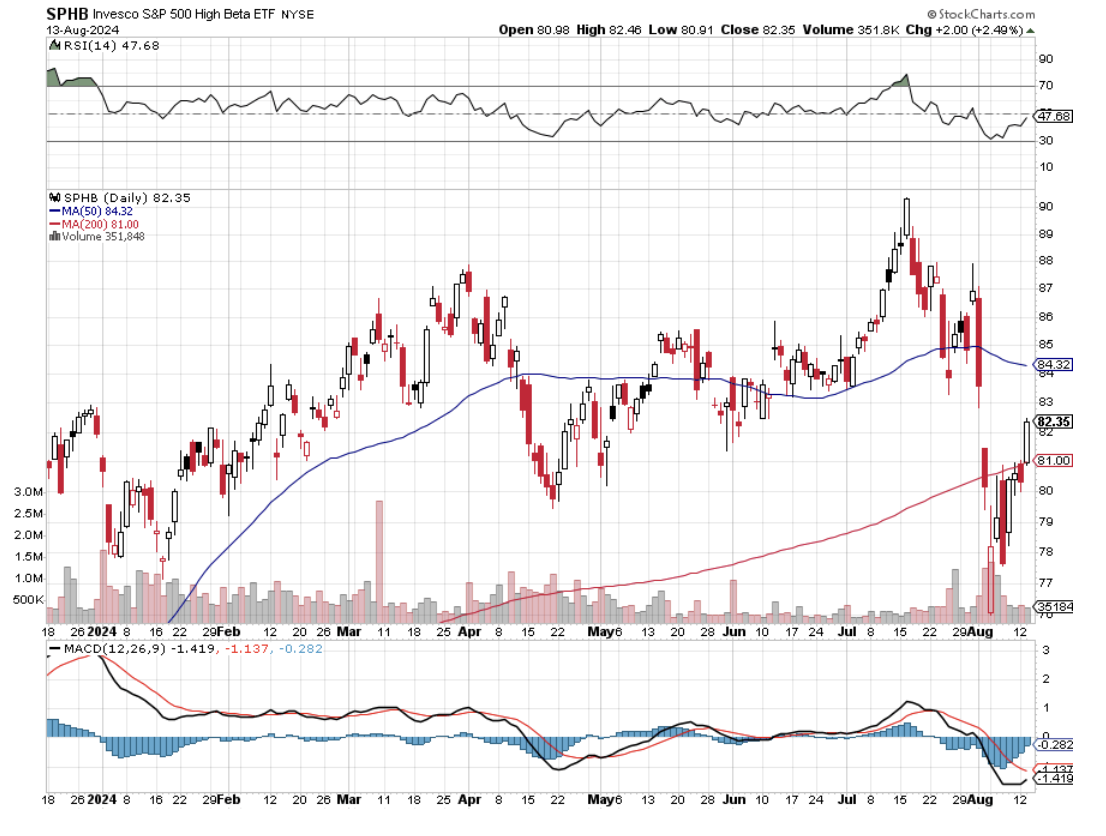
Buying Beta
Beta, or the magnitude of share price movements, also declines in down markets. So, selling short beta provides yet another form of indirect insurance. The PowerShares S&P 500 High Beta Portfolio ETF (SPHB) is another niche product that captures this relationship.
The Index is compiled, maintained, and calculated by Standard & Poor's and consists of the 100 stocks from the (SPX) with the highest sensitivity to market movements, or beta, over the past 12 months.
The Fund and the Index are rebalanced and reconstituted quarterly in February, May, August, and November. To learn more, read the prospectus by clicking here.
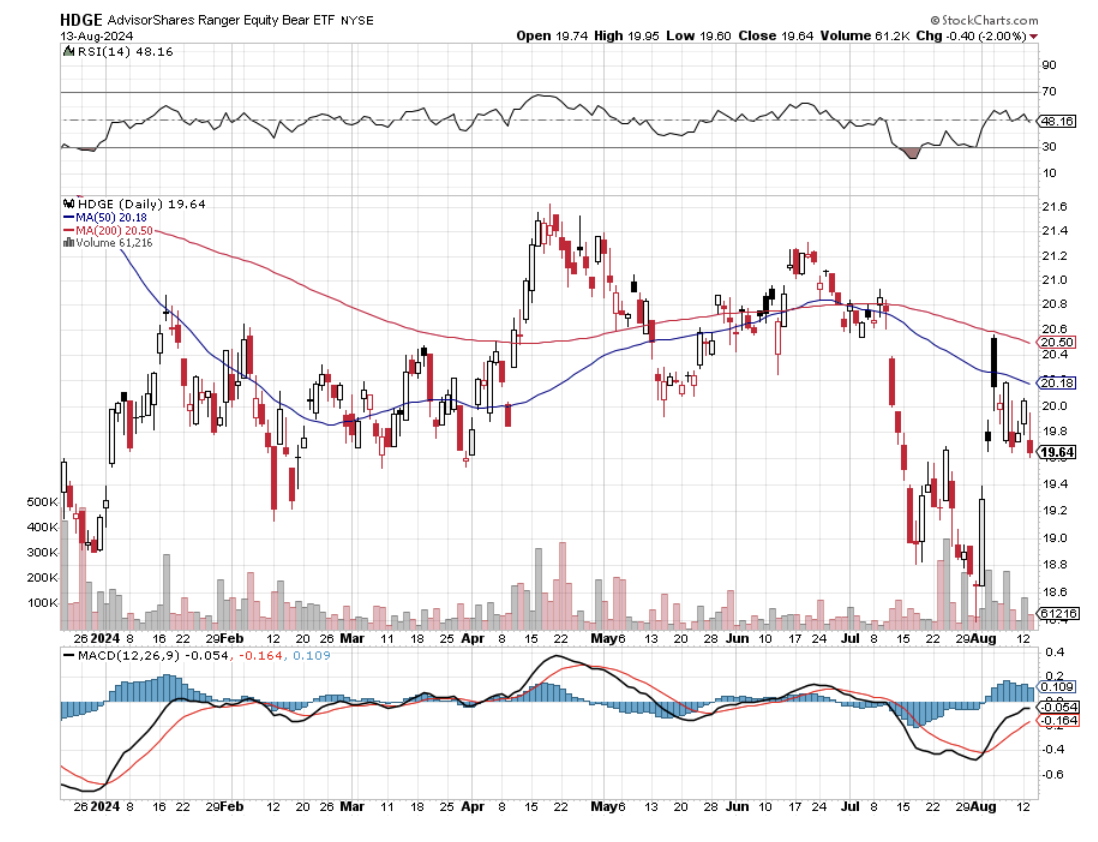
Buying Bearish Hedge Funds
Another subsector that does well in plunging markets is publicly listed bearish hedge funds. There are a couple of these that are publicly listed and have already started to move.
One is the Advisor Shares Active Bear ETF (HDGE) (click here for the prospectus). Keep in mind that this is an actively managed fund, not an index or mathematical relationship, so the volatility could be large.

Oops, Forgot to Hedge
Global Market Comments
February 13, 2025
Fiat Lux
Featured Trade:
(REVISITING THE GREAT DEPRESSION),
(EXPLORING MY NEW YORK ROOTS)

Global Market Comments
February 12, 2025
Fiat Lux
Featured Trade:
(THE ABC’s OF THE VIX),
(VIX), (VXX), (SVXY)
Global Market Comments
February 11, 2025
Fiat Lux
SPECIAL VOLATILITY ISSUE
Featured Trade:
(TESTIMONIAL)
(MAKING VOLATILITY YOUR FRIEND),
(VIX), (VXX), (XIV)
