Mad Hedge Technology Letter
June 22, 2020
Fiat Lux
Featured Trade:
(IS ROKU BREAKING OUT?)
(ROKU)
Mad Hedge Technology Letter
June 22, 2020
Fiat Lux
Featured Trade:
(IS ROKU BREAKING OUT?)
(ROKU)
Roku (ROKU) is another tech growth stock that is a conviction buy in my eyes.
Never sell this company if you plan to be in this long term.
The only way a sell would make sense is if digital ads stopped existing or Roku’s platform somehow managed to blackball itself out of the digital ad landscape.
Both scenarios are highly unlikely.
What does Roku actually do?
This is the company that is single-handedly destroying linear television and is laughing all the way to the bank – or at least the shareholders are.
Roku is a leader in advertising-supported video-on-demand streaming services.
In layman’s terms, they basically run commercials on its own Roku Channel and other third-party channels.
A minor part of their business is involved in making set-top boxes and streaming sticks to plug into internet video services such as Netflix and Hulu.
Plus, it sells licenses to an operating system that is thrown up smart TVs.
To beef up its products and move up in the quality food chain, the streaming platform outperformer Roku (ROKU) has agreed to a data exchange agreement with supermarket giant Kroger (KR).
Roku will apply data from the supermarket chain in its recently launched shopper data program.
The tech firm will finally get a peek deep inside the psyche of the American consumer.
I also believe this is the beginning of a massive wave of data-sharing partnerships as companies desire to understand their consumers deeper at a time when the coronavirus shut their consumers inside their house with nowhere to go.
So, how will Roku parlay this partnership into more revenue?
As people cord cut, the main goal is to seduce advertisers away from linear TV.
Juicing up its targeting abilities by using Kroger’s leading data science KPM (Kroger Precision Marketing) program, Roku will be able to move closer to the customer’s digital wallet enabling them to anticipate what they buy and how much of it they want.
The ads will be pricier because Roku will be able to hyper-target specific audiences due to a higher quality set of data they will have to work with.
From the CPG marketers’ perspective, supermarket brands will apply the data from Kroger’s KPM platform to better target the approximately 40 million and growing households using Roku, thus enabling them to better gauge which ads viewers are more likely to respond to.
Kroger will be able to understand more about their audience by assessing what commercials they consume and how they can adjust and expand their supply of goods to better capture the demand of their shoppers.
Getting more bang for their buck is a winning strategy for Roku as they delve deep into the mystical art of artificial intelligence to offer a better ad funnel.
Kroger Precision Marketing (KPM) spans 60 million US households which is not shabby itself. Marrying the 60 million with the 40 million to create a 100 million data analytics treasury trove means that Roku has just become 20% more valuable in a blink of an eye.
Roku's international growth could experience the same type of meteoric rise as what Netflix had.
If Roku can accumulate 82 million active accounts by 2025, it should have $4.5 billion in annual platform revenue.
This would mean that Roku's market cap would be around $40 billion to $50 billion in 2025. Its current market value is about $16.5 billion.
Roku still has its share of headwinds and are still loss-making.
The company reported a 45-cent loss per share for the first quarter, in-line with analyst expectations and revenue of $321 million beating the estimates by $13 million.
Since the company is still a “growth” company, investors still look through the losses to glorify growth, and Roku reporting 39.8 million active accounts, up 37% from a year ago, means they are on track.
Another concern is the higher-than-normal number of cancellations in the short-term even though its long-term runway is still solid.
However, I would say the biggest problem Roku faces is that the stock is just too hot pricing around many investors looking to put new money to work in shares.
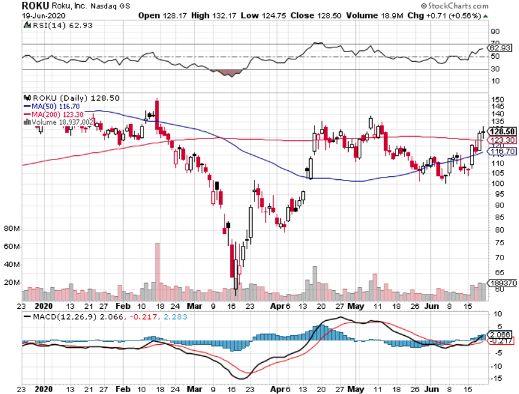
The stock has doubled since the March lows.
In short, unless the government bans digital ads, Roku is poised to harvest the lion’s share of the spoils of the streaming revolution.
I am highly bullish on Roku shares.
Mad Hedge Technology Letter
June 19, 2020
Fiat Lux
Featured Trade:
(BET THE RANCH ON SQUARE),
(SQ), (XRT)

Square (SQ) is one of those fintech companies that you buy and never sell.
The company’s recent stock performance has eclipsed many of the other cloud stocks that have done almost as well.
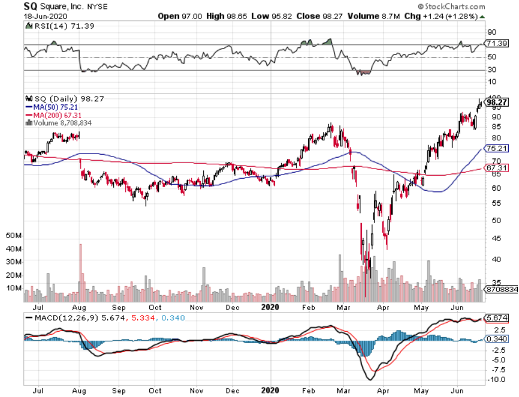
Shares of Square are up from the March lows of $36 and now trading a smidgeon below $100.
It is just a matter of time before the stock breaks $100 and this company is easily a $200 stock in the future.
Let us look at the reasons why shares have rebounded with extra zeal from the nadir.
First, they are an overwhelming recipient of the “re-opening” trade which is in full effect even with a reboot of coronavirus cases in the U.S.
The government has been adamant that there is only a way forward and not backwards - shutting down the economy again is not an option.
With people out of their houses, data points are up from zero like May’s retail sales numbers showing a sharp rise of 18% month on month. The SPDR S&P Retail ETF (XRT) is up 2.4%.
Square is a fintech payment service provider among other things and their addressable market worth $160 billion is expanding and they are perfectly positioned for sustained expansion in the years ahead.
The digitization of the economy has played into Square's hands and the pandemic has acted like a supercharger to a trend: the steady migration of most everyday banking activities to mobile apps and online portals.
Why is Square a legitimate long-term threat to the traditional banking system?
Square has siphoned accounts from banks and add up to 14 million in total including customers who direct deposited their stimulus checks and/or tax refunds and not necessarily their paychecks.
Square Capital’s 75,000 PPP borrowers give Square real skin in the game and combined with a growing base of larger merchants, intimate knowledge of their revenue flows, Square will win a good amount of new small business loan activity.
Its small business loan portfolio is already approximately 75,000 loans and were facilitated during the quarter with a total value of $548 million - an increase of 8% year-over-year.
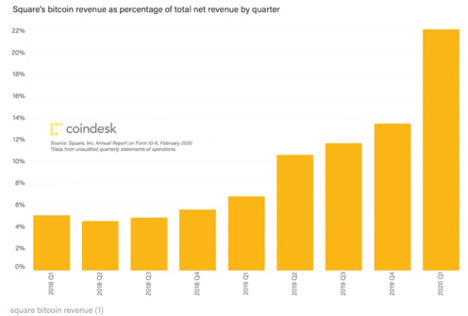
One of Square’s massive growth drivers is its accessibility to buying bitcoin and the commission of payments on the Cash app.
Square’s bitcoin revenue now accounts for 22% of total quarterly revenue.
In Q1, Cash App gross profit grew 115% year over year and gross profit on Cash App is dominated by Square’s $222 million in non-bitcoin revenue, $178 million of that was profit.
The bad news is already behind the fintech companies with the post-pandemic which saw Square’s payment volume crater 39% last month.
Even with such terrible data, Square still posted a positive earnings report with revenue for the quarter up 44% year-over-year. Gross Payment Value (GPV) was up 14% year-over-year. Gross profit was up 36% year-over-year.
Square also offers an online retail capability with Square Online Store, which competes with Shopify.
The company is a hotbed of new fintech innovation rolling out new products every quarter.
If a new product fails, management is quick to put out the flames and try something new.
They are not just a one-trick pony like Facebook and are one of Silicon Valley’s true innovation firms.
It is refreshing to see a company led with a bold CEO in Jack Dorsey who isn’t 99% marketing and 1% substance like many who make the decisions at these ultra-powerful firms.
Volatility in this stock makes this a terrible stock to trade – 6% down days are common.
Buy this stock and it will no doubt cross $200 in the next 3 years.
Global Market Comments
November 2, 2018
Fiat Lux
Featured Trade:
(OCTOBER 31 BIWEEKLY STRATEGY WEBINAR Q&A),
(EDIT), (TMO), (OVAS), (GE), (GLD), (AMZN), (SQ), (VIX), (VXX), (GS), (MSFT), (PIN), (UUP), (XRT), (AMD), (TLT)
Below please find subscribers’ Q&A for the Mad Hedge Fund Trader October 31 Global Strategy Webinar with my guest and co-host Bill Davis of the Mad Day Trader.
As usual, every asset class long and short was covered. You are certainly an inquisitive lot, and keep those questions coming!
Q: I would like to keep CRISPR stocks as a one or two-year-old, or even longer if it is prudent. What do you think?
A: Yes, there is a CRISPR revolution going on in biotech—I’m extremely bullish on all these stocks, like Editas Medicine (EDIT), Thermo Fisher Scientific (TMO), and Ovascience Inc. (OVAS). If any of these individual companies don’t move forward with their own technology, they will get taken over. The principal asset of these companies is not the patents or the products, it’s the staff, and there is an extreme shortage in CRISPR specialists (and anybody who knows anything about monoclonal antibodies).
Q: Could you explain how to manage LEAPs? For example, the Gold (GLD) and the General Electric (GE) LEAPs. Sit and leave them or trade them short term?
A: You make a lot of money trading long-term LEAPs. Just because you own a year and a half LEAP doesn’t mean that you keep it for a year and a half. You sell it on the first big profit, and I happen to know that on both the Gold (GLD) and the (GE) LEAPs we sent out, people made a 50% profit in the first week. So, I told them: sell it, take the profit. The market always gives you another chance to get in and buy them cheap. You make the money on the turnover, on the volume—not hanging out trying to hit a home run.
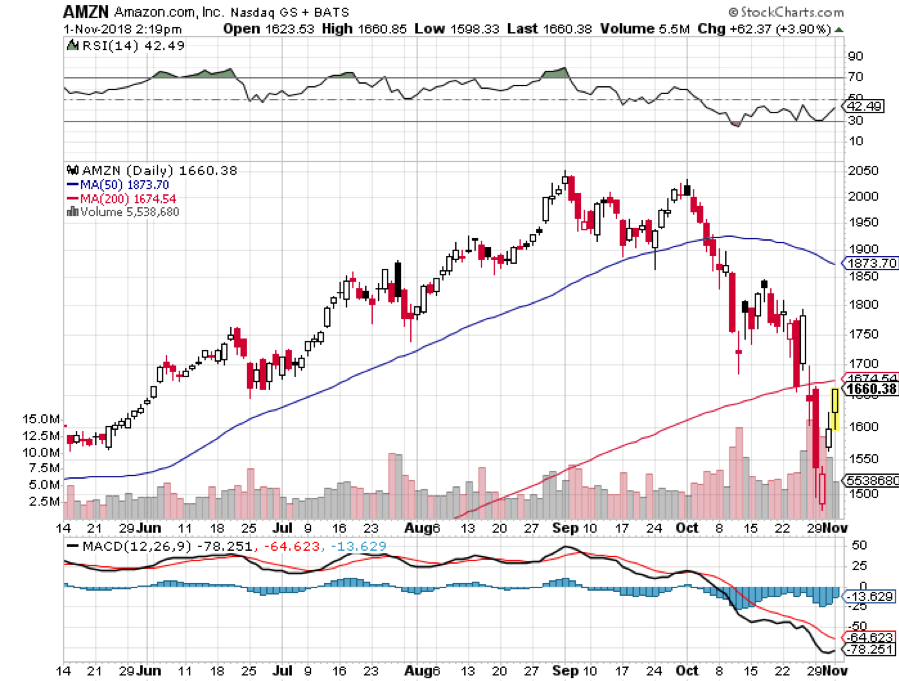
Q: Why did you only close the Amazon (AMZN) November $1,550-$1,600 vertical bull call spread and not roll the strike prices down and out?
A: Well I actually did do the down and out strike roll out first, which is the super aggressive approach. By adding the November $1,350-$1,400 vertical bull call spread position on Monday at the market lows and doubling the size—we took a huge 30% position in Amazon and that position alone should bring in about $3600 in profits in two weeks, at expiration. And when I put on that second position I told myself that on the next big rally I would get out of the high-risk trouble making position, which was the November $1,550-$1,600 vertical bull call spread. So that’s how you trade your way out of a 30% drop in three weeks in one of the best tech stocks in the market.
Q: Is AT&T (T) no longer a good buy at these prices?
A: All of the telephone companies have legacy technology, meaning they are all dying. Basically, AT&T is about owning a bunch of rusting copper wire spread around the country. They haven’t been able to innovate new technologies fast enough to keep up with others who have. The only reason to own this is for the very high 6.56% dividend. That said, dividends can be cut. Look at General Electric which cut its dividend earlier this year. Whatever you make of the dividend can get lost in the principal.
Q: Do you think Square (SQ) is a good buy at this level?
A: Absolutely, it’s a screaming buy. It’s one of the favorite companies of the Mad Hedge Technology Letter and one of the preeminent disruptors of the banks. We think there’s another 400% gain in Square from here. It’s dominating FinTech now.
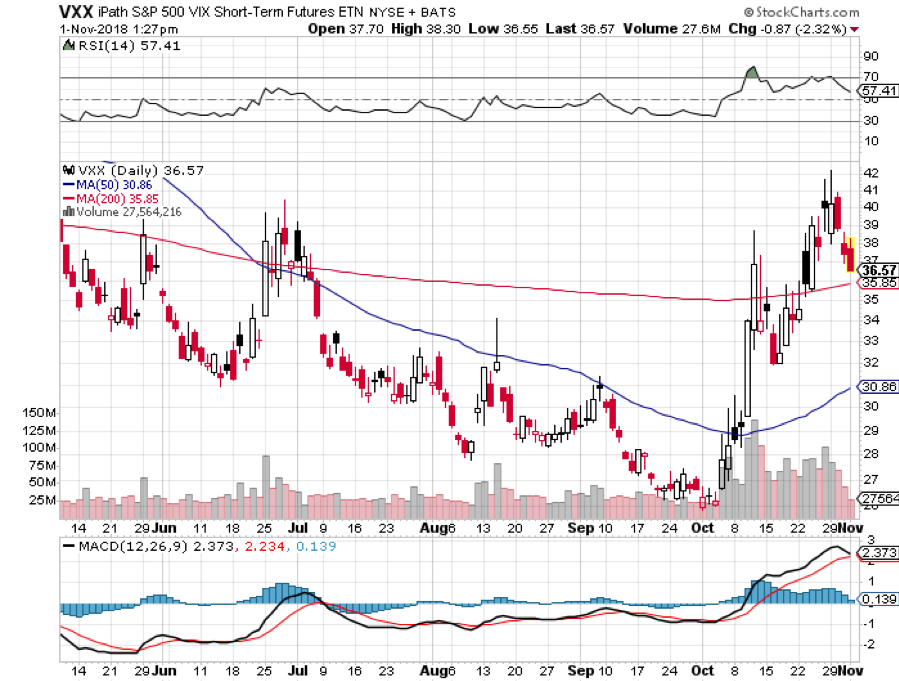
Q: When do you expect to close the short position in the iPath S&P 500 VIX Short-Term Futures ETN (VXX)?
A: If we can get the Volatility Index (VIX) down to $15, the (VXX) should crater. We’ll take a hit on the time decay and that’s why I say we may be able to sell it for 20 cents in the future when this happens. We’ll still take a 50% hit on the position, but half is better than none.
Q: What happened to Microsoft (MSFT) last week?
A: People sold their winners. They had a great earnings report and great long-term earnings prospects, but everyone in the world owned it. Buy the long-term LEAP on this one.
Q: If we want to double up on the iPath S&P 500 VIX Short-Term Futures ETN (VXX), how do you plan to do it?
A: Go out to further with your expiration date. When you go long the (VXX) you only buy the most distant expiration date. I would buy the February 15 expiration as soon as it becomes available.
Q: How do you see Goldman Sachs (GS) from here to the end of the year?
A: It may go up a little bit as we get some index money coming into play for year-end, but not much; I expect banks to continue to underperform. They are no longer a rising interest rate play. They are a destruction by FinTech play.
Q: Is it too soon for emerging markets in India (PIN)?
A: As long as the dollar (UUP) is strong, which is going to be at least another year, you want to avoid emerging markets like the plague. As long as the Federal Reserve keeps raising interest rates, increasing the yield differential with other currencies, the buck keeps going up.
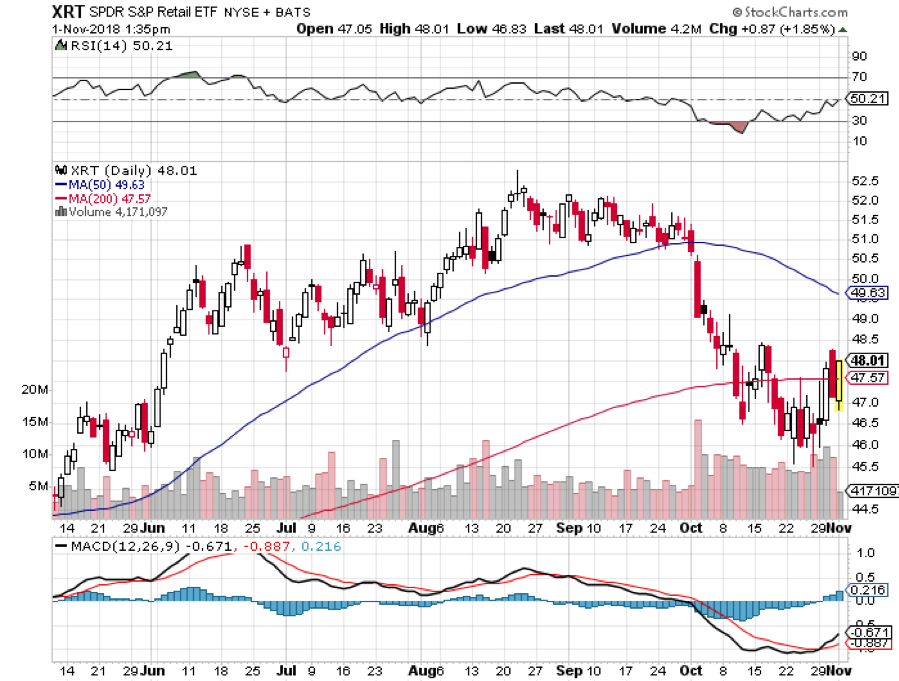
Q: What are your thoughts on retail ETFs like the SPDR S&P Retail ETF (XRT)?
A: You may get lucky and catch a rally on that but the medium term move for retail anything is down. They are all getting Amazoned.
Q: Is it better to increase long exposure the day before the election?
A: No, what we saw starting on Tuesday was the pre-election move. That said, I expect it to continue after the election and into yearend.
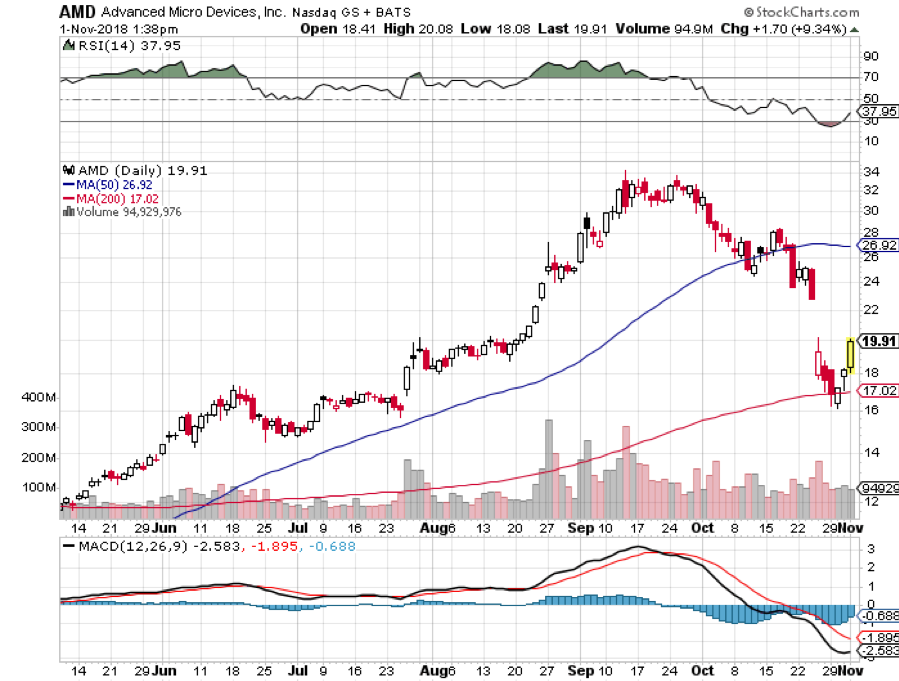
Q: Any opinions on Advanced Micro Devices (AMD)?
A: Yes, this is a great level. It was extremely overbought two months ago but has now dropped 50%. It is a great long-term LEAP candidate.
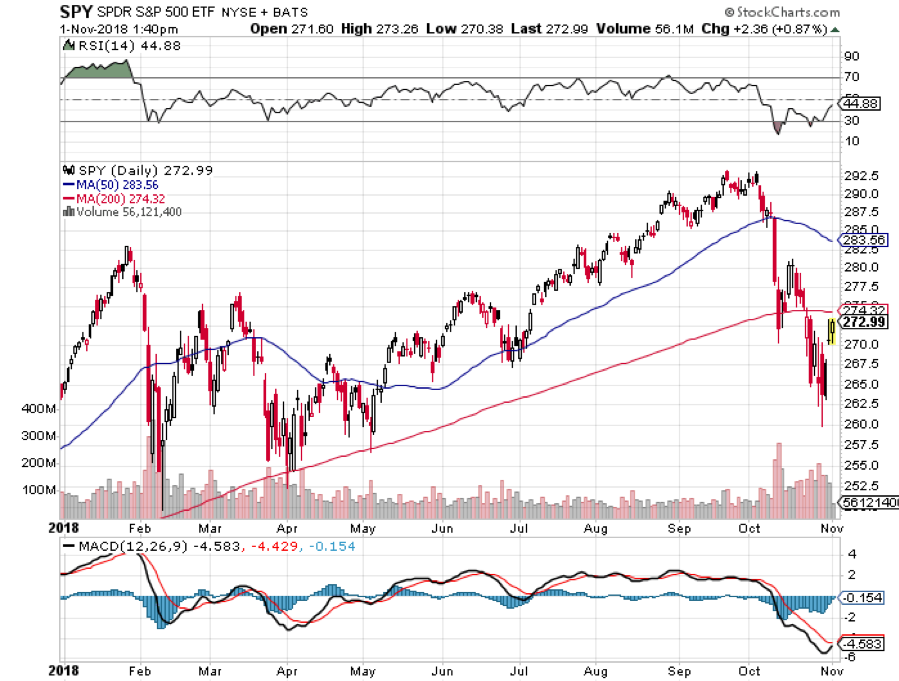
Q: What about the W bottom in the stock market that everyone thinks will happen?
A: I’m one of those people. So far, the bottom for the move in the S&P 500 is looking pretty convincing, but we will test the faith sometime in the next week I’m sure. We got close enough to the February $252 low to make this a very convincing move. It sets up range trading for the market for the next year.
Q: How do you figure the inflation rate is 3.1%?
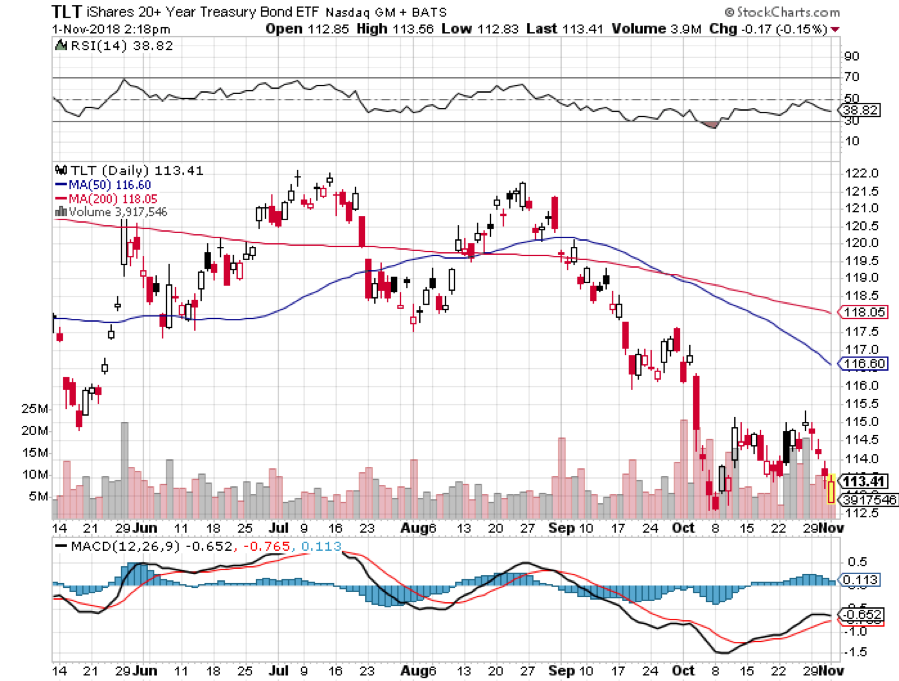
A: The year-on-year Consumer Price Index for September printed at 2.3%, and the most recent months have been running at an annualized 2.9% rate. Given that this data is months old we are probably seeing 3.1% on a monthly annualized basis now given all the anecdotal evidence of rising prices and wages that are out there. That is certainly what the bond market believes with its recent sharp selloff and why I will continue to be a fantastic short. Sell every United States US Treasury Bond Fund ETF (TLT) rally. Like hockey great Wayne Gretzky said, you have to aim not where the hockey puck is, but where it's going to be.
Q: Will rising interest rates kill the housing market?
A: It already has. A 5% 30-year mortgage rate shuts a lot of first time Millennial buyers out of the market. We are seeing real estate slowing all over the country. Los Angeles is getting the worst hit.
Q: How do you see the Christmas selling season going?
A: It’s going to be great, but this may be the last good one for a while. And Amazon is getting half the business.
Q: October was terrible. How do you see November playing out?
A: It could well be a mirror image of October to the upside. We are already $1,000 Dow points off the bottom. So far, so good. Throw fundamentals out the window and buy whatever has fallen the most….like Amazon.
Did I mention you should buy Amazon?
Good luck and good trading
John Thomas
CEO & Publisher
The Diary of a Mad Hedge Fund Trader
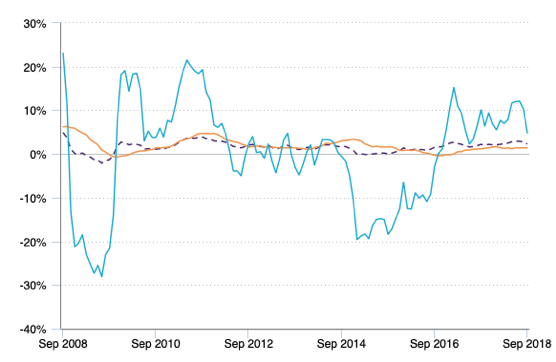


If I had a nickel for every time that I heard the term ?Sell in May and go away? this year, I could retire. Oops, I already am retired! In any case, I thought that I would dig out the hard numbers and see how true this old trading adage is.
It turns out that it is far more powerful than I imagined. According to the data in the Stock Trader?s Almanac, $10,000 invested at the beginning of May and sold at the end of October every year since 1950 would be showing a loss today. Amazingly, $10,000 invested on every November 1 and sold at the end of April would today be worth $702,000, giving you a compound annual return of 7.10%.
My friends at the research house, Dorsey, Wright & Associates, (click here for their site at http://www.dorseywright.com/) have parsed the data even further. Since 2000, the Dow has managed a feeble return of only 4%, while the long winter/short summer strategy generated a stunning 64%.
Of the 62 years under study, the market was down in 25 May-October periods, but negative in only 13 of the November-April periods, and down only three times in the last 20 years! There have been just three times when the "good 6 months" have lost more than 10% (1969, 1973 and 2008), but with the "bad six month" time period there have been 11 losing efforts of 10% or more.
Being a long time student of the American, and indeed, the global economy, I have long had a theory behind the regularity of this cycle. It?s enough to base a pagan religion around, like the once practicing Druids at Stonehenge.
Up until the 1920?s, we had an overwhelmingly agricultural economy. Farmers were always at maximum financial distress in the fall, when their outlays for seed, fertilizer, and labor were the greatest, but they had yet to earn any income from the sale of their crops. So they had to borrow all at once, placing a large cash call on the financial system as a whole. This is why we have seen so many stock market crashes in October. Once the system swallows this lump, it?s nothing but green lights for six months.
After the cycle was set and easily identifiable by low-end computer algorithms, the trend became a self-fulfilling prophecy. Yes, it may be disturbing to learn that we ardent stock market practitioners might in fact be the high priests of a strange set of beliefs. But hey, some people will do anything to outperform the market.
It is important to remember that this cyclicality is not 100%, and you know the one time you bet the ranch, it won?t work. But you really have to wonder what investors are expecting when they buy stocks at these elevated levels, over $159 in the S&P 500.
Will company earnings multiples further expand from 15.5 to 17 or 18? Will the GDP suddenly reaccelerate from a 2% rate to the 4% expected by share prices when the daily data flow is pointing the opposite direction?
I can?t wait to see how this one plays out.


 Thank Goodness I Sold in May