The Market Outlook for the Week Ahead, or From Panic to Euphoria
What a difference a month makes!
In a mere 31 days, we lurched from the worst December in history to the best January in 30 years. Traders have gone from lining up to jump off the Golden Gate Bridge to ordering Dom Perignon Champaign on Market Street.
However, not everything is as it appears. The suicide prevention hotline on the bridge has been broken for years, and you can now pick up Dom Perignon at Costco for only $120 a bottle.
Clearly, investors are enjoying the show but are keeping one eye on the exit. Perhaps that’s why gold (GLD) hit an 8-month high as nervous investors Hoover up a downside hedge against their long positions.
In fact, it has been the best January since 1987, with a ferocious start. The problem with that analogy is that I remember what followed that year (see chart below). After a robust first nine months of the year, the Dow Average (INDU) broke the 50-day moving average. It looked like just another minor correction and a buying opportunity.
The market ended up plunging 42% in weeks including a terrifying 20% capitulation swan dive on the last day. I tried actually to buy the stock at the close that day. The clerk just burst into tears and threw the handset on the floor. I didn’t get filled. Since the tape was running two hours late, NOBODY got filled on any orders entered after 12:00 PM.
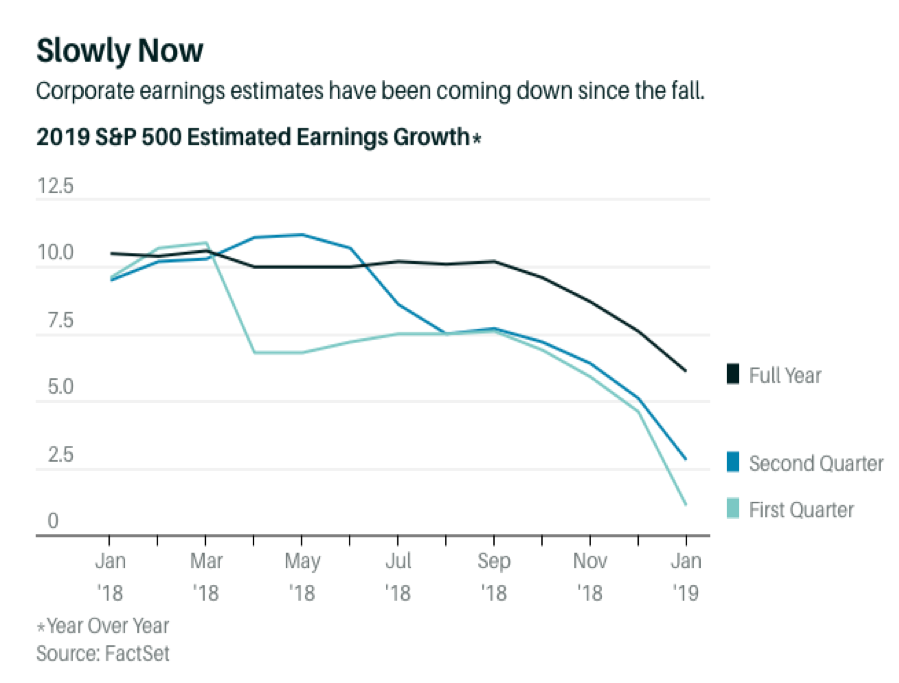
It doesn’t help that markets have been rising in the face of a collapsing earnings picture. Look at the chart below and you’ll see that after peaking out at an annualized 26% a year ago in the wake the passage of the new tax bill, earnings have been rolling over like the Bismarck on their way to zero.
If you own stocks anywhere in the world, this chart should have made the hair on the back of your neck stand up. It’s almost as if the tax bill was delivering the OPPOSITE of its intended outcome.
How multiple expansion will we get in the face of fading earnings? How about none? How about negative!
A totally red-hot January Nonfarm payroll Report on Friday at 304,000 confirmed that the economy was still alive and well, at least on a trailing basis. Headline Unemployment Rate rose to 4.0%.
The Labor Department said that the government shutdown had no impact on the numbers because federal employees were furloughed and not unemployed. Tomato, tomahto.
However, 175,000 workers were laid off in the private sector and that is why the Unemployment Rate ticked up to a multi-month high. Noise from the shutdown is going to be affecting all data for months.
That’s also why part-time workers jumped 500,000 in January. A lot of federal employees started working as Uber drivers and pizza delivery guys to put food on the table without a paycheck.
Further confusing matters was the fact that December was revised down by 90,000.
Leisure & Hospitality led the way with 74,000 new jobs, followed by Construction with 52,000 and Health Care by 42,000 jobs.
The shutdown is over, but how much did it cost us? Standard & Poor’s says $6 billion but the restart costs will be greater. More recent estimates run as high as $11 billion.
Weekly Jobless Claims were up a stunning 53,000, to 253,000, an 18-month high. While government workers can’t claim, their private subcontractors can, hence the massive shutdown-driven jump.
Bitcoin hits a new one-year low at $3,400. Some $400 billion has gone to money Heaven since 2017. Only $113 billion in market capitalization remains. I told you it was a Ponzi scheme. US coal production hits a 39-year low as it is steadily replaced by natural gas and solar. Could there be a connection? Talk about data mining.
Earnings were mixed, with some companies coming out hero’s, others as goats.
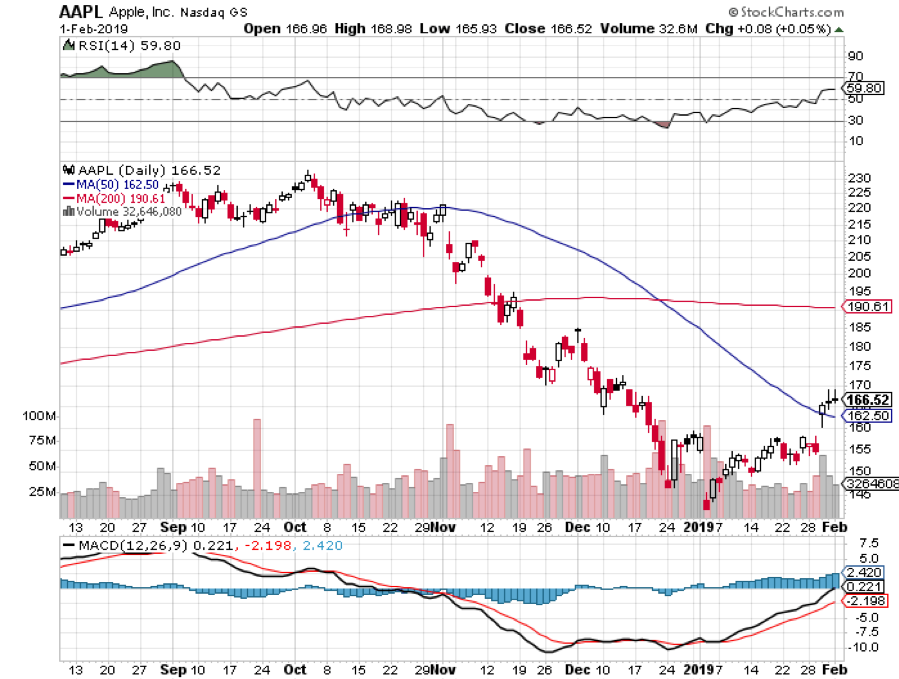
Apple (AAPL) slightly beat expectations with revenues at $84.31 billion versus $83.97 billion expected, and earnings at $4.18 per share versus $4.17 expected. Guidance going forward is very cautious of a slowing China.
Good thing I saw the ambush coming and covered my short two days ago. A penny beat is the most managed earnings I have ever seen. To warn about earnings and then surprise to the upside is classic Tim Cook.
December Pending Home Sales cratered, down 2.2% in December and 9.8% YOY. Despite the dramatically lower mortgage interest rates, buyers fled the crashing stock market.
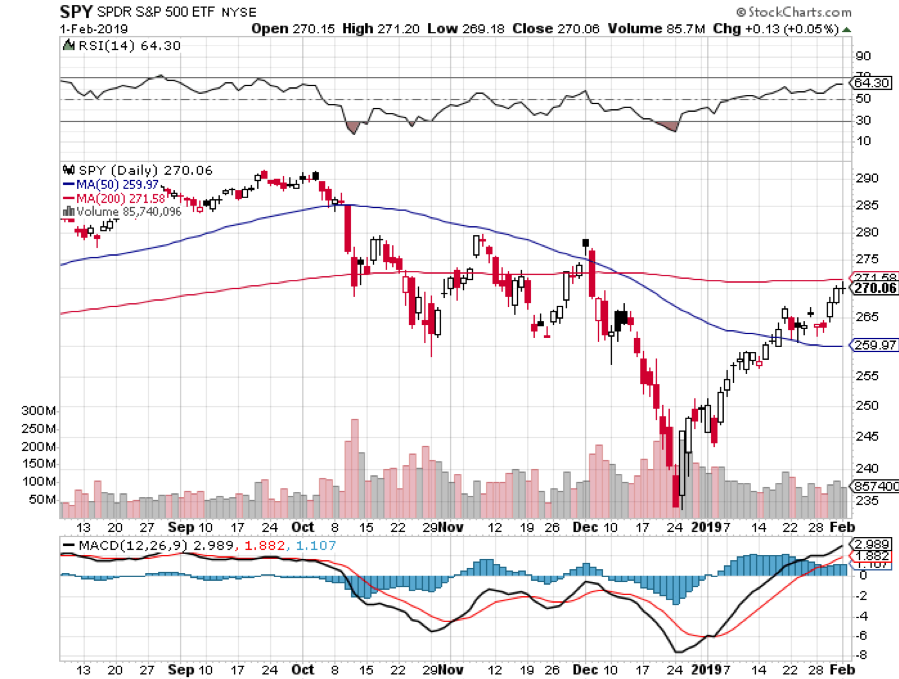
“PATIENCE” is still the order of the day at the Federal Reserve with its Open Market Committee Meeting ordering no interest rate rise. It was a trifecta for the doves. The free pass for stocks continues. That’s why I covered all my shorts starting from last week. Even a blind squirrel occasionally finds an acorn.
Tesla reported another profit for the second consecutive quarter, and the company is about to reach escape velocity. Model 3 production in 2019 is to reach 75% of the total output and we can expect a new pickup truck. A second factory in Shanghai will take the “3” to over a half million units a year. That $35,000 Tesla is just over the horizon.
Why are all major companies reporting good earnings but cautious guidance? Are they reading the newspapers, or do they know something we don’t? Not a great sign of a continuing bull market. Sell the next capitulation top.
This week was a classic example of how the harder I work, the luckier I get, and I have been working pretty hard lately.
I came out of a near money Apple (AAPL) put spread at cost, then rolled into a far money put spread just before the stock sold off. That little maneuver made me $1,030 in two days.
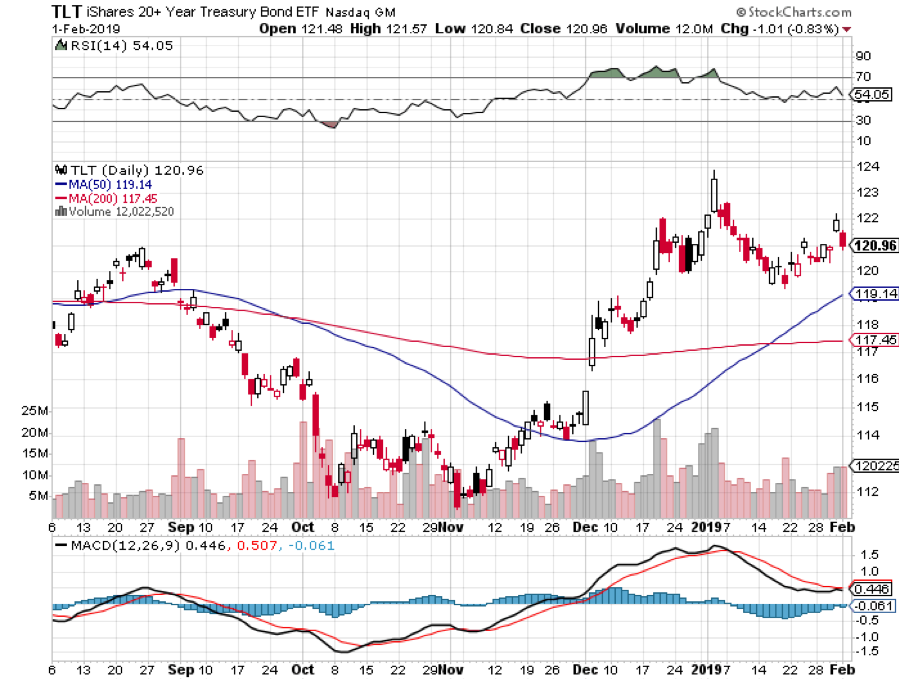
Then, I spotted a perfect “head and shoulders” top in the bond market set up by a three-point rally in the (TLT). When the red hot January Nonfarm Payroll report printed the next day at 5:30 AM PCT, bonds immediately gave back a full point.
It was all enough to boost my performance to a new all-time high after a hiatus of two months. Those who recently signed up for my service must think that I am some kind of freakin' genius! They’ll learn the truth soon enough.
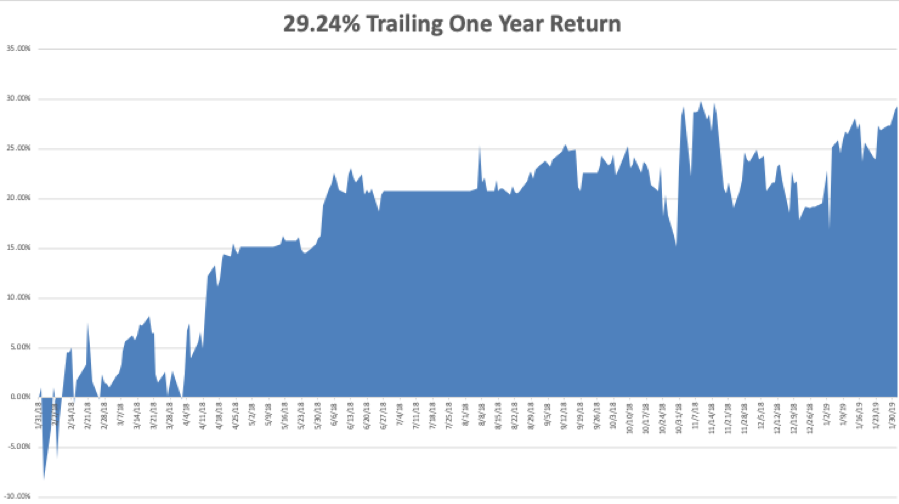
My January and 2019 year-to-date return soared to +9.66%, boosting my trailing one-year return back up to +29.24%. The is my hottest start to a New Year in a decade. Sometimes you have to make a sacrifice to the trading gods to get rewarded and that is what December was all about.
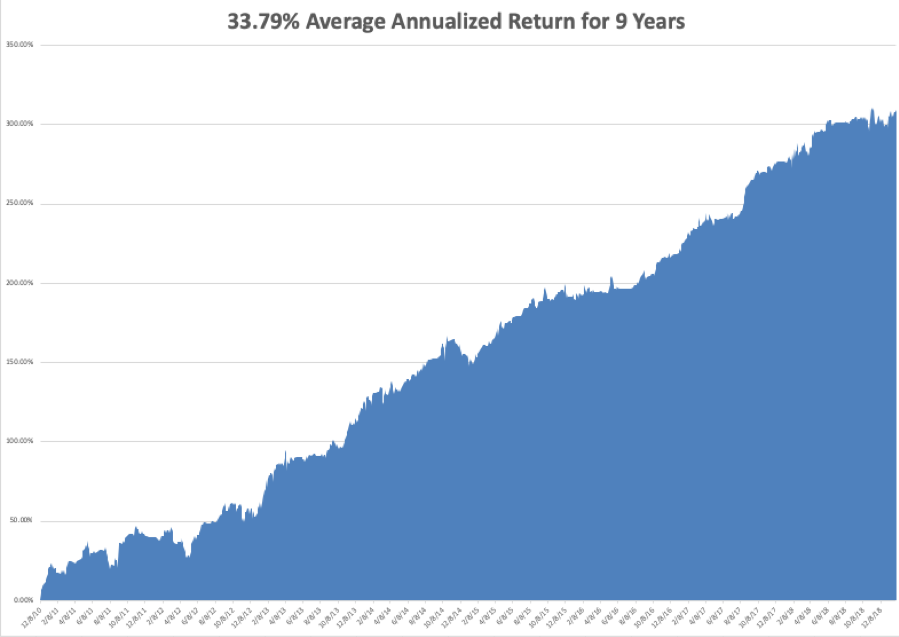
My nine-year return climbed up to +309.80%, a new pinnacle. The average annualized return revived to +33.79%.
I am now 80% in cash, short the bond market, and short Apple.
The upcoming week is still iffy on the data front because of the government shutdown. Some government data may be delayed and other completely missing. Private sources will continue reporting on schedule. All of the data will be completely skewed for at least the next three months. You can count on the shutdown to dominate all media until it is over.
Jobs data will be the big events over the coming five days along with some important housing numbers. We also have several heavies reporting earnings.
On Monday, February 4 at 10:00 AM, we get the much delayed December Factory Orders. Alphabet (GOOGL) reports.
On Tuesday, February 5, 10:00 AM EST, we learn the January ISM Non-Manufacturing Index.
On Wednesday, February 6 at 8:30 AM EST, the November Trade Balance is published.
Thursday, February 7 at 8:30 AM EST, we get Weekly Jobless Claims. December Consumer Credit follows at 9:30 AM and should be a humdinger. Intercontinental Exchange (ICE) reports.
On Friday, February 8, at 10:00 AM EST, Wholesale Inventories are out. The Baker-Hughes Rig Count follows at 1:00 PM.
As for me, I’ll be sitting down with a case of Modelo Negro and a big bag of Cheetos to watch the commercials during the Super Bowl with my family. (My dad played for USC Varsity in 1948). I never forgave the Rams for defecting from Los Angeles, and Boston is too far away to care about.
Good luck and good trading.
John Thomas
CEO & Publisher
The Diary of a Mad Hedge Fund Trader
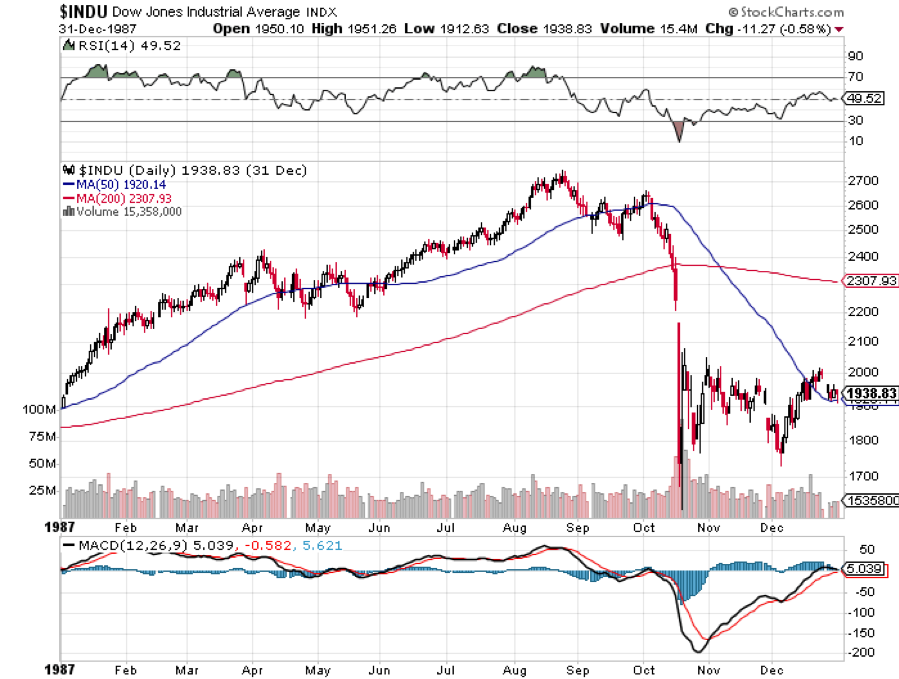
Are We in for a Repeat?