The Market Outlook for the Week Ahead, or It’s Finally Over
Could it have been the election all along?
Did the massive uncertainty created by the midterm elections hold back investors for all of ten months?
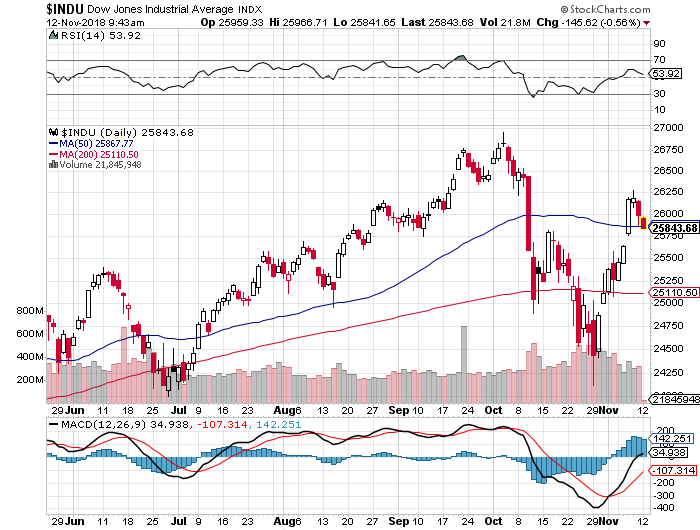
That’s what it looks like now. In a mere three days, shares made back half of what they lost in October, one of the worst trading months in stock market history.
All the market did was trade in a giant range until the day before we trudged out to our local ballot boxes. After that, it was off to the races. Who was the big winner? The people who want to make Donald Trump’s life miserable who now have countless means with which to do so.
Now that the wraps are off, the way is clear for markets to forge on to new all-time highs which they will do by yearend, or early 2019 at the latest.
The Mad Hedge Market Timing Index saw the sharpest rally in 30 years, from 4 to 29 in a week. I told you the market was cheap!
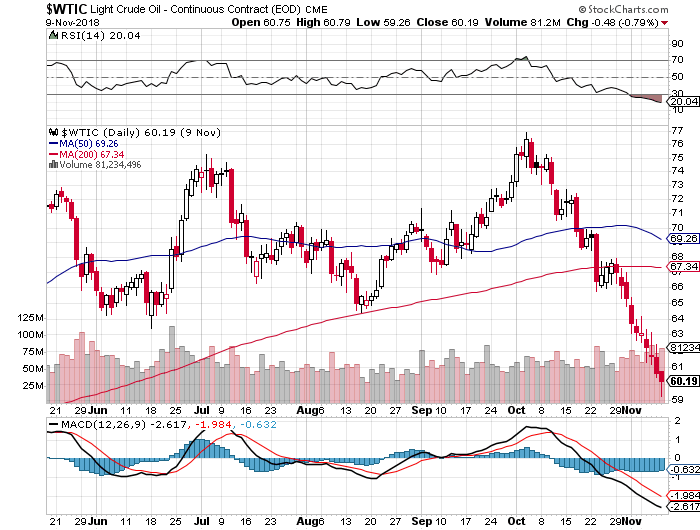
Oil prices (USO) are telling us we are already in recession. Prices are in free fall hitting $60 a barrel, a nine-month low. China certainly is hurting and they are the largest marginal new buyer of Texas tea.
What we are really seeing is a massive unwind of wrong-footed hedge fund oil longs who expected oil prices to soar with the implementation of new sanctions on Iran. They didn’t.
US Exports plunged 26% in September while tariffs paid by US companies soared by an eye-popping 54%. The destruction of American international trade is well underway. When will it end? Who’s benefiting?
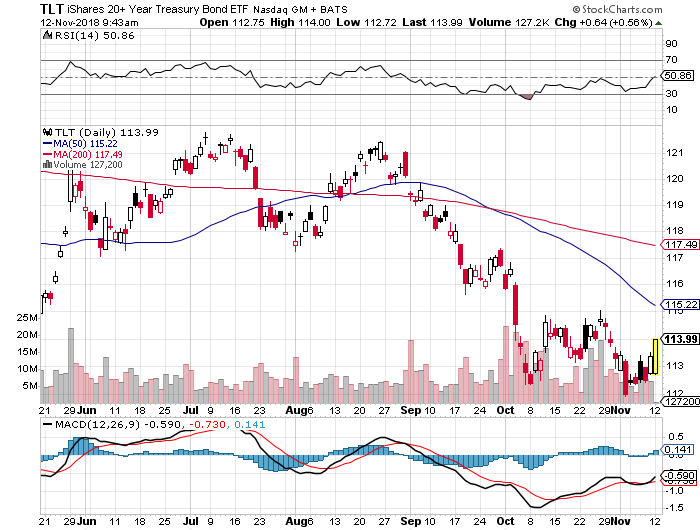
Asians are boycotting US Treasury sales and the US needs to sell to staggering $1.3 trillion in new debt in 2019. Keep hammering the (TLT) with those short positions, your new rich uncle trade.
The Producer Price Index Soared in October, up 0.6% versus 0.2% expected. Yikes, and double yikes! Inflation is here. Keep selling short those bonds (TLT)!
Trump threatened anti-trust action against all of big tech. Market yawned, with Amazon down only $50 after an enormous run-up. A 1% market share against falling prices and enormous customer satisfaction never triggered an anti-trust action before. Jeff Bezos is not the robber baron John D. Rockefeller. Could it be political?
The Number of Job Openings exceeded workers by 1 million in August, with 7.01 million openings versus 5.96 million unemployed. It’s the first time since the Dotcom Bubble top. Are we headed for a 3% Headline Unemployment Rate?
The Golden Age of Gridlock began with the Dems taking the House by flipping 40 seats and the Republicans holding the Senate. Now you can turn off your TV and focus on trading for the next two years. Buy stocks on dips, sell bonds on rallies. Oh, and the 2020 presidential election starts tomorrow.
Housing Sentiment hit a one year low, down a humongous five points, the second fastest drop in history. Rising interest rates have driven a stake through the heart of this once rip-roaring market, but it’s no 2008 replay.
November Share Buy Backs are poised to be the largest in history. Of course, you knew this was going to happen a month ago if you read Mad Hedge Fund Trader. Gotta love that tax reform!
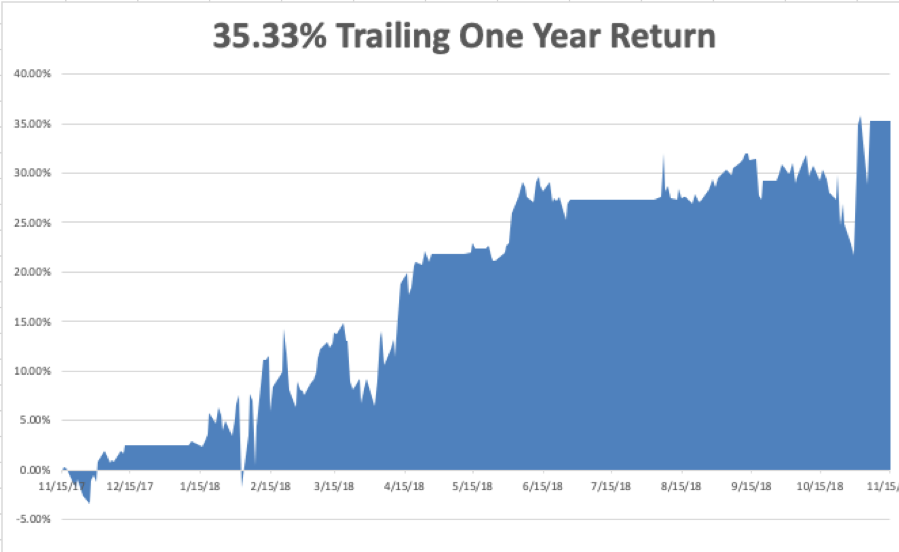
My year-to-date performance rocketed to a new all-time high of +32.94%, and my trailing one-year return stands at 35.33%. November so far stands at +3.31%. And this is against a Dow Average that is up a pitiful 4.43% so far in 2018.
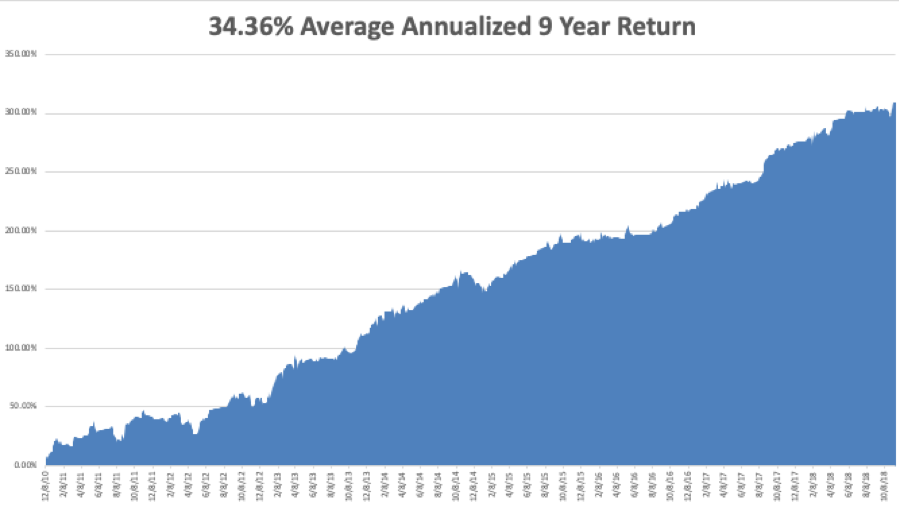
My nine-year return ballooned to 309.41%. The average annualized return stands at 34.72%. 2018 is turning into a perfect trading year for me, as I’m sure it is for you.
In the week before the election, I strapped on the most aggressive long portfolio of this year. It worked like a charm. I then went almost entirely in cash before election day, locking a 12% gain for the model trading portfolio.
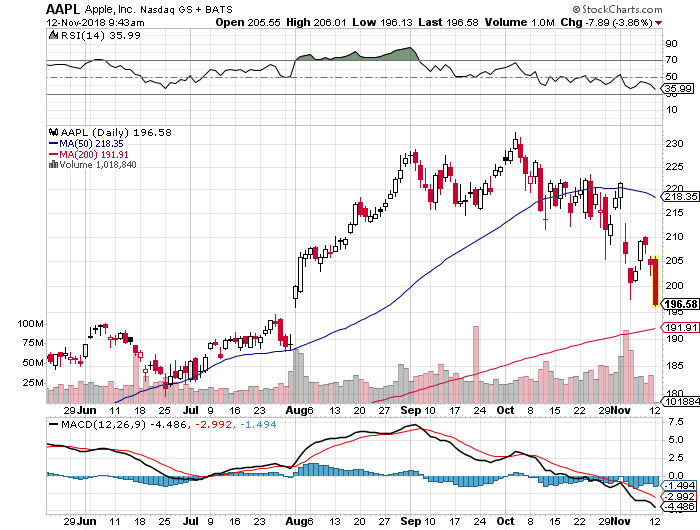
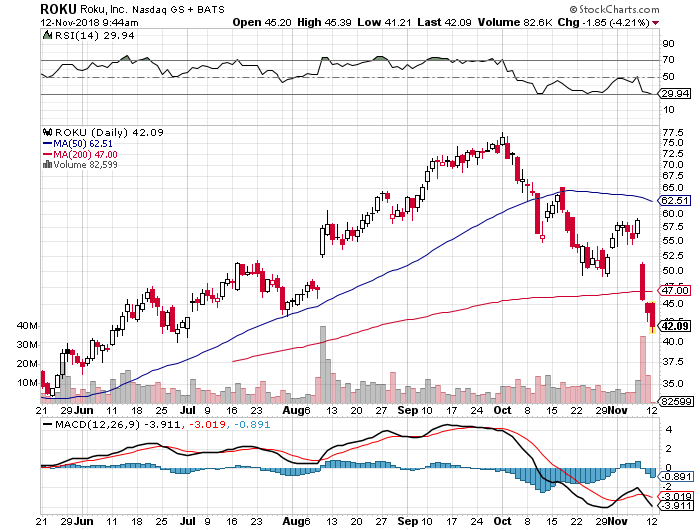
I lasted in cash on two days. On the first down 300 point Dow day, I started adding positions in the old familiar names, including Apple (AAPL), Roku (ROKU) for the Mad Hedge Technology Letter, and a short in the (TLT). Bonds could really get crushed going into yearend targeting a 3.50% yield.
Q3 earnings have finished with a whimper and the blackout periods for share buybacks are now over. Let the buying begin! Some $200 billion has to hit the market by yearend, mostly in technology stocks.
After all the recent fireworks, this will be a quiet week on the data front. The October CPI will be the big one, out on Wednesday.
Monday, November 12 is Veterans Day. Stock markets are open but bonds are closed.
On Tuesday, November 13 at 6:00 AM EST, the NFIB Small Business Optimism Index is released.
On Wednesday, November 14 at 8:30 EST, we have the all-important Consumer Price Index announced. How hot will it be?
At 10:30 AM the Energy Information Administration announces oil inventory figures with its Petroleum Status Report.
Thursday, November 15 at 8:30, we get Weekly Jobless Claims. At the same time, October Retail Sales are put out.
On Friday, November 16, at 9:15 AM, the October Industrial Production is published.
The Baker-Hughes Rig Count follows at 1:00 PM.
As for me, I am on standby to volunteer as a pilot and serve as spotter for Calfire for the latest Northern California wildfires. I put my name on the waiting list last year, and they only just got around to calling me. There were 2,000 other volunteer pilots on the waiting list ahead of me.
You gotta love America.
Good luck and good trading.
Captain John Thomas
CEO & Publisher
The Diary of a Mad Hedge Fund Trader


