Why Technical Analysis Doesn't Work
Santa Claus came early this year.
We have now rocketed all the back from -37% to a feeble 0% return for the Dow Average for 2018. By comparison, the Mad Hedge Fund Trader is up a nosebleed 8.5% during the same period.
If you had taken Cunard’s round-the-world cruise four months ago, as I recommended, you would be landing in New York about now, wondering what the big deal was. Indexes are nearly unchanged since you departed, with the Dow only 5.50% short of an all-time high.
This truly has been the Teflon market. Nothing will stick to it. Not, plague, not depression, not mass bankruptcies, not the worst economic data in history.
Go figure.
It makes you want to throw your hands up in despair and your empty beer can at the TV set. All this work and I’m delivered the perfectly wrong conclusions?
Let me point out a few harsh lessons learned from this most recent meltdown and the rip-your-face-off rally that followed.
Remember all those market gurus claiming stocks would rise every day for the rest of the year? They were wrong.
This is why almost every Trade Alert I shot out for the past two months has been from the “RISK ON” side, but only after cataclysmic market selloffs.
We have just moved from a “Buy in November” to a “Sell in May” posture.
The next six months are ones of historical seasonal market weakness. For the misty origins of this trend, read “If You Sell in May, What to Do in April?” On top of that, we have the uncertainty of the presidential election to deal with.
We go into this with big tech leaders, including Facebook (FB), Apple (AAPL), Amazon (AMZN), Google (GOOG), and Microsoft (MSFT), all at or close to all-time highs.
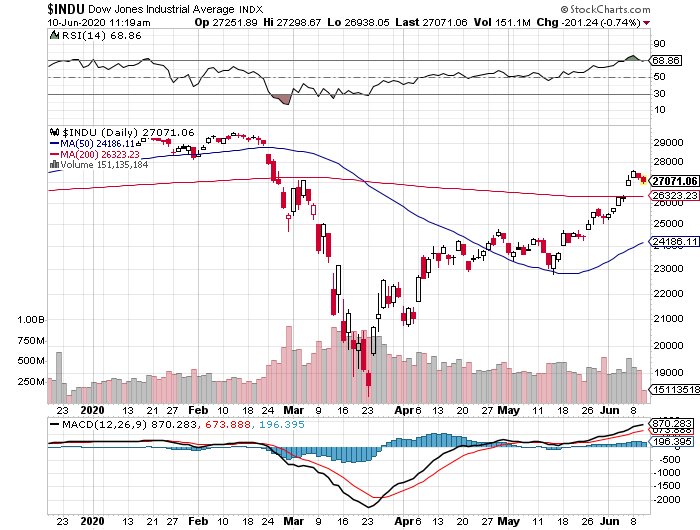
The other lesson learned this year was the utter uselessness of technical analyses. Usually, these guys are right only 50% of the time. This year, they missed the boat entirely. After perfectly buying the last top, they begged you to dump shares at the bottom.
When the S&P 500 (SPY) was meandering in a narrow nine-point range, and the Volatility Index (VIX) hugged the $11-$15 neighborhood, they said this would continue for the rest of the year.
It didn’t.
When the market finally broke down in February, cutting through imaginary support levels like a hot knife through butter ($26,000? $25,000? $24,500?), they said the market would plunge to $24,000, and possibly as low as $22,000.
It didn’t do that either.
If you believed their hogwash, you lost your shirt. The market just kept going, and going, and going down to $18,000.
This is why technical analysis is utterly useless as an investment strategy. How many hedge funds use a pure technical strategy? Absolutely none, as it doesn’t make any money on a stand-alone basis.
At best, it is just one of 100 tools you need to trade the market effectively. The shorter the time frame, the more accurate it becomes.
On an intraday basis, technical analysis is actually quite useful. But I doubt a few of you engage in this hopeless persuasion.
This is why I advise portfolio managers and financial advisors to use technical analysis as a means of timing order executions, and nothing more.
Most professionals agree with me.
Technical analysis derives from humans’ preference for looking at pictures instead of engaging in abstract mental processes. A picture is worth 1,000 words, and probably a lot more.
This is why technical analysis appeals to so many young people entering the market for the first time. Buy a book for $5 on Amazon and you can become a Master of the Universe.
Who can resist that?
The problem is that high-frequency traders also bought that same book from Amazon a long time ago and have designed algorithms to frustrate every move of the technical analyst.
Sorry to be the buzzkill, but that is my take on technical analysis.
Hope you enjoyed your cruise.


