Will the Markets Bottom Tomorrow?
Let the healing process begin!
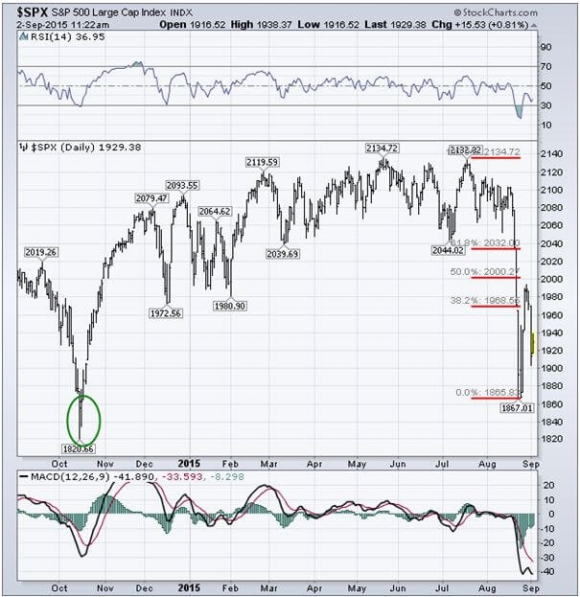
Having just barely missed tickling a new all time high in early August at $214, then tagging a cataclysmic low at $186 on August 24, the market has defined the range that it will settle into for the next 4-6 weeks.
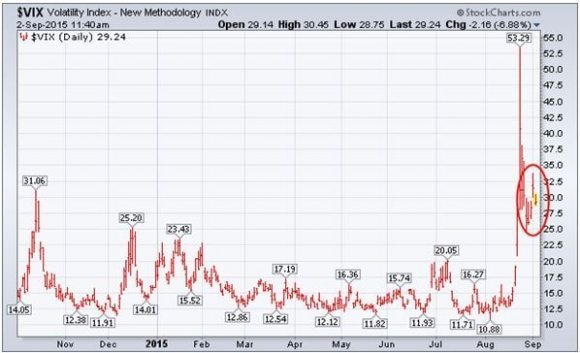
What then follows are a series of lower highs and higher lows to create a rightward pointing apex of a triangle on the charts. This also will cause volatility (VIX) to bleed off substantially.
This scenario leads to a final upside breakout in October. You can bet the ranch on that.
Yesterday?s successful test of the low end of the range only gives further credence to this analysis.
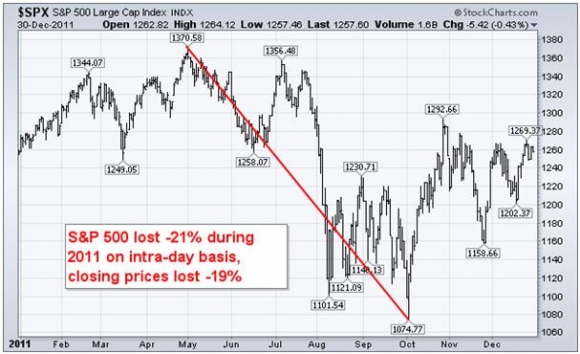
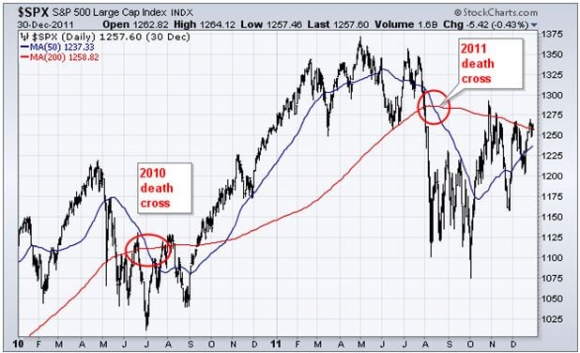
To prove that history not only repeats itself, it hums, whistles, and rhymes, look at the charts below for the last major low in 2011 so eloquently produced by my friends at Stockcharts.com.
Expect an encore of this performance.
I am not so confident of this prediction because I am cocksure, presumptuous, or full of hubris.
Ever the mathematician (with many thanks to John Nash, Fisher Black, Myron Scholes, and Edward Lorenz), I simply point to the numbers 3.7, 5.3, 18, 10, 40, 15, 13.5.
What, you don?t recognize these digits? Pshaaaw! They should be at the tip of your tongue.
Let me inform you.
3.7% was the blistering US Q2 GDP growth.
5.3% is the latest headline unemployment rate, a decade high.
18 million is annual sales rate the American auto industry headed for.
10 is the number of years since we have seen new housing starts that were this hot.
$40 a barrel means the global energy tax cut is increasing.
15 was the 2015 S&P 500 earnings multiple at the August $186 low.
13.5 was the 2016 S&P 500 earnings multiple at the August $186 low.
What all of these mean is that the summer swoon in share prices is purely a stock market only event. It is not at all justified by the hard data spewing out of the economy, which is strengthening by the day.
Markets behave rationally most of the time, moving based on their underlying fundamentals. But occasionally they go crazy, and emotion, superstition, and folk economics take over.
This is one of those crazy times.
And like any errant child who suddenly throws a temper tantrum at the shopping mall, the best thing to do is ignore it.
If you embarked on the Queen Mary 2 100 day Around the World cruise in early August, as many of my readers are prone to do, thanks to my many postings from the fabulous Cunard ship, and didn?t come home until November, I doubt they would find any change in share prices.
They would think it was just another boring autumn.
I am sorry to have to delve into the mumbo jumbo of all these technicals after spending nearly a decade training you that fundamentals rule all.
But in insane conditions like these, technicals take the lead.
You can see this in how the indexes perfectly test, pivot, and reverse around key Fibonacci numbers (click here for ?My Old Pal, Leonardo Fibonacci).
So if you are a long-term investor, just turn off your TV, send all that dubious stock research to your spam folder, and take the above mentioned cruise.
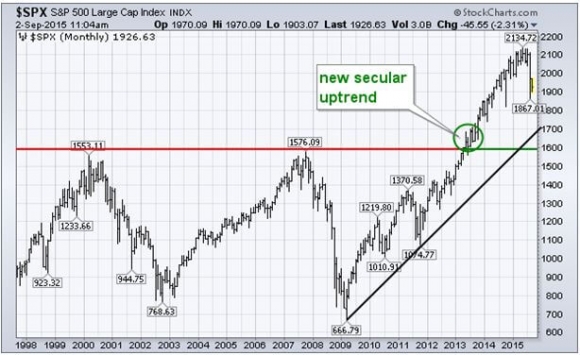
In the long-term scheme of things, the current market sturm und drang will amount to absolutely nothing.
If you?re a short-term trader, keep you head low and you positions small, as I have done. Live to fight another day.
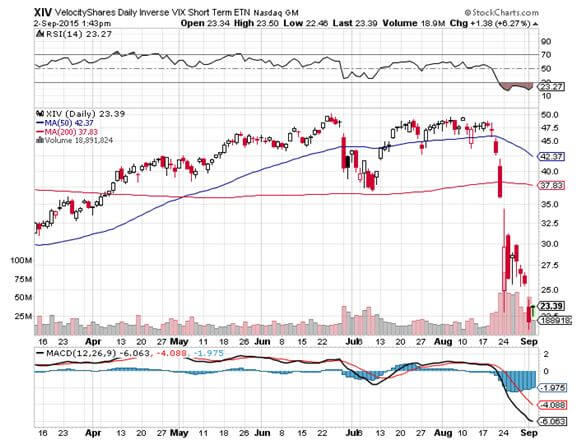
It also might be a good time to sell short volatility (VIX), (XIV), which I did on Tuesday.
After a few heart stopping hours, the (VIX) has plunged from $32 to $27, and I am already well in the money.


